

 02 August, 2017


In May 2017, the Central Statistics Office released the new series of the Index of Industrial Production with 2011-12 as the base year, after a comprehensive revision of computation methods. The series almost entirely reverses the performance picture of Indian manufacturing, showing sharp upward revisions in the growth of activity. This column finds that the new index is likely to show inflated growth during times of falling inflation. Thus, deciphering the actual change in production continues to be difficult.
On 12 May 2017, the Central Statistics Office (CSO) released the new series of the Index of Industrial Production (IIP) with 2011-12 as the base year, after a comprehensive revision of computation methods. Broadly, the revision includes addition and deletion of commodities, changes in weight and composition of commodity groups, and changes in data sources. The new IIP series was also aimed at improving the coverage of manufacturing activities, and resolving conflicts around the diverging trends of the sector as captured by the 2011-12 GDP (gross domestic product) series.
Despite bringing about some improvements, the new series has thrown up new questions, and to some extent, has also altered our view on the performance of the manufacturing sector. The old IIP series (with 2004-05 base year) showed low and stagnating manufacturing activity, whereas the new series almost entirely reverses the picture by showing sharp upward trends in manufacturing growth. In this column, we raise two questions: First, what explains the divergence (or at least a part thereof) between the old and new series, and second, whether the revision has helped improve our understanding of the performance of the manufacturing sector? For the analysis in this column we use the manufacturing component of IIP, which constitutes the major chunk of the index.
Performance of the manufacturing sector
To get a sense of the difference in the trends, we plot the year-on-year growth rates of the IIP (manufacturing) from the old and new series for the period between April 2013 and February 2017 (Figure 1).
Figure 1. Annual % change in IIP (manufacturing) from 2004-05 and 2011-12 series, April 2013 to February 2017
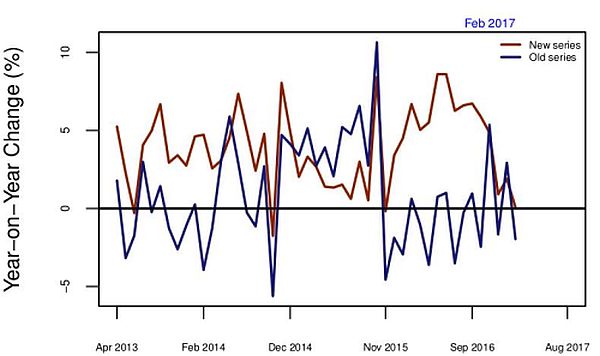
In some periods the old and new series show a very different picture of the manufacturing sector, especially between April 2013 and January 2014, and from September 2015 until around June 2016. The new series revised the annual growth figures from 0.8% to 3.6% in 2013-14, and from 0.1% to 4.9% in 2016-17. From the CSO’s explanation for such revisions, we gather that, among other factors, the new series includes a higher number of value-based items in the index. In the old series, there were 54 value-based items, while in the new series the number is 109. To convert to volume, value-based data are deflated using an appropriate deflator from the WPI (Wholesale Price Index). Does this change explain part of the difference in trends?
Value- vs. volume-based commodities
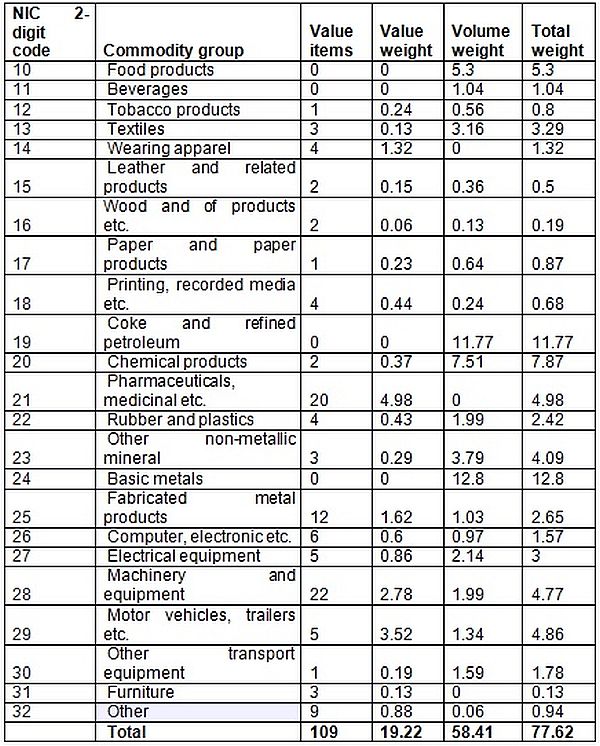
Let’s look at some stylised facts about value-based commodities. The 109 value-based commodities in the new series are spread over 23 groups. Table 1 shows the distribution of value- and volume-based commodities across the manufacturing commodity groups. The commodity groups having 2-digit NIC-2008 (National Industrial Classification for India)1 codes from 10 to 32 belong to the manufacturing group. The table shows that the item group 21 has the maximum coverage of value-based items. In terms of weight, the value-based items constitute 19.22% of IIP (manufacturing). In terms of numbers, the value-based items constitute 25% of the total number of items. These shares are significant enough to bring about a change in IIP (manufacturing).
Table 1. Distribution of value- and volume-based items in the manufacturing basket
To understand the relative contribution of value- versus volume-based commodity groups, we classify the manufacturing commodity groups as follows:
- Group item is completely volume based: For instance, NIC code 10 – ‘Manufacture of food products’ – has volume-based items with a weight of 5.3025% in IIP (manufacturing) index. Interestingly, there are only three categories which are purely volume based.
- Group item is completely value based: For instance, NIC code 21 – ‘Manufacture of pharmaceuticals, medicinal chemical and botanical products’ – has value-based items, with a weight of 4.9810% in IIP (manufacturing).
- Group item is both volume and value based: For instance NIC code 29 – ‘Manufacture of motor vehicles, trailers and semi-trailers’ – has a total weight of 4.8573%, of which, 3.5192% is value based and 1.3381% is volume based.
We then reconstruct IIP (manufacturing) in terms of value- and volume-based item groups. Figure 2 shows the contribution of value- and volume-based items in growth of IIP (manufacturing) for each quarter starting from April-June 2013 until January-March 2017.
Figure 2. Contribution of value- and volume-based items to growth of IIP (manufacturing), April-June 2013 to January-March 2017
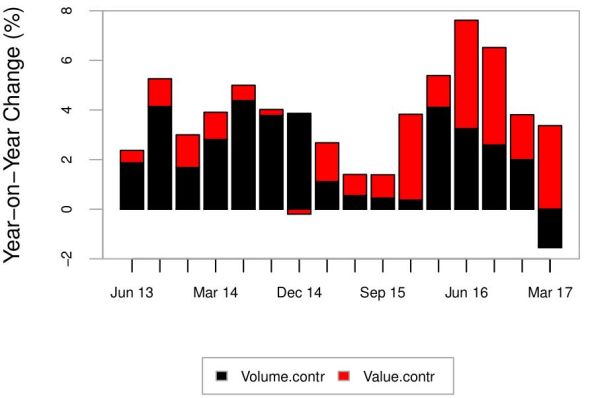
It is evident that the share of value-based items has risen substantially, and is much higher than that of volume-based items since September 2015. It is worth noting that the period of rise in the share of value-based items roughly coincides with the period of divergence between the old and new series.
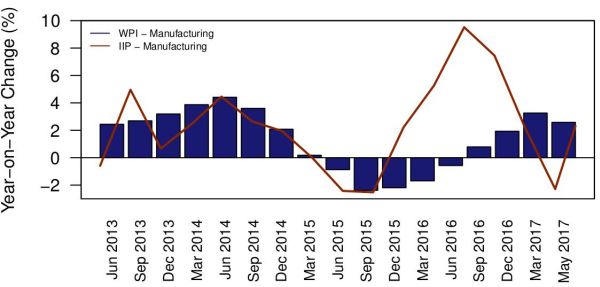
The value-based items are to be deflated by WPI to get a measure of production volume. If we map the growth trends of IIP (manufacturing), the period of rise in the index post September 2015 coincides with the fall in the WPI index. Figure 3 shows the trends in the growth rate of both the indices between April-June 2013 and January-March 2017. It is evident that the high growth rate of IIP (manufacturing) and hence the divergence with the old series is partly a result of increase in contribution of value-based items and the fall in the WPI deflator between September 2015 and around June 2016.
What does the new IIP series tell us about manufacturing?
A key finding that emerges from this analysis is that the trends of IIP (manufacturing) are now increasingly affected by movements in WPI. The new series is likely to show inflated growth during times of falling inflation. Therefore, the sharp rise in the growth of IIP need not be on account of actual rise in production volume in industries.
Figure 3. Trajectory of growth in IIP (manufacturing) (new series) and WPI inflation, April-June 2013 to January-March 2017
Another objective of the revision in methodology was to improve the coverage of IIP (manufacturing) so as to make the index representative of the actual structure of manufacturing activities. While this objective was partly achieved, the index still misses out on the representation of the unorganised manufacturing sector. The report of the Working Group on IIP has already outlined several concerns regarding this. Until such issues are effectively resolved, the index remains insufficient for understanding the state of affairs of Indian manufacturing.
The CSO’s press release states that the old and new series are not strictly comparable. Nevertheless, the revision has brought new challenges. Deciphering the actual change in production continues to be a difficult task. So, what does the new IIP series tell us about manufacturing? The answer is clear: while the revision has improved the quality of the index, its main purpose of capturing volume of manufacturing production has been overshadowed by the nuances of revisions and the technicalities of the index.
Note:
- The National Industrial Classification (NIC) is the standard classification followed for classifying economic activities in India. The NIC is prepared to suit the Indian conditions and follows the principles and procedures laid down in the United Nations’ International Standard Industrial Classification (ISIC). A standardised system of classification of economic activities is essential for meaningful collection of data relating to such activities, and for intra- and inter-country comparisons of data. The NIC codes are released by the CSO. To take care of changes in industrial structure, these codes are revised periodically. The most recent revision was done in 2008.
Further Reading
- Central Statistics Office (2017), ‘Revision of Base Year of All-India Index of Industrial production from 2004-05 to 2011-12’, Press Release, Ministry of Statistics and Programme Implementation, Government of India, 12 May 2017.
- Central Statistics Office (2014), ‘Report of the Working Group for Development of Methodology for Compilation of the All-India Index of Industrial Production with Base Year 2009-10/2011-12’, Ministry of Statistics and Programme Implementation, Government of India, April 2014.

Comments will be held for moderation. Your contact information will not be made public.