

 22 November, 2018


Despite having lower per capita income, Bangladesh has superior performance over India on key welfare indicators. This article compares the experiences of India and Bangladesh on several key indicators during 1990-2015 using two different datasets. It finds better performance of Bangladesh on infant mortality rate with a lower boy-girl sex ratio at birth than India. While both countries record an impressive decline in fertility rates, this was accompanied by a worsening of the sex ratio in India but not in Bangladesh.
A few years ago, eminent economist Amartya Sen noted the superior performance of Bangladesh over India on several key welfare indicators. These included life expectancy, child health and mortality, fertility rate, and female literacy. Sen’s observation is consistent with that of several other commentators, for example, Mustafizur Rahman, who noted that “Bangladesh Is Leading The Way In Terms Of Development In South Asia, Exposing The Failings Of Its Gigantic Neighbour”- . Rahman considers several other indicators such as percentage of households with waste disposal facilities, perception that children are learning, and satisfaction with educational quality, to argue that India is the second worst performer in South Asia, ahead of only Pakistan. Bangladesh’s achievement is impressive given that its per capita income is lower than that of India and so is its growth rate. Largely due to the civil war, Sri Lanka has given way to Bangladesh as the leading example in support of the view that higher per capita income and superior growth rates do not automatically translate to improvement in the quality of life. While several challenges remain, in areas such as environmental degradation, employment, inequality, and building a more inclusive society, Bangladesh is noted for its satisfactory performance on several indicators under the Millennium Development Goals (MDGs).
Motivation behind comparing India & Bangladesh
Building on recent literature comparing India and Bangladesh, this article updates the earlier evidence by using the latest Demographic and Health Surveys (DHS) available for both countries. Though not conducted on overlapping time periods, the surveys in the two countries can be considered reasonably contemporaneous allowing a meaningful comparison. The comparison is based not just at a point in time but on the trends in selected indicators, namely, infant mortality rates (IMR) (defined as deaths per 1,000 live births), child nutrition (example, prevalence of underweight, wasting, and stunting), total fertility rates (TFR) and the sex ratios (SR) at birth (male births per female births). A comparison of the trends reveals some interesting features.
There has been a series of articles written on the puzzle – why India, which is doing better on several health indicators compared to sub-Saharan Africa, is doing worse in terms of stunting. Panagaria (2013) rejects the claim that India is doing badly compared to sub-Saharan Africa in improving child malnutrition. He argues that the use of common height reference standard in the WHO (World Health Organization) anthropometric measure is at fault citing the role of genetic differences across countries.
Spears (2018) highlights the role of open defecation as one the key explanatory factors behind this 'Asian enigma' and finds the difference in sanitation can fully account for the large (18%) child mortality gap between Hindus and Muslims in India. Jayachandran and Pande (2013) mention the role of eldest son preference in India behind the steep birth order gradient in height. In this context, it is interesting to compare the performance of India with Bangladesh which is arguably much more similar in terms of geographical/socio-cultural and genetic aspects.
Datasets and results
This study is based on the DHS datasets for both countries (known as NFHS (National Family Health Survey) for India). Those for Bangladesh relate to 1993-94, 1999-2000, 2004, and 2014, and the NFHS are for the years, 1991-92, 1989-99, 2005, and 2015. In addition, we used TFR for woman aged 15-49 and SR at birth based on information provided in the World Development Indicators (WDI) available from the World Bank. A comparison between the fertility rates calculated from the surveys with that from the WDI confirms robustness of these rates to datasets.
Table 1 compares the IMRs, underweight-, wasting- and stunting rates in the two countries during the past two and a half decades. Where data has permitted, we have also provided the rural-urban breakdown in the estimates. In case of nearly all the indicators, Bangladesh records superior outcomes over India at the end of the chosen period based on the most recent DHS rounds available. Infant mortality stands out as one area where Bangladesh’s performance has been remarkable. It started in the early 1990s with a much higher rate (100.5) than India (78.5), but by the end of the period, the situation has reversed itself drastically (38 in Bangladesh, 40.7 in India). The rural-urban breakdown shows that the superior performance is recorded in both sectors with rural Bangladesh recording a decline by nearly 60% between 1993-94 and 2014 compared to a 50% decline in rural India over similar period. The WHO (2015) has noted a range of policy initiatives that led to this impressive performance in Bangladesh. While several of these initiatives were undertaken by the government often with the help and supervision of the WHO, public private partnerships (PPP) between NGOs (non-governmental organisations) and the government also played a key role in bringing down the IMRs. While Bangladesh records distinctly superior performance on ‘child wasting’ compared to India, they are quite similar on ‘child stunting’. Notwithstanding impressive declines in the rates of ‘stunted children’, nearly one in three children still suffer from low weight in both countries. Child wasting has not only shown stubborn resistance to declines, there has been a marginal deterioration as well.
Table 1. Infant mortality and child nutrition, India vs. Bangladesh
|
|
India |
|
|
|
Bangladesh |
|
|
|
|
|
1991-92 |
1998-99 |
2005 |
2015 |
1993-94 |
1999-00 |
2004 |
2014 |
|
Infant mortality ratea |
||||||||
|
Urban |
59.4 |
49.2e |
41.5 |
28.5 |
80.9 |
74.5 |
72 |
34 |
|
Rural |
94.3 |
79.7e |
62.2 |
45.5 |
102.6 |
80.7 |
72 |
40 |
|
All |
78.5 |
67.6 |
57 |
40.7 |
100.5 |
66 |
65 |
38 |
|
Prevalence of underweight children under 5 (%)b |
||||||||
|
Urban |
45.2f |
38.4 |
32.7 |
29.1 |
- |
39.8 |
42.2 |
26.1 |
|
Rural |
55.9f |
49.6 |
45.6 |
38.3 |
- |
49.2 |
48.8 |
34.8 |
|
All |
53.4f |
47 |
42.5 |
35.7 |
64g |
47.7 |
47.5 |
32.6 |
|
Prevalence of wasting in children under 5 (%)c |
||||||||
|
Urban |
15.8 |
13.1 |
16.9 |
20 |
- |
9.3 |
11.5 |
12.2 |
|
Rural |
18 |
16.2 |
20.7 |
21.4 |
- |
10.6 |
13.2 |
15.1 |
|
All |
17.5 |
15.5 |
19.8 |
21 |
17g |
10.3 |
14.5 |
14.3 |
|
Prevalence of stunting in children under 5 (%)d |
||||||||
|
Urban |
44.8 |
35.6 |
39.6 |
31 |
- |
35 |
37.6 |
30.8 |
|
Rural |
54.1 |
48.5 |
50.7 |
41.2 |
- |
46.6 |
44.3 |
37.9 |
|
All |
52 |
45.5 |
48 |
38.4 |
64g |
44.7 |
43 |
36.1 |
Notes: a Rate refers to 0-4 years preceding the survey; expressed in terms of deaths per 1,000 live births.
b Rate refers to 0-4 years preceding the survey; expressed as below minus two standard deviations from median weight for age of reference population.
c Rate refers to 0-4 years preceding the survey; expressed as below minus two standard deviations from median weight for height of reference population.
d Rate refers to 0-4 years preceding the survey; expressed as below minus two standard deviations from median height for age of reference population.
e Rate refers to 10 years preceding the survey.
f Rates are based on 1992-93.
g Rates are based on Multiple Indicator Cluster Survey 1993.
Figure 1 shows the movement in TFRs and IMRs over time in the two countries. These are based on information contained in the DHS datasets. Both sets of rates register a sharp decline over this period. Bangladesh’s decline in IMR is more impressive, with much of the decline, and an accelerated one, taking place during the most recent periods, outstripping that of India. A similar picture is revealed regarding total fertility rates with the TFR of Bangladesh falling below that of India in the new millennium round the time when the IMR has changed places as well. Clearly, the last decade (2005-2015) has been the period when Bangladesh moved ahead of India on both indicators. Ahmed (2017) noted that the marked decline in IMR was attributed to a highly successful child immunisation programme in Bangladesh, but we intend to explore other policy instruments in further work.
Figure 1. Total fertility- and infant mortality rates, India vs. Bangladesh
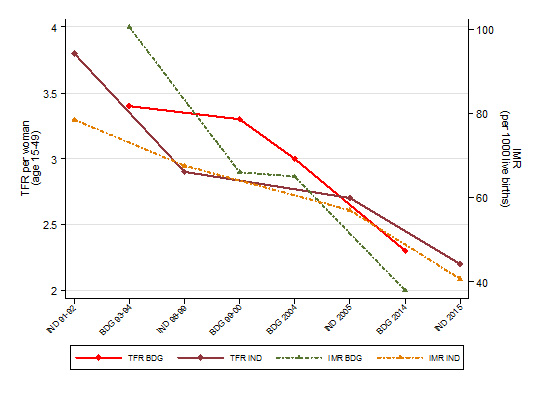 Source: Authors’ computation based on data derived from BDHS 2014, NFHS 2015. Fertility rates refer to three-year period preceding the survey (approximately); expressed in terms of per woman. IMR refers to 0-4 years preceding the survey; expressed in terms of deaths per 1,000 live births.
 Figure 2 shows the movements in TFRs and SRs at birth in the two countries over the longer period, 1990-2015. Unlike the estimates in Table 1 and Figure 1, these are based on the WDI, not on the DHS. Consistent with Figure 1, while both countries record a decline in TFR, the decline is faster in Bangladesh with its rate falling below that of India in the late 1990s, somewhat earlier than that recorded in Figure 1 based on the DHS datasets. Since there is evidence that TFR is positively correlated with IMR, this finding does not seem surprising given the sharp decline in IMR in Bangladesh (Ahmed 2017). Of greater interest in this figure is the two part result that (a) the SR at birth in favour of boys is much higher in India than in Bangladesh, and (b) while the SR has remained largely unchanged in Bangladesh, it has increased sharply in India over this period. Note, however, that after the sharp increase in the SR in India in the earlier years, the ratio seems to have stabilised in recent years, especially over the period, 2005-2015. While the Indian experience provides some support to the suggestion by Jayachandran (2017) that declining fertility rates lead to a worsening of the boy-girl SR via an increase in sex-selective abortion, the Bangladesh experience suggests otherwise, since even with a sharp decline in its fertility rates, the SR has remained largely unchanged. Thanks to social awareness promoted by policy initiatives, a declining fertility rate does not necessarily lead to an increase in the SR at birth. Talukder, Rob, and Noor (2014) provide an insightful analysis of the reasons for the low boy-girl SR in Bangladesh including a discussion of the gender equality initiatives that have led to ‘societal change towards valuing daughters as highly as sons’. This article also describes the role of the NGOs in Bangladesh in promoting gender equality. Muhammad (2018) has also discussed the positive role played by the largest NGO anywhere (BRAC (Building Resources Across Communities)) and the largest microfinance institution (Grameen Bank) in Bangladesh. India has much to learn from the Bangladeshi experience.
Figure 2. Trends in total fertility rates and sex ratios at birth, India vs. Bangladesh
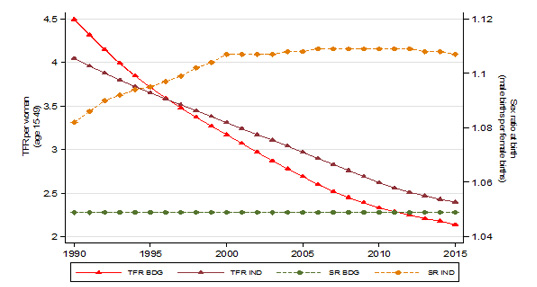 Source: Authors’ computation based on data derived from World Bank World Development Indicator Database. Fertility rates refer to three-year period preceding the survey (approximately); expressed in terms of per woman.
 The two sets of fertility rates calculated and used in Figures 1 and 2 are based on different data sources with one using household level data while the other is at the country level. This raises the issue of robustness of the fertility rates to datasets. Table 2 provides evidence on this by comparing the fertility rates between the two data sources (WDI and DHS). It is reassuring to note that the fertility rates are reasonably robust between the two datasets, with the differences between the rates from WDI and DHS narrowing for both countries in the most recent period.
Table 2. Robustness of fertility rates to data sources
| Year | Country | Total fertility rate per woman (age 15-49) | Source |
|---|---|---|---|
| 1993-94 | Bangladesh | 3.4 | DHS |
| 1999-00 | Bangladesh | 3.3 | DHS |
| 2004 | Bangladesh | 3 | DHS |
| 2014 | Bangladesh | 2.3 | DHS |
| 1991-92 | India | 3.8 | NFHS |
| 1998-99 | India | 2.9 | NFHS |
| 2005 | India | 2.7 | NFHS |
| 2015 | India | 2.2 | NFHS |
| 1993 | Bangladesh | 3.99 | World Bank |
| 2000 | Bangladesh | 3.17 | World Bank |
| 2004 | Bangladesh | 2.78 | World Bank |
| 2014 | Bangladesh | 2.18 | World Bank |
| 1991 | India | 3.96 | World Bank |
| 1998 | India | 3.45 | World Bank |
| 2005 | India | 2.97 | World Bank |
| 2015 | India | 2.4 | World Bank |
Source: Authors’ computation based on data derived from BDHS (different rounds), NFHS (different rounds) and World Bank World Development Indicator database.
Concluding remarks
This article compares the performance of India and Bangladesh in the most recent period (1990-2015) on several key demographic indicators based on information from the DHS datasets and the WDI. It documents the superior performance of Bangladesh on infant mortality that was particularly significant in the most recent period (2005-15), though on other indicators such as child nutrition and fertility rates, the difference is not that marked. A result that is worth exploring is the worsening of the sex ratio at birth in India while that in Bangladesh has remained largely unchanged, along with the result on the much higher sex ratios in India compared to that in Bangladesh.
Further Reading
- Ahmed, S (2017), ‘The Demographic Impact of Extended Paid Maternity-Leave in Bangladesh’, International Growth Centre (IGC) blog, 19 May 2017.
- Jayachandran, Seema (2017), “Fertility Decline and Missing Women”, American Economic Journal: Applied Economics, 9(1): 118-139.
- Jayachandran, S and R Pande (2013), ‘Why are Indian Children Shorter than African Children?’, Mimeographed, Harvard University.
- Muhammad, Anu (2018), “Rise of the Corporate NGO in Bangladesh”, Economic and Political Weekly, 53(39): 45-52.
- Panagariya, Arvind (2013), “Does India Really Suffer from Worse Malnutrition than Sub-Saharan Africa?”, Economic and Political Weekly, 48(18): 98-111.
- Spears, Dean (2018), “Exposure to open defecation can account for the Indian enigma of child height”, forthcoming, Journal of Development Economics.
- Talukder, MN, U Rob and FR Noor (2014), ‘Assessment of Sex Selection in Bangladesh’, Population Council, Dhaka.

By: Rahul 10 October, 2019
Strange that this exercise was not conducted with Bengal data alone being compared to Bangladesh, instead of the data for whole of India. It would make much more sense to conduct such a comparison as India groups together many culturally different areas which can be driving the difference.