

 27 May, 2015


Since India made eight years of education compulsory, the number of 6-14 year olds going to school has grown by almost two million. Analysing data from (undivided) Andhra Pradesh, this column finds that the rise in enrolment is associated with a worrying collapse in learning standards. Exploration of factors leading to this decline is essential in the wake of increasing investment in elementary education.
Given that children (0-18 years of age) in India constitute one-third of the total population and every fifth child in the world is Indian (Census of India, 2011), it is critical that every child’s right to development, as defined by the Indian Constitution, is realised through an enabling education. Education is a tool for empowerment, and has been enshrined as a Fundamental Right of each Indian citizen through the Right to Education (RTE) Act, 2009, and a means to obtain other rights. Investing in education constitutes a strong foundation, which will enable India to take advantage of the demographic dividend that its relatively young population offers. RTE along with initiatives such as Sarva Shiksha Abhiyan (SSA) (Universalisation of Elementary Education), launched in 2000-01, have contributed to almost 2 million children in the 6-14 age group enrolling into both government and private elementary schools across the country, resulting in Gross Enrolment Ratio (GER)1 of 106.3 in 2012-13 (DISE 2013). The National Policy for Children, 2013 affirms that every child has an equal right to learning, knowledge, and education, towards the development of the child’s fullest potential. India boasts of one of the largest school systems in the world with 1.44 million elementary schools (District Information System for Education (DISE) 2014), 226,613 secondary and 103,569 higher secondary sections in 2013-14 (Secondary Education Management Information Systems (SEMIS) 2014).
‘Young Lives’ data
Young Lives, a longitudinal2 research study on childhood poverty, has been following 3,000 children comprising two cohorts - eight year olds (1,000 children) and one year olds (2,000 children) – in undivided Andhra Pradesh (now, Telengana and Andhra Pradesh) since 2002. In 2013, the fourth round of survey was completed. The first cohort of children completed 12 years of age in 2006 and the second cohort of children were aged 12 years in 2013; the data allows comparison of 12-year-olds in 2006 with 12-year-olds in 2013. The 2013 survey has shown an encouraging trend of 97% of elementary school enrolment among 12-year-olds, up from 89% in 2006 (Figure 1). Given that Young Lives has a pro-poor sample3, it is heartening to note that no major gaps in enrolment have been found across gender, caste, or urban/ rural location.
Figure 1. Children enrolled in school at age 12 in 2006 and 2013
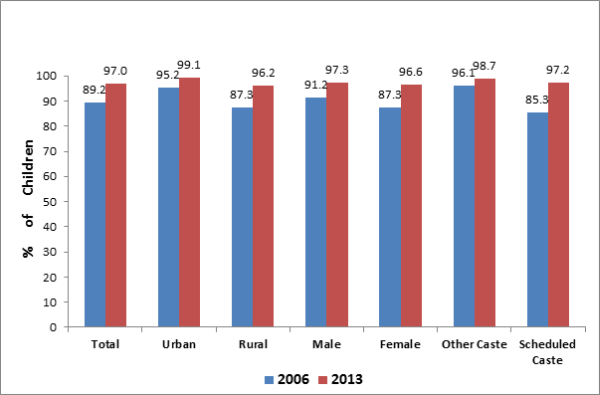
However, there are inequities in terms of the kind of schools children are enrolled in, with private school enrolment rising from 32% in 2006 to 41% in 20134. The highest proportion of Other Caste (OC)/ general category children (71%) and the richest tercile55(72%) were attending private schools in 2013, compared to 59% in 2006. This clearly highlights the segregation of the poorest children into public schools, while those who can afford to pay the fees, opt for private schooling. It is important to note that private schools are not a homogeneous group and average annual tuition fees ranged from Rs. 8,113 paid by better-off households in more expensive private schools to Rs. 1388 in less expensive schools patronised by poorer households, in 2013.
Declining learning levels
Young Lives collects cognitive achievement scores for children in each round. This survey has highlighted a decline in mathematics test scores6 amongst children aged 12 in 2013, as compared to children of the same age in 2006. Mathematics tests scores for the same questions administered to children in the two rounds revealed that while 67% of the children in 2006 answered the questions correctly; this number fell to 53% in 2013 – a decline of 14 percentage points (Figure 2). This decline is seen across government and private schools as well as all the wealth terciles. The most severe decline is noticed in government schools (20 percentage points) and surprisingly even the children in private schools and the wealthiest terciles show a decline of 12 percentage points each.
Figure 2. Maths scores of 12-year-olds in 2006 and 2013
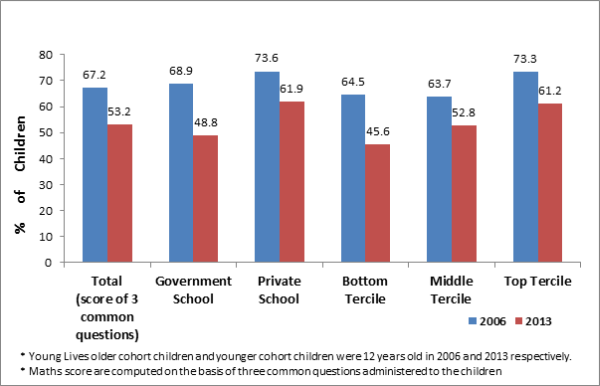 Source: Young Lives Round 2 (2006) and Round 4 (2013) Surveys.
This unfortunate trend of declining learning levels is also ratified by other national studies. For instance, Annual Survey of Educational Research (ASER 2013) found that while in 2010, about 70% of Class V children (10-11 year olds) were able to do simple two-digit subtraction, the figure decreased to 54% in 2012. The National Achievement Survey, Class V (National Council for Education Research and Training (NCERT) 2012), has also reported that children belonging to Scheduled Castes and Scheduled Tribes (SC/ ST) continue to perform poorly in subjects such as language, mathematics, and EVS (environmental studies).
What explains the decline in learning levels and what can be done?
This degeneration of learning levels can be attributed to a multitude of reasons, including the vast expansion of the number of elementary schools in the country, with no concurrent expansion in school management systems. The XV Joint Review Mission conducted by the Ministry of Human Resource Development (2012) highlighted that there were 25% vacancies in programme management personnel for elementary education at the state level, and this figure was 46% at the block level.
The focus of centrally-sponsored schemes, such as SSA, has largely been on improving school facilities and infrastructure, and teacher recruitment, with expenditure on infrastructure and teacher salaries accounting for 80% of the SSA budget (Accountability Initiative 2012). However, effective school monitoring and mentoring have remained sorely neglected.
A time-on-task study (Ministry of Human Resource Development, 2008) found that less than one-third (an average of 29%) of the teachers’ time in classroom was spent on student-centric activities, and students’ time spent on active learning gradually declined from 26.4% in Class II to 22% in Class VI. The challenge of teaching a heterogeneous classroom requires deep change in the nature of the curriculum design as well as teaching learning processes, which continue to remain largely ‘chalk and talk’. Language of instruction must be given apt attention and multilingual education should be adopted to ensure that specific groups of children, such as STs and migrant children are given instruction in their mother tongue in the first few years of schooling.
Furthermore, the ‘no detention’ policy adopted by India prohibits failing children in elementary grades. This has, in the absence of robust regulatory frameworks led in many cases to ‘no learning’. This does not mean that grade detention should be advocated, but the no-detention policy together with the lack of accountability of government schools for children’s learning outcomes implies that children can continue in school until Grade 9 and then be ‘pushed out’ when they are tested (Singh and Sarkar 2012).
As far back as 1989, the Working Group for the 8th five-year plan had recommended the introduction of a comprehensive evaluation system: students should have a well-defined goal of acquiring a mastery level7, particularly in subjects which serve as the basic tools of learning (the three Rs – Reading, Writing, and Arithmetic). This has unfortunately escaped the attention of policymakers, and 25 years later, the education system is still bereft of quality benchmarks for assessing learning levels of children. Ensuring that children enroll and stay in elementary education is dependent on, among other things, a stimulating school environment that is conducive to meaningful learning relevant to the child’s life. The Jomtien Declaration (1990) emphatically stated: “Whether or not expanded educational opportunities will translate into meaningful development — for an individual or for society — depends ultimately on whether people actually learn as a result of those opportunities, i.e. whether they incorporate useful knowledge, reasoning ability, skills and values’ (Article 4).
Achieving the ‘Education for All’ goal cannot rest on access to schooling and enrolment alone; it requires focusing on a meaningful and relevant curriculum, human resource management systems that ensures regularity and accountability, and availability of qualified and professionally trained teachers, that would enable enhanced student retention, attainment and achievement. It is time that the ‘Results Framework Document’ of the Ministry of Human Resource Development goes beyond access and infrastructure and incorporates learning outcomes as a critical element of the ‘quality’ of education; only then will the country go beyond measuring mere numbers to focusing on teaching-learning processes and improved learning outcomes for all children.
Notes:
- Gross Enrolment Ratio (GER) is defined as the ratio of students enrolled in school at a particular grade level to the total number of children that are of the corresponding school-enrolment age. It determines the number of students enrolled in school at different grade levels.
- A longitudinal research study is one in which data is collected for the same variable for two or more distinct periods.
- Young Lives is not a nationally representative sample and children from poor families have more-than-proportionate representation in the sample.
- The remaining students are enrolled in public schools.
- If all households in a sample are arranged in ascending order based on their wealth, the top tercile will contain the top one-third (wealthiest) households. The bottom tercile will contain the bottom one-third (poorest) households.
- This is measured by a language and mathematics test, along with Picture Peabody Vocabulary Test (PPVT).
- Mastery level” is a term coined by Bloom (1971), which implies that all children must be supported by an appropriately designed learning environment to master each learning unit before preceding to the next, based on specifically defined objectives.
Further Reading
- Accountability Initiative (2012), ‘PAISA Report: Do Schools Get Their Money’, Centre for Policy Research, New Delhi.
- ASER (2013), ‘Annual Survey of Education Report (Rural)’, Pratham Education Foundation, New Delhi.
- Bloom, BS (1971), ‘Mastery learning’, in JH Block (ed.), Mastery learning: Theory and practice (pp. 47–63), New York: Holt, Rinehart and Winston.
- DISE (2012–13), ‘Elementary Education in India: Flash Statistics’, National University of Educational Planning and Administration, New Delhi.
- Government of India (1998), ‘Steering Committee Report for Formulation of the Ninth Plan (1997-2002)’, Education Division, Planning Commission.
- Government of India (2000), ‘Sarva Shiksha Abhiyan: A Framework’, Department of School Education and Literacy, Ministry of Human Resource Development, New Delhi.
- Government of India (2009), ‘The Right to Free and Compulsory Education Act’, Gazette Extraordinary, No 35, Ministry of Law and Justice, New Delhi.
- Government of India (2012), ‘XV Joint Review Mission, Final Aide Memoire, Sarva Shiksha Abhiyan’, Ministry of Human Resource Development, New Delhi.
- Inter-Agency Commission (1990), ‘World Declaration on Education for All and Framework for Action to Meet Basic Learning Needs’, UNICEF, New York.
- National Council of Educational Research & Training (2012), ‘National Achievement Survey Class V’, Ministry of Human Resource Development, New Delhi.
- Singh, R and S Sarkar (2012), ‘Teaching Quality Counts: How Student Outcomes relate to Quality of Teaching In Private and Public Schools in India’, Young Lives Working Paper 91, University of Oxford.
- Further Reading
- Accountability Initiative (2012), ‘PAISA Report: Do Schools Get Their Money’, Centre for Policy Research, New Delhi.
- ASER (2013), ‘Annual Survey of Education Report (Rural)’, Pratham Education Foundation, New Delhi.
- Bloom, BS (1971), ‘Mastery learning’, in JH Block (ed.), Mastery learning: Theory and practice (pp. 47–63), New York: Holt, Rinehart and Winston.
- DISE (2012–13), ‘Elementary Education in India: Flash Statistics’, National University of Educational Planning and Administration, New Delhi.
- Government of India (1998), ‘Steering Committee Report for Formulation of the Ninth Plan (1997-2002)’, Education Division, Planning Commission.
- Government of India (2000), ‘Sarva Shiksha Abhiyan: A Framework’, Department of School Education and Literacy, Ministry of Human Resource Development, New Delhi.
- Government of India (2009), ‘The Right to Free and Compulsory Education Act’, Gazette Extraordinary, No 35, Ministry of Law and Justice, New Delhi.
- Government of India (2012), ‘XV Joint Review Mission, Final Aide Memoire, Sarva Shiksha Abhiyan’, Ministry of Human Resource Development, New Delhi.
- Inter-Agency Commission (1990), ‘World Declaration on Education for All and Framework for Action to Meet Basic Learning Needs’, UNICEF, New York.
- National Council of Educational Research & Training (2012), ‘National Achievement Survey Class V’, Ministry of Human Resource Development, New Delhi.
- Singh, R and S Sarkar (2012), ‘Teaching Quality Counts: How Student Outcomes relate to Quality of Teaching In Private and Public Schools in India’, Young Lives Working Paper 91, University of Oxford.

Comments will be held for moderation. Your contact information will not be made public.