

 15 May, 2017


There is an ongoing policy debate in India on whether grain entitlements under PDS should be converted into cash transfers. This column shows that in the face of high price variability, in-kind transfers such as the PDS can be superior to cash transfers as they could significantly reduce the strength of the relationship between prices and caloric intake, hence, shielding households from price risk.
Prices in most of the developing world are a lot more variable than in developed countries, and staples make up a much larger share of household budgets. For example, rice prices in India can easily vary between Rs. 7 to Rs. 13 per kilo (10th and 90th percentile of the variation of rice prices). In a recent IGC (International Growth Centre) project, we study the extent of this variability in India, the consequences in terms of likely welfare costs, and the role that government provision of goods can play to ameliorate price risk.
Is price risk bad?
Price risk is present whenever households do not know future prices of commodities. While it may seem obvious that price risk has negative impacts on households, the extent of exposure to such risk and its consequences has received little systematic attention in the literature. A comprehensive review of research on food security emphasises the importance of risk as an important component of food security but notes that "most of the literature nevertheless fails to address issues of risk and uncertainty" (Barrett 2002). It is important to note that price fluctuations could – in theory – actually be beneficial for households if they can purchase a commodity when its price is low and substitute toward other commodities when its price is high (Waugh 1944, Turnovsky et al. 1980). Meanwhile, price increases could help rather than hurt households who are net producers and not net consumers of food. Gaining a more nuanced understanding of price risk (example, how correlated prices are, the degree to which substitution is possible, and net spending on food commodities for poor households) is therefore critical for understanding how it affects household welfare.
Building on previous theory, we show that price risk tends to be worse for welfare when the prices of similar goods are highly correlated, when households are more risk averse, and when the risky goods make up a larger share of the household's budget, and measure the extent of these conditions in the context of India. The second two conditions are more true in India than in developed countries; since food makes up 31% of the average households budget (versus 6.6% in the US1), a 10% change in food prices has serious budget ramifications for poor families.
Basic facts about price risk in India
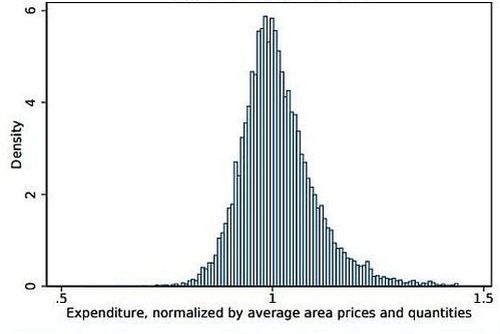
Figure 1 shows the variability for the price of rice, the single most widely consumed item in India. This shows only variation within districts over time; if anything this understates true price variability, as it removes geographic variation as well as country-wide shocks. Prices range from Rs. 8 (at the 10th percentile of the variation of rice prices) to Rs. 11 (at the 90th percentile). Given the large share of their budget that poor households spend on rice, this translates into a 6% change in the budget share spent on rice for households in the bottom quartile of the expenditure distribution. The prices of other goods tend to be highly correlated with the rice price, which makes price risk worse when we consider changes in other prices at the same time. We estimate that for an average household, the cost of the full bundle of goods the household consumes increases 24% going from the 10th to 90th percentile of the price risk distribution. Figure 2 plots the whole distribution of the cost of the average household's bundle of goods.
Figure 1. Variability in market price of rice
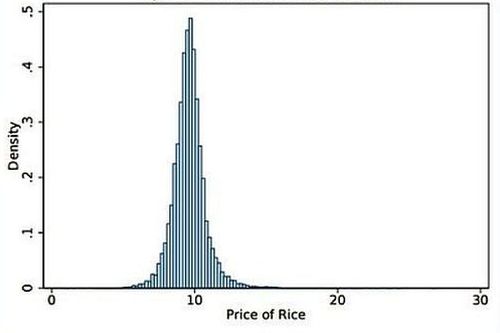
Figure 2. Distribution of the cost of the average household's bundle of goods
Price risk and the Public Distribution System
India spends about 1% of GDP (gross domestic product) on the PDS (public distribution system), a network of stores that sell necessities (rice, wheat, sugar, and kerosene) at heavily subsidised prices. This flagship social welfare programme has been relatively understudied in comparison to the more famous MNREGA (Mahatma Gandhi National Rural Employment Guarantee Act)2 but existing evidence indicates that leakage levels in the PDS are high (Khera 2011).
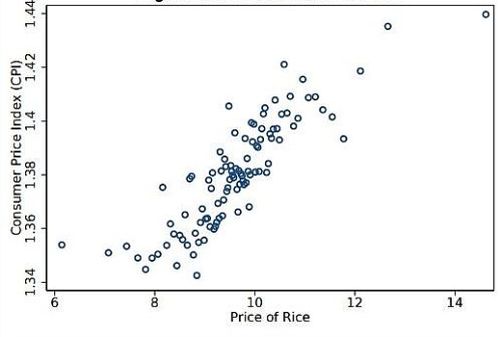
As a result, many economists have called for the PDS to be converted into a cash transfer programme. However, we show theoretically that in-kind transfers (the option to buy an allocation of rice at a fixed price) can be superior when households face price risk. Intuitively, this is because a cash transfer is always worth the same amount, but an in-kind transfer is worth more as prices increase. The more highly correlated the price of the transferred good is with overall prices, the better the system works, because it means that the transfer is larger when prices are high. Figure 3 shows that prices are highly correlated; the prices faced by the average household increase by almost 2% for each 10% increase in the rice price. In concrete terms, when overall prices increase, the increase in the value of the rice transfer makes up 10.8% of the increased cost for PDS-consuming households.
Figure 3. Price of rice vs. Consumer Price Index
How does the PDS affect households?
We also explore the extent to which the PDS might help households mitigate the costs of price risk. Many households in India are poor enough that they have to cut back on the calories they consume when food prices are high, so we test whether the implementation of the PDS makes households less susceptible to price-induced calorie reductions. We begin by estimating household caloric intake from National Sample Survey (NSS) consumption data over the period from 2003-2012, and then combining this with information on prices (measured using unit values from the NSS).
Overall, certain types of households are more vulnerable to price risk. Table 1 estimates the effect of higher prices on caloric intake; when prices increase 10%, there is a small 2.7% reduction in caloric intake for well-off land-owning households (column 2). For more vulnerable, landless households, calories decrease by 6.2% (column 1). Interestingly, the difference in price responsiveness between landless and land-owning households is much more dramatic than the difference between below- and above-median expenditure households (column 3 vs. column 4), who respond similarly to variations in prices. As expected, owning land (and being able to grow food when prices are high) substantially lowers responsiveness to price risk in a way that even being above-median expenditure does not.
Table 1. Percent change in log calories for percent change in prices
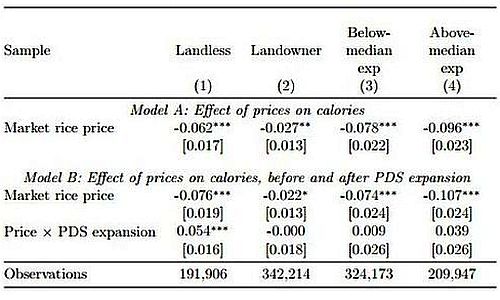
In Model B of Table 1, we estimate how the expansion of the PDS is related to the caloric response to price variability. Given potential endogeneity, these results must be viewed simply as correlations at this time, and are thus merely suggestive. We collected information about recent PDS expansions from a number of sources, including newspapers and government records. We selected the major increases in eligibility and reductions in price and estimated how caloric responsiveness to price changed after the PDS expansion. Emblematic is Kerala's 2006 reduction in the BPL (below poverty line) price of rice from Rs. 6.2/kg to Rs. 3/kg, which increased the value of Kerala's BPL portion of the PDS by 40.6%. Panel B shows that for land-owning households, a 10% increase in rice prices reduced calories by the same amount (2.2%) before and after the expansion. For the landless households - one of the groups that the PDS is trying to help - the difference was dramatic. Before the expansion, a 10% increase in prices reduced calories by 7.6%. After the expansion, the same price increase reduced calories by only 2.2%, the exact same amount as the land-owning households. For coarser subgroups, like below- and above-median expenditure households, the reform has no effect. This is likely because many of the households are landowners, and thus already insulated from price risk to some degree.
Lessons going forward
One overlooked advantage of the PDS is how it helps shelter households from price risk — when prices are high, the value of the in-kind transfer of rice is also higher. We show that there is still a considerable amount of price risk in India, and that increases in rice prices decrease household caloric intake, implying welfare costs for the family. For landless households, who are least insulated from price shocks, we show that expansions to the PDS are associted with a reduced strength of the relationship between prices and caloric intake, perhaps indicating that the PDS helps shield households from price risk. While previously policymakers have recognised this fact (Drèze 2011), in this project we provide both theoretical and tentative empirical support for the contention, thus helping inform debates over the conversion of grain entitlements under the PDS to cash transfers.
Notes:
- Source: Economic Research Service (ERS), USDA (United States Department of Agriculture) calculations based on annual household expenditure data from Euromonitor International.
- MNREGA guarantees 100 days of employment in a financial year to every rural household whose adult members are willing to do unskilled manual work at the minimum wage.
Further Reading
- Barrett, C (2002), 'Food security and food assistance programs', in B Gardner and G Rausser (eds.), Handbook of Agricultural Economics, Vol. 2(2), Chapter 40, pp. 2103-2190. Available here.
- Cole, Shawn, Xavier Gine, Jeremy Tobacman, Petia Topalova, Robert Townsend and James Vickery (2013), "Barriers to Household Risk Management: Evidence from India", American Economic Journal: Applied Economics, 5(1):104-135. Available at: https://openknowledge.worldbank.org/bitstream/handle/10986/17926/AEJApp_2011_0326_Published.pdf;sequence=1
- Drèze, J (2011), 'The Cash Mantra', The Indian Express, 11 May 2011.
- Jha, S, A Kotwal and B Ramaswami (2013), 'Safety Nets and Food Programs in Asia: A Comparative Perspective', Asian Development Bank (ADB) Economics Working Paper Series No. 371.
- Khera, Reetika (2011), "Trends in Diversion of Grain from the Public Distribution System", Economic and Political Weekly, Vol. XLVI (21), pp. 106-114, 21 May.
- Nair, GK (2006), 'Kerala: Rice at Rs. 3 a kg from next month', The Hindu Business Line, 26 January 2006.
- Olken, Benjamin (2006), "Corruption and the Costs of Redistribution", Journal of Public Economics, 90(4-5):853-870. Available here.
- Programme Evaluation Organisation (2005), 'Performance Evaluation of Targeted Public Distribution System (TPDS)', Technical Report, Planning Commission, Government of India, March 2005.
- Nagavarapu, S and S Sekhri (2014), 'Informal Monitoring and Enforcement Mechanisms in Public Service Delivery: Evidence from the Public Distribution System in India', Working paper, Brown University.
- Rosenzweig, Mark and Chris Udry (2014), "Rainfall Forecasts, Weather and Wages over the Agricultural Production Cycle", American Economic Review Papers and Proceedings, Vol. 104(5). Available here.
- Turnovsky, Stephen J, Haim Shalit and Andrew Schmitz (1980), "Consumer's Surplus, Price Instability, and Consumer Welfare", Econometrica, 48(1):135-152.
- Waugh, Frederick V (1944), "Does the Consumer Benefit from Price Instability", Quarterly Journal of Economics, 58:602-614.
- United States Department of Agriculture (2016), 'Food Expenditures', USDA Economic Research Service, 17 August 2016.
- Government of Kerala (2006), 'Price Bulletin November 2006', November 2006.
- Government of Kerala (2009), 'Statistics for Planning 2009', Department of Economics and Statistics.

Comments will be held for moderation. Your contact information will not be made public.