

 04 March, 2013


Two-thirds of the poor in India and other South Asian countries live in the lagging regions. This column examines whether there are poverty traps that make it difficult to achieve shared prosperity, and if the current fiscal decentralisation arrangements in South Asia are working to the benefit of the poor regions. It highlights the need for shifting the locus of policy from the national to sub-national level, and from leading to lagging regions.
South Asia is a land of sharp contrasts. It has attracted global attention for rapid economic growth over the past two decades. India, the largest country in the region, is seen as an emerging economic powerhouse. Other countries in South Asia are also well advanced in the transition from low income to middle income status. However, South Asia is also home to the largest concentration of people living in poverty. Nearly 570 million people lived on less than $1.25 a day in South Asia, compared to 385 million in Sub-Saharan Africa in 2008. India had the largest concentration of poor people with nearly 400 million people living on less than $1.25 a day in 2008.
The global geography of poverty has changed over the last two decades. More than 70% of the world´s poor now live not in low income but in middle-income countries. This raises a number of big questions. Is economic growth sufficient to pull everybody out of poverty? Can middle income countries or parts thereof suffer from poverty traps? What then can one do to promote shared prosperity?
Where do the poor live?
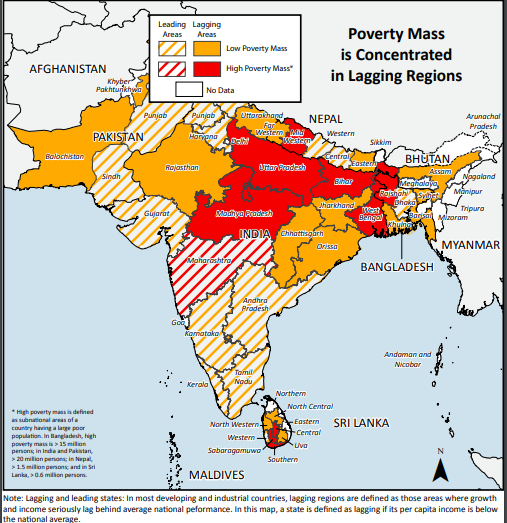
Figure 1 shows that about two-thirds of the poor people in India and other South Asian countries live in the lagging regions1. While there is poverty reduction in both leading2 and lagging regions, lagging regions have slower growth than leading ones and do not display greater poverty reduction in proportional terms. Hence, policies aimed at accelerating growth rate and poverty reduction and improving living standards of lagging regions are crucial to achieving the goal of shared prosperity.
Figure 1: Poverty Mass in Lagging and Leading Regions
Poverty convergence across countries and regions
Poverty itself can become a constraint to growth through channels such as lower savings or investment rates, dismal education or health outcomes, poor access to credit or property rights, incomplete insurance markets, which increase the risks of crop failures, floods, and droughts, high conflict rates, and poor infrastructure. Such “poverty traps” limit the choices of individuals, households and firms, to fully exploit their economic potential. These traps can start a vicious cycle, with no income growth feeding into greater poverty, which in turn reduces growth even further.
Do countries suffer from poverty traps? Not really. Figure 2 shows that countries with initially higher levels of poverty experienced greater absolute reductions in the poverty headcount ratio3 – the proportion of the population living below the international poverty line on less than $1.25 a day.
Figure 2. Convergence in Poverty Head Count Ratios (absolute level)4
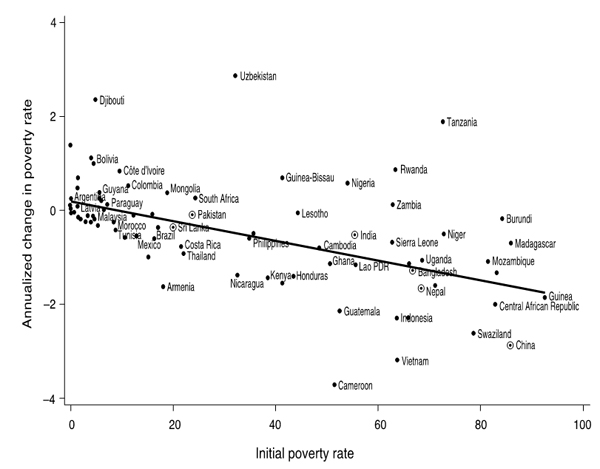
Table 1. Poverty Convergence across Countries5
When one considers percentage changes in poverty, there is no longer any significant degree of convergence in poverty across countries (Table 1, column III). In other words, although poorer countries do reduce absolute numbers of people living in poverty, they do not reduce them proportionally faster than richer countries6.
Other measures of poverty are the Poverty Gap (PG) index and Squared Poverty Gap (SPG) index7 – where PG is the average distance of the individual from the poverty line. Calculations using these indices show strong evidence of convergence across countries, with poorer countries showing the largest reductions — both in absolute and proportional terms. This result is encouraging. Even if poorer countries are not able to achieve huge reductions in the headcount ratio, they do appear to show the largest reductions in the depth and severity of poverty (Table 1, columns IV-VII).
Poverty convergence in South Asia
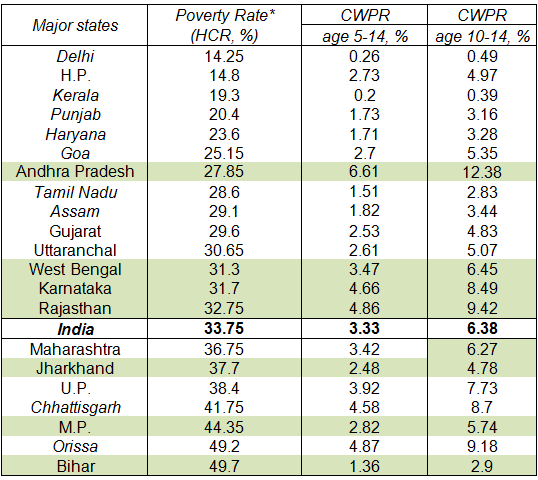
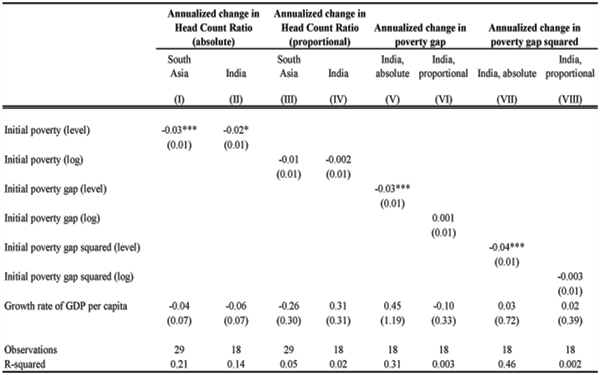
When one examines poverty convergence/ divergence at the sub-national level, the trends within India and across South Asian regions are similar to the earlier results for the global sample. At the sub-national level, states with higher levels of poverty experienced greater absolute reductions in the headcount ratio (see Table 2, columns I and II).
As in the global sample, however, they did not experience greater proportional reductions in the headcount ratio (Table 2, columns III and IV), suggesting that more needs to be done in the lagging regions to align them with the leading ones. When one looks at measures of poverty depth and severity, once again one finds that the initially worse-off regions showed greater improvements in these measures than the initially better-off regions (see Table 2, columns V and VII).
Unlike the global sample, the lagging regions in India do not show proportionally better performance in reducing the PG or the SPG measures (Table 2, columns VI and VIII). This is a worrisome sign that poverty reduction in the lagging regions of India and South Asia needs to be accelerated, especially with regard to extreme poverty.
Table 2. Poverty Convergence in India and South Asia8
Overall, these results provide for cautious optimism on shared prosperity and progress in the lagging regions. There is little evidence of persistent poverty traps at a regional level in South Asia, or even among developing countries as a whole. However, there is also no room for complacency. One does not see lagging regions catching up with the leading regions in terms of per capita income or in health indicators or even in proportionate terms for poverty.
Fiscal decentralisation arrangements in South Asia
One strategy to accelerate growth and poverty reduction in lagging regions is promoting pro poor fiscal transfers and devolving power to local governments who may then implement policies more suited to local conditions. Such transfers to poor regions can help alleviate resource constraints, and enable them to invest more in physical and human capital or other growth-inducing investments.
In most countries, fiscal transfer, ensure equity across sub-national regions. This equity is important for economic and political reasons. Poorer regions have a lower base of economic activity to tax, and typically these regions spend considerably less on social services, including education and health care, that are important inputs into future growth potential. Moreover, growing regional disparities can cause political tensions.
We now examine whether current fiscal decentralisation arrangements in South Asia are working to the benefit of the poor regions.
A typical cross-country measure of fiscal decentralisation is the share of total revenues or expenditures that are collected by sub-national governments. India is quite decentralised compared with the world average: sub-national (state and local) governments collect 34% of all government revenues and are in charge of 52% of total government expenditures (see Table 3).
Like many large federal nations, states in India receive transfers from the central government through a variety of mechanisms. The first consists of tax shares and grants decided by a non-political Finance Commission, which places weights on factors such as the state’s area (10%), population (25%), per capita income (50%), and other factors including the state’s own revenues as a fraction of state domestic product (7.5%). The second source of funding is from the Planning Commission, which is in charge of formulating national five-year plans and makes grants and loans for implementing state development plans9. Third, various central government ministries give grants to their counterparts in the states for specified projects either wholly funded by the center (central sector projects) or requiring the states to share a proportion of the cost (centrally sponsored schemes). These grants are wholly discretionary and often are not coordinated with Planning Commission transfers, although they are meant to serve similar objectives.
Table 3. Extent of fiscal decentralisation in South Asia and the world
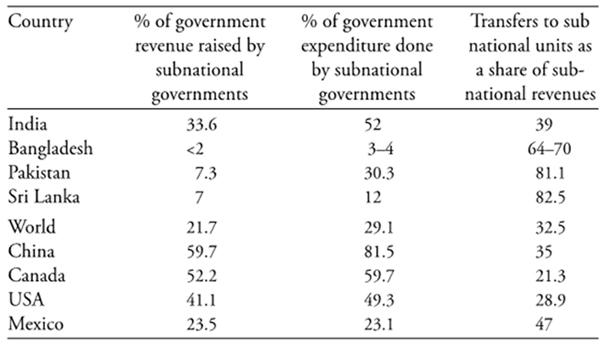
Sources: India, Canada, Mexico, and world figures are from Government Finance Statistics, GFS (1999); US and Mexico figures are from GFS; Sri Lanka figures from World Bank (2006) for 2004; World average is based on the 41 countries in the GFS database.
In addition to these explicit transfers from the central government to the states, a number of ‘hidden’ or ‘implicit’ transfers arise from the large subsidies given by the central government for food and fertiliser10. Additionally, subsidised borrowing resources for the states are provided by either the central government or government-owned financial institutions.
While the largest component of fiscal transfers in India comes from the tax-sharing schemes, discretionary transfers and the subsidies put together are almost as large as the tax shares.
Does the system of fiscal decentralisation in India transfer more revenue to poorer regions? When one looks at the different components of fiscal transfers in India, it is clear that horizontal equity is being achieved only through the tax-sharing schemes of the Finance Commission (see figure 3a). The state plan grants administered by the Planning Commission do not seem to be directed toward the poorer states (see figure 3b), whereas the discretionary schemes show higher per capita expenditures in the richer states (see figure 3c).
Food subsidies are not significantly higher in poorer regions. Looking at the second-largest source of subsidies, fertiliser, it is seen that richer regions benefit much more than poorer regions, because the richer regions tend to consume more fertiliser (see figure 3f). If subsidies are meant to enhance welfare and investment levels in lagging regions, they need to be targeted to those regions, rather than to a specific good or service that may be consumed more heavily in richer states.
Figure 3: Different types of fiscal transfers to lagging regions in India, 2005–2006
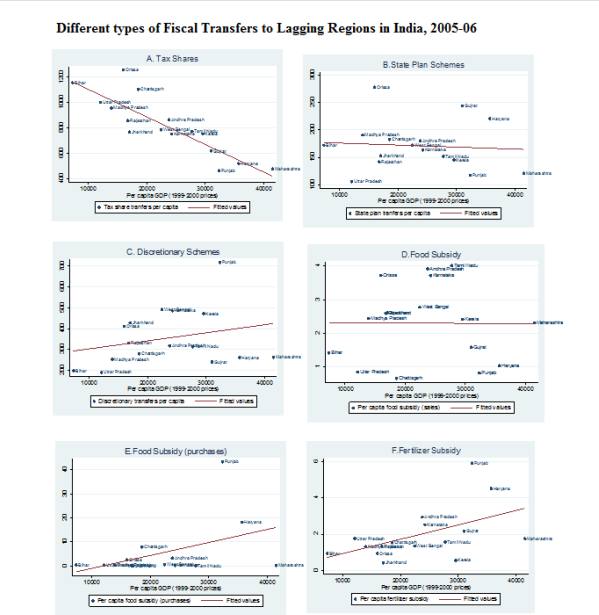
Sources: Indian Public Finance Statistics, 2007–2008, Ministry of Finance. Food Corporation of India for Food Subsidy allocation.
In Pakistan and Sri Lanka, one finds that poorer regions are obtaining a higher level of per capita fiscal transfers. In Sri Lanka, the highest levels of per capita funding have been allocated to the North-East Province, the center of a long-running Tamil separatist movement. In this sense, fiscal transfers appear to address a political problem as well. In Bangladesh, however, no explicit mandates direct resource transfers toward poorer regions.
Conclusion
We find that the current patterns of economic growth are not sufficient to enable the lagging regions of South Asia to catch up with the leading regions in terms of proportional poverty reduction. Given that South Asia has the world’s largest number of people living below the poverty line, and that the majority of the poor are in lagging regions, policies must be explicitly targeted towards achieving greater growth and poverty reduction in these regions.
One particular policy measure to achieve shared prosperity is pro-poor fiscal transfers. The performance of South Asian countries in achieving horizontal equity through fiscal transfers is mixed. For the most part, the systems of interstate fiscal transfers in South Asian countries do transfer a greater amount of resources to poorer regions, suggesting that they are working to achieve greater equity. However, this outcome usually occurs when interstate fiscal transfers are transparent and have explicit rules, and this is not always the case. Further, simply directing financial resources to lagging regions may not be sufficient and may need to be complemented with increases in capacity, accountability, and participation at the local level, so that poor regions can make full use of these resources.
We should note that fiscal decentralisation and other resource transfer policies can be complementary to policies which directly aim to accelerate the growth rate in lagging regions. This can be done by improving the business environment for the private sector, supporting market integration, improving connectivity, and ensuring macroeconomic stability. The government can also intervene directly in sectors or locations in which the private sector is reluctant to invest.
Policy makers need to boost shared prosperity and take another look at the MDG paradigm. A new lens is needed – one that shifts the locus of policy from national to sub-national level, and from leading to lagging regions, where poverty, gender disparity and human misery is concentrated.
The questions discussed in this column are examined in further detail, using both national and sub-national lens, and in a global setting, in a World Bank report on The Poor Half Billion in South Asia.
Notes:
- States with per capita income below the national average
- States with per capita income above the national average
- There are two main concerns with using reductions in headcount ratio. First, countries with low levels of poverty cannot display high values of poverty reduction.
- Second, reducing poverty from a high level might be easier than reducing poverty further from an already low level. Using a percentage change in poverty (or equivalently, a change in log poverty) gives a greater magnitude to poverty reductions starting from a low base, and also avoids the ‘floor value’ problem.
- Poverty rate is for $1.25 a day poverty line. Time period for change in poverty is 1977-2007. Number of countries is 91.
- Robust standard errors are reported in parenthesis. *** represents significance at 1%, ** represents significance at 5%, * represents significance at 10%. Poverty rate is defined as % of population living in households with consumption or income per person below the international $1.25 poverty line. Annualised poverty change is for time period 1977-2007. Poverty gap is defined as the mean distance below the poverty line as a proportion of the poverty line. Squared poverty gap is defined as mean of the squared distances below the poverty line as a proportion of the poverty line. Source: Povcalnet, World Bank. 2009 and World Development Indicators, World Bank 2009.
- This fact has also been documented in Ravallion (2012), who ascribes the lack of convergence to two reasons. The first is that initially poor countries do not grow as fast as not-so-poor countries, and the second is that, for a given rate of growth, poverty reduction in proportional terms appears to be slower in poorer countries.
- This is particularly important in measuring extreme poverty, which may not be reflected fully in a simple comparison of headcount ratios.
- Robust standard errors are reported in parenthesis. *** represents significance at 1%, ** represents significance at 5%, * represents significance at 10%. South Asia includes states in India (1994-2005), Pakistan (1999-2005) and Sri Lanka (1996-2002). Orissa is deleted from the sample for India region. South Asia: Orrisa, Tripura & Northern have been removed. Source: World Bank staff calculations using the National Sample Survey Organisation (NSSO) using the 55th and 61st round. The Planning Commission takes into account the state population and the gap between state per capita income and national average, among other factors, when deciding the state-level allocations.
- In 2007–2008, the central government had budgeted about 1.34% of overall GDP to be paid out in subsidies, the bulk of which paid for subsidised food sales through the Food Corporation of India (FCI), and for fertilisers
Further Reading
- Ghani, Ejaz, ed (2010), The Poor Half Billion in South Asia—What is holding back lagging regions?, Oxford University Press.
- Kraay, Aart (2006), “When is Growth Pro-Poor? Evidence from a Panel of Countries” Journal of Development Economics 80: 198-227.
- Seabright, Paul (1996), “Accountability and Decentralization in Government: An Incomplete Contracts Model”, European Economic Review, 40(1):61-89.
- Lopez, Humberto and Luis Serven (2009), “Too Poor to Grow”, World Bank Policy Research Working Paper 5012.
- Ravallion, Martin (2012), “Why Don’t We See Poverty Convergence?”, American Economic Review, 102(1): 504-523.

Comments will be held for moderation. Your contact information will not be made public.