

 14 June, 2013


The late Professor Raj Krishna´s term ‘Hindu growth rate’ was an aptly pejorative description of India´s economic performance in the post-independence period. But how has India performed in the good times, when the country´s growth turned around? This column compares India´s boom years with East Asia´s.
The popular impression is that India has done exceedingly well in terms of the economy’s growth rates, second only to China in recent years. The reality however, is sobering.
The assessment that follows has four features. First, the benchmark is seven Asian countries - China, Indonesia, Korea, Malaysia, Singapore, Taiwan and Thailand. Second, the comparison is not in chronological time but in ‘take-off time’. That is, India´s growth performance in the good years is compared with the growth of the other countries during their respective high-growth episodes.
Third, the assessment is based on two metrics. The simple one compares growth rates of per capita Gross Domestic Product (GDP) (measured in purchasing power parity terms) between India and the other countries. Economic growth theory, however, offers perhaps a more appropriate – ‘convergence-adjusted’ - metric. Economic convergence simply means that poor countries should grow faster than rich countries because poorer countries have cheap labour and low levels of capital, which together offer greater investment and hence growth opportunities. So, if two countries A and B grow at the same rate, but A started off richer than B, then it is A´s performance that is more impressive.
Finally, this assessment is undertaken for two periods of Indian performance. As emphasised by the work of Brad de Long (2003), Roberto Zagha and John Williamson (2002), and Dani Rodrik and myself (2005), India´s growth turnaround occurred around 1980 and preceded the policy turnaround by about a decade. But India´s growth trajectory steepened around 2002, yielding nearly 10 years of spectacular performance. It is natural, then, to assess both the (33) good years after 1979 and the (10) go-go years after 2002 with other Asian countries.
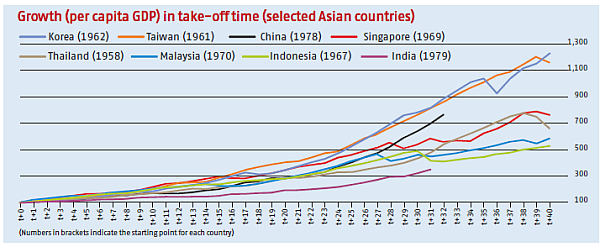
Figure 1. Growth per capita GDP in take-off time (selected Asian countries)
The 33 good years after 1979
Table 1a illustrates the comparison for the post-1979 period. Column 1 provides the take-off date for the other Asian countries. These dates are obtained from an influential paper by Hausmann, Pritchett and Rodrik (2003). Column 2 displays the per capita GDP growth rate for all these countries over the 33 years following their respective take-offs. Since Korea´s take-off occurred in 1962, the growth reported in this column is for the period 1962-1985, and so on for the other countries. Column 3 displays how rich each country was relative to India at the point where its growth took-off. So, taking Korea as an example, in 1962, the average level of its per capita GDP was 2.6 times that of India in 1979.
Table 1a. India’s underperformance relative to Asia in take-off time, post-1979
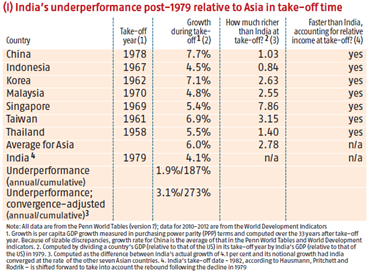
A few striking features stand out from Table Ia. In the post-1979 period, India grew slower than all seven Asian countries. Evidently, even Indian dynamism under-whelms its Asian counterpart (Table 1a, column 2; Figure 1). More strikingly, India grew slower than every country despite being poorer to start with (Table 1a, column 4). Thus, on a convergence-adjusted basis, its performance was worse than the simple numbers suggest. For example, Korea and Taiwan grew three percentage points faster than India on average despite being 2.5-3 times as rich at the take-off point. In recent years, the Chinese growth story has attracted all the attention. But the Korean, Taiwanese, and even Singapore growth episodes seem more impressive, because they posted comparable growth rates to China´s despite being much richer.
What about magnitudes? On a simple comparison, India underperformed Asia by 1.8% a year, which cumulates over 32 years to a whopping 185%. Translated into levels, India´s per capita GDP today should be $11,000 instead of $4,000. On a convergence-adjusted basis, India´s underperformance was even worse. We can compute what India´s growth rate should have been had it behaved like the rest of Asia in terms of catching up, taking account of the starting point. On this metric, India should have grown by 7.2% per year rather than the 4.1% it actually posted. This under-performance of 275% implies that India´s GDP should be closer to $15,000 rather than $4,000.
The go-go years after 2002
Table 1b provides answers. Of course, India´s performance improved considerably. The average growth rate climbed from 4.1% post-1979 to 6.2% post-2002. But, as column 2 of Table 1b shows, India still grew slower during the period 2002-2012 than every other Asian country (except Thailand) did during its first 10 years of rapid growth. On a convergence-adjusted basis, India grew slower than five out of the seven countries.
Table 1b. India’s underperformance relative to Asia in take-off time, post-2002
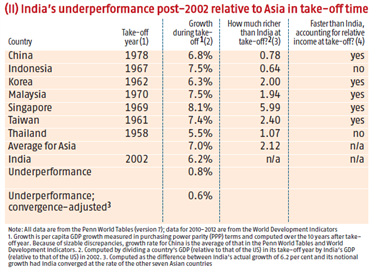
What about magnitudes? The simple comparison suggests that India underperformed by close to 1% a year. On a convergence-adjusted basis, India underperformed by about 0.6% per year. These numbers are important in providing perspective to the recent Indian growth experience. Over the longer (post-1979) period, Indian growth was utterly unremarkable compared to Asian peers. But even the India Shining years seem less glossy. In real time, the impression was one of India outperforming all countries except China. Properly measured, India did well but not as well as the Asian tigers during their comparable growth spurts.
Is the Hindu growth rate dead?
Why India has underperformed, and how this can be reversed, will continue to be the staple of debate. The numbers presented here would invite the irreverently brilliant Professor Raj Krishna to pronounce from somewhere high up: "The Hindu growth rate is dead. Long live the Hindu growth rate."
A version of this column has appeared in Business Standard.
Further Reading
- De Long, B (2003), ´India Since Independence: An Analytic Growth Narrative´, in D. Rodrik (ed.) In Search of Prosperity: Analytic Narratives on Economic Growth, Princeton University Press, Princeton, New Jersey.
- Hausmann, Ricardo, Prichett, Lant and Dani Rodrik (2005), “Growth Accelerations”,Journal of Economic Growth 10, 303–29.
- Rodrik, Dani and Arvind Subramanian (2005), ´From ‘Hindu growth’ to productivity surge: the mystery of the Indian growth transition´, IMF Staff Papers Vol. 52, No. 2. pp. 193-228.
- Williamson, John and Roberto Zagha (2002), ´From Slow Growth to Slow Reform´, Institute for International Economics. Washington, DC. July 2002.
Comments will be held for moderation. Your contact information will not be made public.