

 15 June, 2016


The driving restrictions policy that Delhi experimented with in January was implemented for a second time in April for a fortnight. This column finds that the policy lowered traffic congestion; the impact was notable in size and consistent over the two rounds. However, drivers managed to partly circumvent the policy legally, and the policy caused some disruption to economic activity.
The first round of the odd-even policy in Delhi was a wild success reducing traffic congestion, while the second round, a major flop.
That, at least, is the emerging consensus about Delhi’s policy experiment to reduce traffic flows and pollution. Based partly on anecdotal impressions and partly backed by studies, these conclusions deserve close and ample scrutiny. In this column, I rely on recent evidence to challenge the current interpretation of the policy impact on traffic congestion.
Since January, I have led a study organised by J-PAL South Asia and supported by the International Growth Centre (IGC). (The full results of the study are available in this working paper, Kreindler 2016; the results after the first round were discussed on I4I here.) The evidence points to a balanced assessment of the policy’s impact on traffic and driver behaviour. Odd-even led to a reasonable reduction in traffic congestion - this was remarkably stable across the two rounds. Compliance with the policy was high, yet many drivers bypassed it legally by using other private vehicles. While noteworthy, these behavioural responses did not completely offset the policy impact.
This entire experience points to several clear recommendations going forward. Before discussing them, here is what the data say about odd-even.
How did odd-even affect traffic congestion?
We collected extensive and detailed data on traffic congestion on 150 routes across Delhi from Google Maps, comprising more than a million data points. This data is based on real-time and historic anonymous information from smartphone users travelling along these routes.
The results point to a precise decrease of 9-10% in average travel time excess delay (see Figure 1). (Excess delay is the time it takes to travel on a certain route, above and beyond what it would take in the absence of congestion.) On a hypothetical 40-minute commuting trip, this translates to an average reduction of approximately two minutes due to odd-even.
Figure 1. Travel time excess delay on weekday during and after odd-even
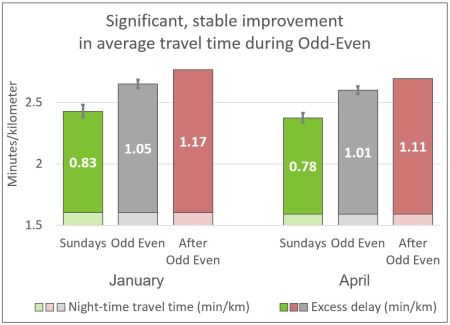 Notes: This figure reports average travel times across 150 routes in Delhi, collected every 20 minutes from Google Maps, between 8 am and 8 pm. Columns 1 and 4 are averages on Sundays after odd-even; columns 2 and 4 are from Monday-Saturday during odd-even; columns 3 and 6 are from Monday-Saturday during the two weeks after odd-even.
It’s easy to dismiss this as negligible, yet that would be a mistake. To see why this is an important impact, let’s put these numbers in context.
Commuters tend to perceive small objective differences in travel time as a big deal. Indeed, the drivers we surveyed reported significantly less inconvenience due to road traffic congestion during odd-even, compared to the weeks immediately before and after (see Figure 2). The roughly 50% decrease is very large, and holds robustly across driver groups, including among drivers who oppose the odd-even policy. This result is not wishful thinking from supporters, but real gains perceived widely by drivers in Delhi.
Figure 2. Perceived traffic congestion before, during and after odd-even
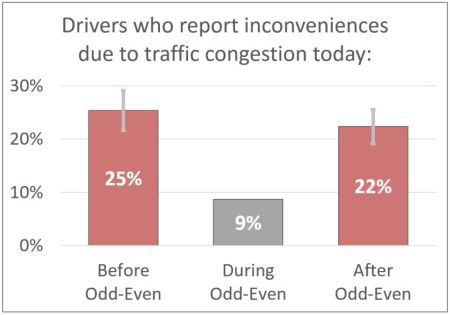 Notes: This graph shows the fraction of drivers who report an inconvenience related to traffic congestion during the odd-even policy (middle column, grey), as well as in the weeks immediately before and after the (April) policy (first and third columns, red).
We can also look at congestion levels on a typical Sunday. Any policy that gets traffic close to what it is on Sundays would naturally be considered a big achievement. Excess delay is roughly 33% lower on a typical Sunday compared to weekdays, which means that odd-even was about a third as effective as typical Sunday traffic.
The successful London Congestion Charge is another point of reference. Implemented since 2003, that policy required four-wheelers to pay £5 per day to enter the restricted area. That policy led to a 30% reduction in excess delay. The point is not to directly compare Delhi and London. However, this provides guidance for what is a reasonable goal for an effective traffic reduction policy.
The impact looks remarkably stable over time. There was an average 10% reduction in excess delay in January, and 9% in April. The difference is not statistically significant, so we have no evidence that odd-even was less effective in April compared to January. Of course, it remains an open question whether these gains would endure if the policy was implemented for longer durations.
How do these results compare with previous accounts and studies? It does not seem likely that odd-even had a huge impact on speed in January across Delhi, nor was all of Delhi chocked by huge traffic snarls in April. These isolated events likely garnered outsized attention. Of course, our results are an average over all 150 routes across Delhi, and in fact some routes saw larger improvements, while others saw smaller improvements. However, nearly all routes saw a net improvement compared to the period without odd-even.
How did drivers react?
The odd-even policy prompts two main concerns. First, drivers may respond in such a way to completely offset the policy, either by disobeying the policy directly or by finding legal alternatives that are just as bad for traffic congestion. Secondly, some drivers may be significantly inconvenienced by the policy.
To study driver behaviour in detail, we did daily phone surveys with a sample of drivers to compare how behaviour and satisfaction changed on restricted and unrestricted days during the odd-even policy, as well as immediately before and after the policy.
Our sample is 960 male drivers who own and regularly use their petrol or diesel four-wheeler in Delhi. They were recruited in petrol pumps across Delhi before the policy, and we reached some of them in both January and April, so we can compare the two rounds. We conducted 4,189 phone interviews asking about their daily experiences.
We found that compliance was generally high - and higher in April. On a typical unrestricted day – odd days for odd license plate holders, and even days for even plate holders – less than half of drivers actually use their usual four-wheeler. That number drops to 8-12% on a typical restricted day. Hence, more than half of the drivers did not drive anyway, and one in every three drivers was persuaded to give up using their usual four-wheeler, on days when that vehicle was restricted. This number was precisely 34% in January, and 33% in April.
The key question is what these drivers do instead of using their four-wheelers. Do they mostly switch to other cars as critics feared - or to public transport as the policy intended? In fact, over a half of those who changed their behaviour – or 18.5 percentage points of all drivers – switch to other private modes of transport, such as other cars, two-wheelers, taxis and autos. We can expect these responses to reduce the effectiveness of the policy.
Between a quarter and a third switches to public transport, in decreasing order to the Delhi metro, carpool and buses. Specifically, 5-6% of all drivers switched to the metro, 2-3% to carpool, and 1-2% to buses. Hence the policy was at least party effective, which is consistent with the observed impact on traffic congestions.
Figure 3. Alternatives chosen instead of restricted four-wheelers
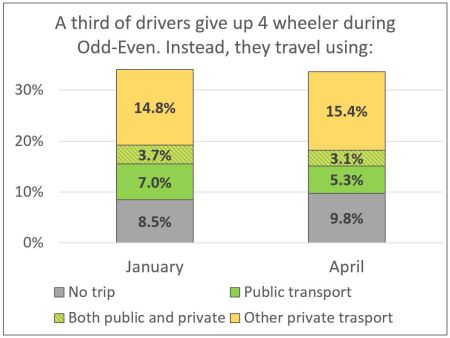 Notes: Other private transport includes other (unrestricted) four-wheeler, two-wheeler, taxi and auto rickshaw. Public transport includes metro, bus and carpool (as passenger). No trip means the respondent did not make any trips on the day he was interviewed.
How much did odd-even inconvenience drivers?
Drivers report being less satisfied with their commutes on restricted days, yet this effect is small compared to the improvement during odd-even. Overall, there is no evidence of major inconveniences to drivers. This was not obvious before the policy was implemented, so it is substantially good news about drivers’ ability to adapt to driving restrictions.
On the other hand, a quarter of the drivers who changed their behaviour cancel their trips on that day altogether, with some of them cancelling work or business trips. The evidence suggests that these trips were cancelled forever, as opposed to being rescheduled. This is a real reason of concern, showing that the odd-even policy likely had some negative impacts on economic activity.
Was April really any different?
Odd-even had remarkably consistent impacts over the two rounds. The impact on traffic congestion measured using Google Maps data was very similar in January and April, as were the overall driver responses in terms of using their restricted four-wheeler, or using any private vehicle, and the impact on satisfaction and trips.
Where we do notice changes, however, they are generally consistent with lower effectiveness of the policy in April. In January 3% and 6% of drivers use other four-wheeler on unrestricted and restricted days respectively. In April, these numbers are 10 and 19%, respectively. Moreover, fewer drivers switched to two-wheelers or public transport in April, compared to January.
Unfortunately, we cannot read too much into these differences. They are likely in part due to other factors that distinguish April and January, such as hot weather. Indeed, more drivers use their cars even on unrestricted days in April. This is not what one would expect if the only difference between the two rounds was the advance notice in April. Nevertheless, overall we do not have any evidence that drivers used the longer advance time to find public transport routes.
What about pollution?
We did not analyse pollution levels directly. While the main goal of the odd-even policy was to reduce pollution, looking at traffic congestion is useful for three reasons. First, traffic congestion is the central mediating factor: the goal is to reduce emissions from cars on the road. Moreover, less congestion implies less exposure, especially for the most exposed commuters such as pedestrians, bicycles, two-wheeler and auto drivers. Third, reductions in traffic congestion are directly beneficial by making commuters’ trips shorter and more predictable. For all these reasons, it is sensible to look at traffic congestion.
What to make of it all?
Policy experiments are useful insofar as they are analysed carefully based on reliable data, and Delhi’s odd-even policy is no exception. The stakes are high, as the lessons drawn from this short-term but large-scale initiative will influence transportation policy decisions in Delhi and beyond.
The evidence presented above suggests a balanced, cautiously optimistic view on the odd-even policy. The consistent impact on traffic congestion over both rounds and the lack of major disruptions, recommend it strongly as a short-term or emergency measure in the future. However, suggestive warning signs in terms of driver adaptation and disrupted economic activity imply that the Delhi government should proactively explore other policies to improve traffic congestion, both in the short- and-medium run.
In the medium run, Delhi should set up the stage for a system of electronic road pricing (ERP)1. Jakarta, another megacity battling severe traffic jams, recently declared road pricing the only viable solution to sustainably reduce traffic congestion, and is taking active steps to implement it by the end of 2017. After successful tests of the automatic enforcement technology, the city government is setting up the legislative framework and starting the bidding process for implementing ERP. In the short term, they are looking for stop-gap measures to reduce congestion, and odd-even is on their radar. Indeed, they have analysed Delhi’s experience with considerable interest. However, the government is clear that only an ERP-type solution can bring sustainable, long-term relief on the city’s most congested roads.
In the short term, the Delhi government could also explore and rigorously evaluate traffic policies tailored to specific corridors and areas in Delhi, and focus specifically on the rush hour intervals. Compared to the sweeping odd-even policy, which applied across Delhi and throughout the day, these design tweaks allow drivers more options to avoid congestion, for example by changing their routes or travel times.
Critics will contend that measures such as odd-even or more tailored policies will not make a large difference, so it is not worth wasting time on them. Of course, high-impact policies should always be explored, for example through competitions such as the Urban Labs Innovation Challenge that supports original interventions.
A version of this article has previously appeared in Indian Express: http://indianexpress.com/article/explained/delhi-odd-even-scheme-delhi-traffic-jams-delhi-air-pollution-delhi-government-arvind-kejriwal-2851167/
Notes:
- Under a road pricing (or congestion pricing) system, vehicles on certain congestion-prone corridors are charged for using those roads. Charges may differ at different times of the day. Unlike traditional road tolls the main goal is to ease severe congestion, not to raise revenue. Enforcement often relies on on-board-units (OBU) that are linked to a prepaid account and identify each vehicle as it enters the restricted area, as well as automatic license plate reading technology based on video cameras.
Further Reading
- Banerjee, R (2016), ‘Odd-even 2 had little impact on traffic’, CRRI, The Times of India, 13 May 2016.
- Jakarta Post (2015), ‘Ahok set on electronic road pricing’, The Jakarta Post, 1 October 2015.
- Kamis (2016), ‘Jakarta governor officially removes 3-in-1 policy’, Antara News, 12 May 2016.
- Kreindler, G and J Shah (2016), ‘Driving Delhi: The impact of driving restrictions on driver behaviour’, Ideas for India, 8 February 2016.
- Kreindler (2016), ‘Driving Delhi: The impact of driving restrictions on driver behaviour’, Final Report.
- Octkara, D (2016), ‘Transport Minister Gives Green Light for Jakarta`s ERP Scheme’, Tempo.co, 29 April 2016.
- Press Trust of India (2016), ‘Huge traffic snarls in Delhi despite odd-even scheme’, Business Standard, 18 April 2016.
- Sudarshan, A, S Harish, M Greenstone (2016), ‘April wasn’t January’, The Indian Express, 13 May 2016.

Comments will be held for moderation. Your contact information will not be made public.