

 18 October, 2018


Insufficient school accountability and limited parental awareness of school quality can result in poor learning outcomes of students. This article reports the results of a randomised experiment in rural Rajasthan to better understand how greater awareness among schools and households of extant learning levels can lead to changes in student performance in an education market with both public and private providers of primary schooling.
Public schools in India are typically mediocre and often dysfunctional. Not surprisingly, therefore, between 2006 and 2014, private enrolment in primary grades went up 10 percentage points and about one-third of all enrolled children now attend private schools in rural areas (Pratham, 2015). While average learning outcomes in private schools are usually better, private schools typically hover just above the public alternatives that are available. Often, schools – public or private – cannot be held accountable for poor services if parents cannot correctly assess the quality of education being provided to their children. Thus, insufficient school accountability and limited parental awareness of school quality can be factors that result in poor learning outcomes of students. In International Growth Centre (IGC) research that is forthcoming in the Journal of Development Economics, we (Afridi, Barooah, and Somanathan), report the results of a randomised experiment in rural Rajasthan to better understand how greater awareness among schools and households of extant learning levels can lead to changes in student performance in an education market with both public and private providers of primary schooling.
Our experiment
Our research design allows us to test hypotheses about the nature of effective information by comparing results from ‘treatments’ (interventions) in which only one side of the market (parents or schools) receives information, with those in which school quality is common knowledge in the community. Unlike most existing information interventions, we do not induce community dialogue or mobilisation. Since collective action is more resource-demanding and often difficult to catalyse, it is useful to know whether low-cost information provision can aid education policy.
Specifically, we randomly assigned a panchayat (village council) (plausibly the entire local education market for primary schooling) to either a ‘control group’ in which no attempt was made to bridge existing information gaps in the education market, or one of four ‘treatment groups’ in which we provided either households or schools or both with report cards on student performance in curriculum-based tests (for Hindi, English, and Math) designed and administered by us for grades 3 and 4.
In the first treatment (T1) only parents received a report card (P1) with their child’s (say, Yashoda) absolute score in the tests we administered and her rank in her grade, as shown in Figure 1. Parents were thus able to evaluate Yashoda’s performance in her grade.
Figure 1. Parental Report Card P1
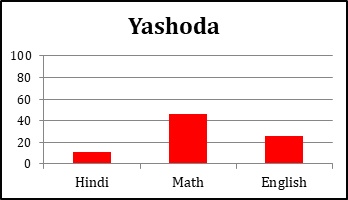
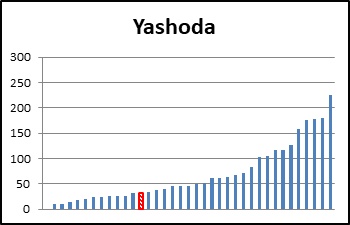 Notes: The graph on top shows the student’s (Yashoda) score out of 100 in each subject. The bottom graph shows the combined scores (out of 300) of all students in her class with the student’s score highlighted by the shaded, red bar.
 In the second treatment (T2), in addition to the parent report card P1, we gave report cards to schools (S1, shown in Figure 2) on the average performance of their own students. In this treatment, therefore, both households and schools had information on the intra-school performance of their ward(s).
Figure 2. School Report Card S1
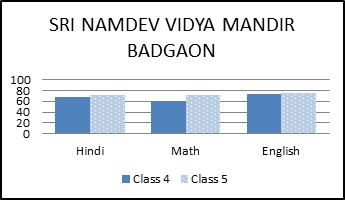 Note: The graph shows the average score in each subject (out of 100) of grade 4 (in blue) and grade 5 (in light blue) of a school.
 Table 1. Number of students in the school-grade who achieved a particular cognitive skill
| Hindi | Grade 4 | Grade 5 | Math | Grade 4 | Grade 5 | English | Grade 4 | Grade 5 |
|---|---|---|---|---|---|---|---|---|
| Alphabet and word recognition | 10 | 20 | Counting | 10 | 20 | Alphabet and word recognition | 8 | 16 |
| Word and sentence writing | 8 | 7 | Addition:
1-digit 2- digit 3-digit |
8 6 6 |
15 15 15 |
Word and sentence writing | 10 | 15 |
| Simple comprehension | 10 | 4 | Subtraction:
1-digit 2- digit 3-digit |
8 5 4 |
15 12 10 |
Simple comprehension | 9 | 11 |
| Difficult comprehension | 9 | 4 | Multiplication:
2-digit x 1-digit 2-digit x 2-digit |
7 7 |
20 13 |
|||
| Composition | 7 | 6 | Measurement | 6 | 17 | |||
| Word problem solving | 5 | 12 | ||||||
| Total students | 10 | 28 | 10 | 28 | 10 | 28 |
The third treatment (T3) had all the elements of the second (that is, P1 and S1) plus the average scores of all schools in the panchayat in the school report card (S2, shown in Figure 3). Hence, in addition to S1, schools were able to place themselves in the distribution of scores in the panchayat. But households did not have information on relative school quality.
Figure 3. School Report Card S2
| Grade 4 | School Name | Village | Hindi | Math | English |
|---|---|---|---|---|---|
| 1 | RAJKIYA MADHYAMIK VIDHALYA, SAIDARIYA | Saidariya | 26 | 24 | 18 |
| 2 | RAJKIYA PRATHMIK VIDHALYA, RAIL KI BAADIYA | Saidariya | 45 | 50 | 57 |
| 3 | RAJKIYA UCCH PRATHMIK VIDHALYA, BADGAON | Badgaon | 38 | 35 | 29 |
| 4 | SATYANAND PUBLIC SCHOOL, BADGAON | Badgaon | 77 | 81 | 85 |
| 5 | SRI NAMDEV VIDYA MANDIR, BADGAON | Badgaon | 68 | 61 | 74 |
| Grade5 | School Name | Village | Hindi | Math | English |
| 1 | RAJKIYA MADHYAMIK VIDHALYA, SAIDARIYA | Saidariya | 27 | 34 | 28 |
| 2 | RAJKIYA PRATHMIK VIDHALYA, RAIL KI BAADIYA | Saidariya | 69 | 70 | 78 |
| 3 | RAJKIYA UCCH PRATHMIK VIDHALYA, BADGAON | Badgaon | 54 | 55 | 63 |
| 4 | SATYANAND PUBLIC SCHOOL, BADGAON | Badgaon | 85 | 92 | 87 |
| 5 | SRI NAMDEV VIDYA MANDIR, BADGAON | Badgaon | 73 | 73 | 75 |
Notes: This table reports the average score in each subject (out of 100) of all schools in a panchayat, by grade.
In treatment 4 (T4), all elements of treatment 3 were included plus a report card to the household (P2) on the performance of their child relative to all children in the panchayat’s schools. Thus, in the fourth treatment we tried to create common knowledge of relative student and school performance.
Figure 4. Parental Report Card P2
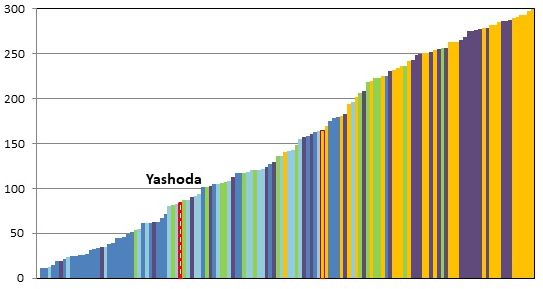 Notes: This graph shows the combined scores (out of 300) of all students of the same grade in the panchayat. Each bar shows the score of one student. Students of the same schools are depicted by bars of the same colour. The index maps the colours to the schools. The target student’s name is mentioned and her score is highlighted by the shaded, red bar.
 Our experiment design is summarised in Table 2.
Table 2. Study design
| Report card recipient | Control | T1 | T2 | T3 | T4 |
|---|---|---|---|---|---|
| Type of report card | |||||
| Household | None | P1 | P1 | P1 | P1 and P2 |
| School | None | None | S1 | S1 and S2 | S1 and S2 |
| Number of schools | 35 | 29 | 37 | 28 | 30 |
| Private | 17 | 13 | 11 | 12 | 10 |
| Public | 18 | 16 | 26 | 16 | 20 |
| Number of students | 1,064 | 860 | 1,319 | 918 | 996 |
| Private | 541 | 361 | 461 | 432 | 397 |
| Public | 523 | 499 | 858 | 486 | 599 |
Notes:
P: Parental report card; S: School report card.
P1: (i) Child's score by subject (ii) Child's total (combined) score relative to all students’ combined scores in her grade.
P2: (i) Child's total score relative to the total score of all students in the panchayat with each school marked out.
S1: (i) Average score by subject and grade (ii) Percentage of students correctly answering each question by grade.
S2: (i) Average score of schools in the panchayat in Hindi, Math, and English, by grade.
Subsequent to the randomised provision of report cards on student performance at baseline (July – September 2011), we conducted another round of tests of learning levels, almost a year later (August – October 2012).
What type of information is most effective in improving learning?
Our results provide evidence of a positive impact on learning outcomes when information on both intra- and inter-school performance is provided to both stakeholders – households and schools (T4). There is no impact on test scores when information only on the intra-school quality is provided to either or both households and schools. Further, we find statistically insignificant difference in children’s learning levels between T1, T2, and T3 for both the private and public school samples. However, the impact of T4 on learning is positive and significantly different from both T2 and T3 for the private school sample. This implies that when information is provided on relative school performance to both households and schools (that is, T4) learning outcomes improve significantly more than when information on only intra-school performance is made available to both sides of the market (that is, T2) and when relative school quality information is provided to schools alone (T3).
Information to which side of the market is most effective?
We find that as compared to T3, providing information on relative school quality to households is necessary (T4). But this holds only for students enrolled in private schools at baseline – test scores improved by more than one-third or 30% of a standard deviation1 when information on relative quality of schooling was provided to both households and schools. Thus, common knowledge of relative school quality is necessary but not sufficient for improving learning outcomes. Empowering households holds the key.
Incentives matter
The impact of providing information on school quality is jointly significant for all treatments for the private school sample but insignificant for public schools.
The improvement in learning outcomes was driven by the increase in the private schools’ resources and effort. We find that an index of school response to the intervention, measured by parental perception of schools’ effort, schools’ interactions with parents and resources, improved by 26% to 43% of a standard deviation, relative to the baseline, but only when information on relative quality of schooling (that is, T4) was provided to both households and schools in the private school sample.
We do not find any change in households’ education expenditures or parental effort in either the private or public school sample in any treatment arm. These findings suggest that when information on the relative quality of schooling is common knowledge, the service providers respond significantly when their incentives are linked to their performance in the market. Social pressures through information provision, alone, on poorly performing schools may not be sufficient to have a significant impact on school quality.
Our findings, thus, indicate that both the nature of information and the incentives of service providers can impact learning outcomes. Our experiment suggests that even in the absence of community pressures created through explicit dialogues between the service providers and households, information itself can be a powerful instrument for raising service quality. While our results support the findings of Andrabi et al. (2017) for Pakistan, they also suggest that public schools’ incentives should be redesigned to align them with those of the households (Banerjee et al. 2010).
Recent initiatives in the states of Delhi and Andhra Pradesh aim to create common knowledge of the quality of schooling at the primary level through objective ranking of schools on multiple dimensions (including learning outcomes) by making these ‘report cards’ available both publicly as well as through messages to parents’ mobile phones. Our findings lend support to such policy initiatives to improve the quality of schooling in India.
Notes:
- Standard deviation is a measure that is used to quantify the amount of variation or dispersion of a set of values from the mean value (average) of that set.
Further Reading
- Afridi, Farzana, Bidisha Barooah and Rohini Somanathan (2018), “Improving learning outcomes through information provision: Experimental evidence from Indian villages”, forthcoming, Journal of Development Economics.
- Andrabi, Tahir, Jishnu Das and Asim Ijaz Khwaja (2017), “Report cards: The impact of providing school and child test scores on educational markets”, American Economic Review, 107(6): 1535–63.
- Banerjee, Abhijit, Rukmini Banerji, Esther Duflo, Rachel Glennerster and Stuti Khemani (2010), “Pitfalls of participatory programs: Evidence from a randomized evaluation in education in India”, American Economic Journal: Economic Policy, 2(1): 1–30. Available here.
- Pratham (2015), ‘Annual Status of Education Report 2014’, January 2015.

Comments will be held for moderation. Your contact information will not be made public.