

 04 January, 2023


In this piece, Trivedi and Mumtaz attempt to analyse the performance of e-governance service delivery across different tiers of government and service categories, through the volume of end-to-end electronic transactions occurring during service delivery. They use the data aggregated by the eTaal portal to conduct a temporal analysis, and demonstrate an exponential growth in the adoption of e-governance services in India. They emphasise the pathway for bridging the gaps in e-governance service delivery through an accelerated, unified, platform-driven approach.
July 2022 marked the completion of seven years of the Digital India Mission, which aims to transform India into a digitally empowered society. One of the three key pillars of the flagship programme – ‘Governance & Services on Demand’ – aimed to build on the past successes of the Centre and state governments in the area of e-governance, to foster seamless, integrated, platform-agnostic, universal access to digitally transformed services for citizens. Towards this goal, e-Kranti, the National e-Governance Plan (NeGP) 2.0, focussed on transforming government through technology and driving electronic delivery of services.1 The internal governance transformation involved significant re-engineering of government processes using IT to improve transactions, workflow automation, electronic database sharing, and the critical overhaul of the Centralized Public Grievance Redress and Monitoring System (CPGRAMS) portal. The citizen-facing service delivery improvements focussed on driving greater demand by transforming the electronic service delivery across education, healthcare, agriculture, justice, financial inclusion, security, and urban services, among others. After FY2017-18, the emergence and adoption of a platform-based approach to e-governance service delivery has further fueled this transformation.
In this article, we conduct a unique analysis of the usage of e-governance services in India, based on a critical metric, an ‘e-transaction’, tracked by the Electronic Transaction Aggregation & Analysis Layer (eTaal) portal. The portal provides a real-time aggregated view of the volume of end-to-end e-transactions occurring across different tiers of the government.
The platform defines an ‘e-transaction’ as a “transaction delivering public service using ICT [information and communications technology] tools to improve access, enhance transparency and reduce response time while also satisfying all of the following four conditions: (i) Service is requested through electronic means (self-access or assisted access) including mobile devices, (ii) workflow/approval process is electronic, (iii) database is electronic/digitised, and (iv) service delivery is electronic”. Given this comprehensive definition, the volume of e-transactions is a potent metric that can measure the ‘outcomes’ of Government-to-Citizen (G2C), Government-to-Business (G2B), and Business-to-Citizen (B2C) e-services across ministries, states, and service categories.
Country-level analysis
eTaal has integrated over 4,000 e-services, and provided time-series data for about 416 billion e-transactions since its inception in 2013. Figure 1 reveals a 43 time increase in number of e-transactions from 2013 to 2021.2
Figure 1. National e-transactions from 2013 to 2022
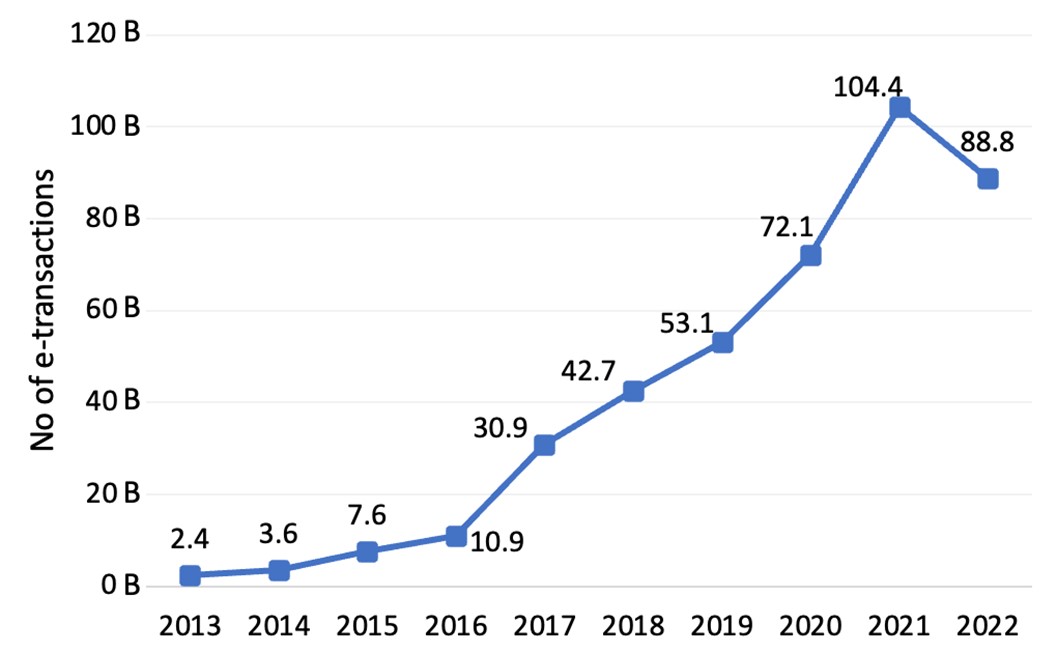
Note: The number of transactions in 2022 is as of 9 August, 2022.
Analysis by category
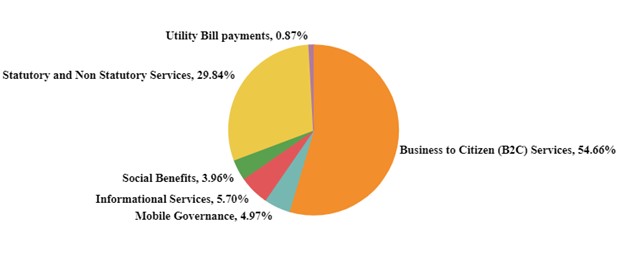
e-Taal buckets all e-services into six different categories. Figure 2 shows that 55% of all e-transactions from 2013-2021 by volume fall under the B2C service category, followed by statutory and non-statutory services category at 30%.
Figure 2. Cumulative percentage of e-transactions per category from FY2013-14 to FY2021-22
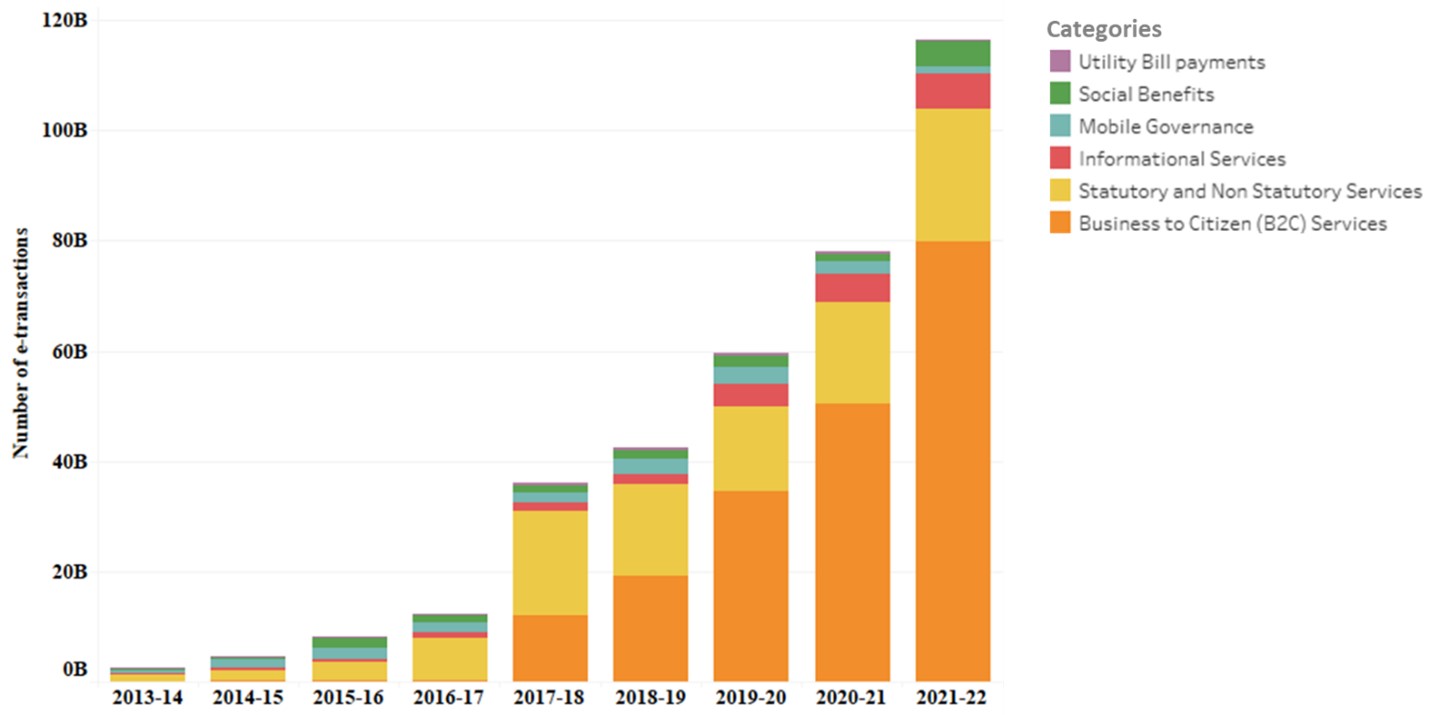
The B2C service category saw a 3823.8% increase in number of e-transactions in FY2017-18, and since then the number has been growing at an exponential rate (see Figure 3). Statutory and non-statutory services witnessed a 147.9% increase in e-transactions count in 2017-18, post which the growth has stagnated.
Figure 3. Number of e-transactions per category (in billions) from FY2013-14 to FY2021-22
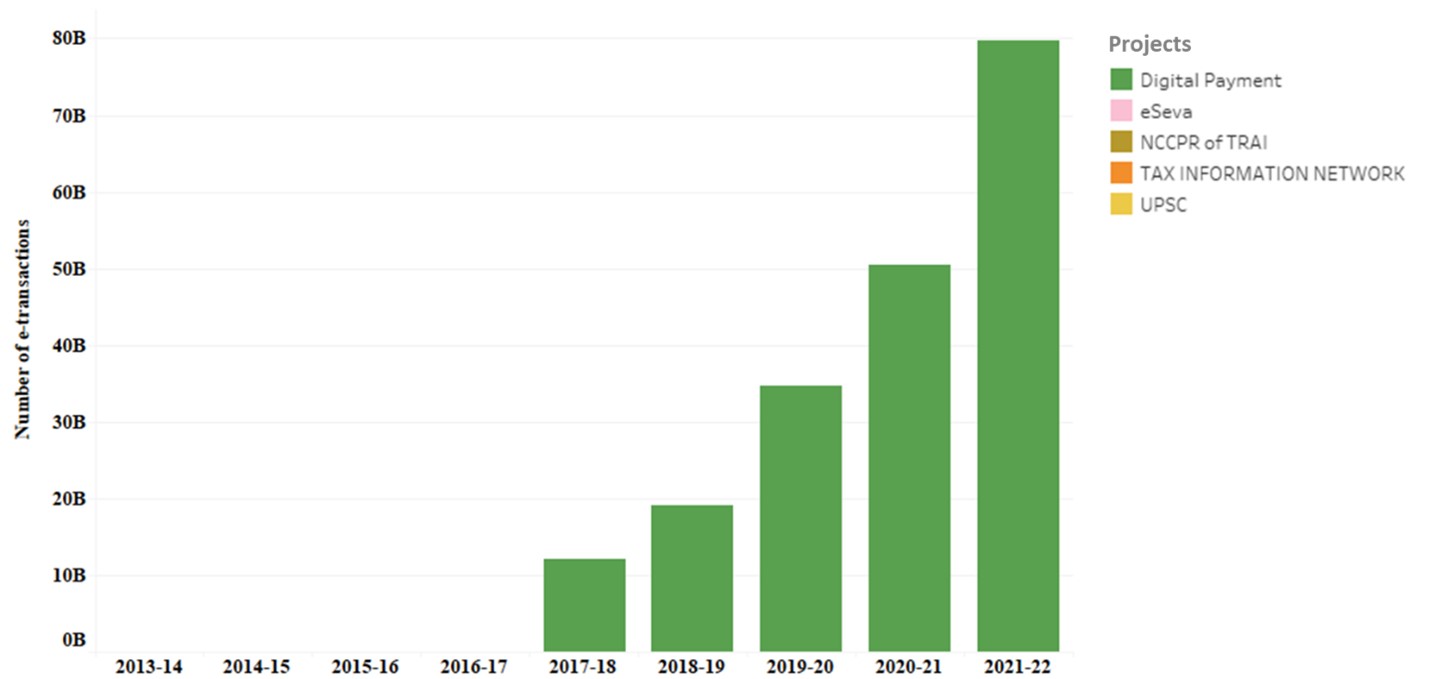
We further analyse the project wise break-up of these top two service categories. Under the B2C services category, 99.5% e-transactions are from central projects, out of which 99.53% are from digital payments (Figure 4). The jump in e-transaction counts in FY2017-18 can also be attributed to the adoption of digital payments.
Figure 4. Number of e-transactions from central projects, by project type, under the B2C services category
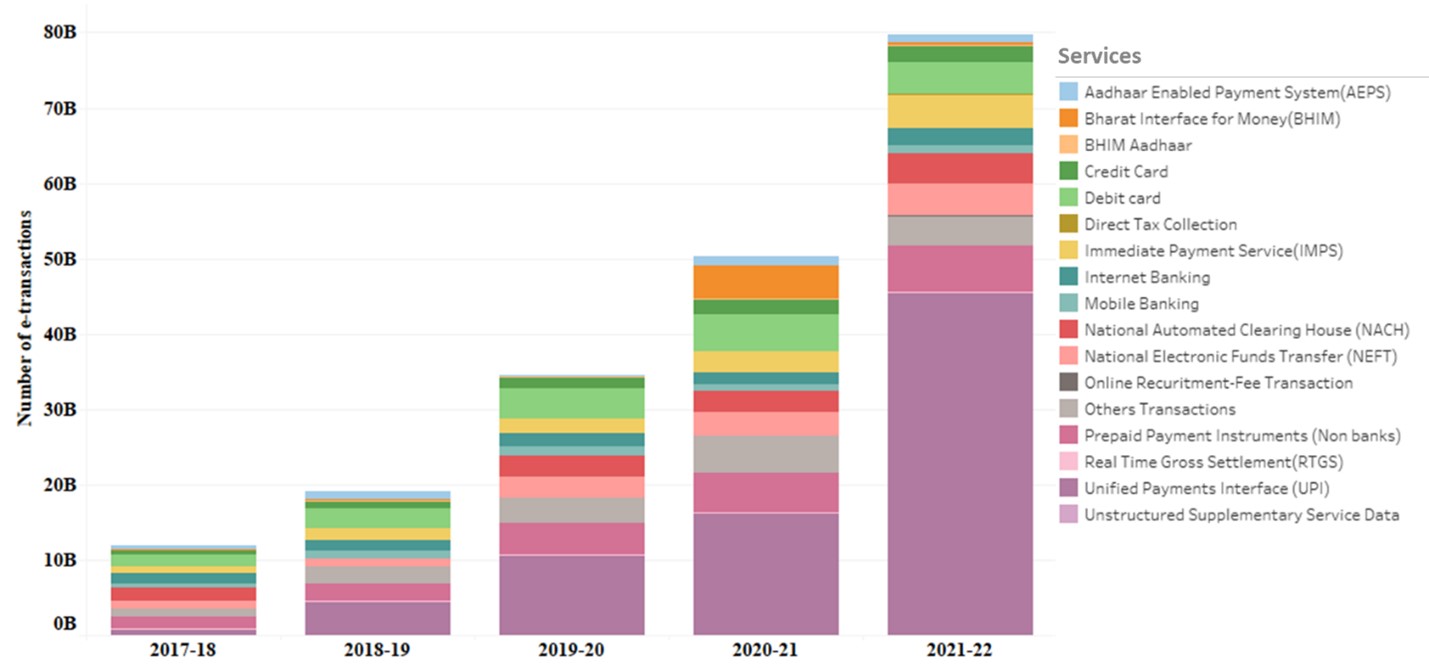
The breakup of e-transactions as per the exact type of service under digital payments in Figure 5 reveals that the highest growth was seen in the adoption of Unified Payments Interface (UPI) services over the years, followed by prepaid payment instruments and debit cards.
Figure 5. e-transactions breakup for digital payment services
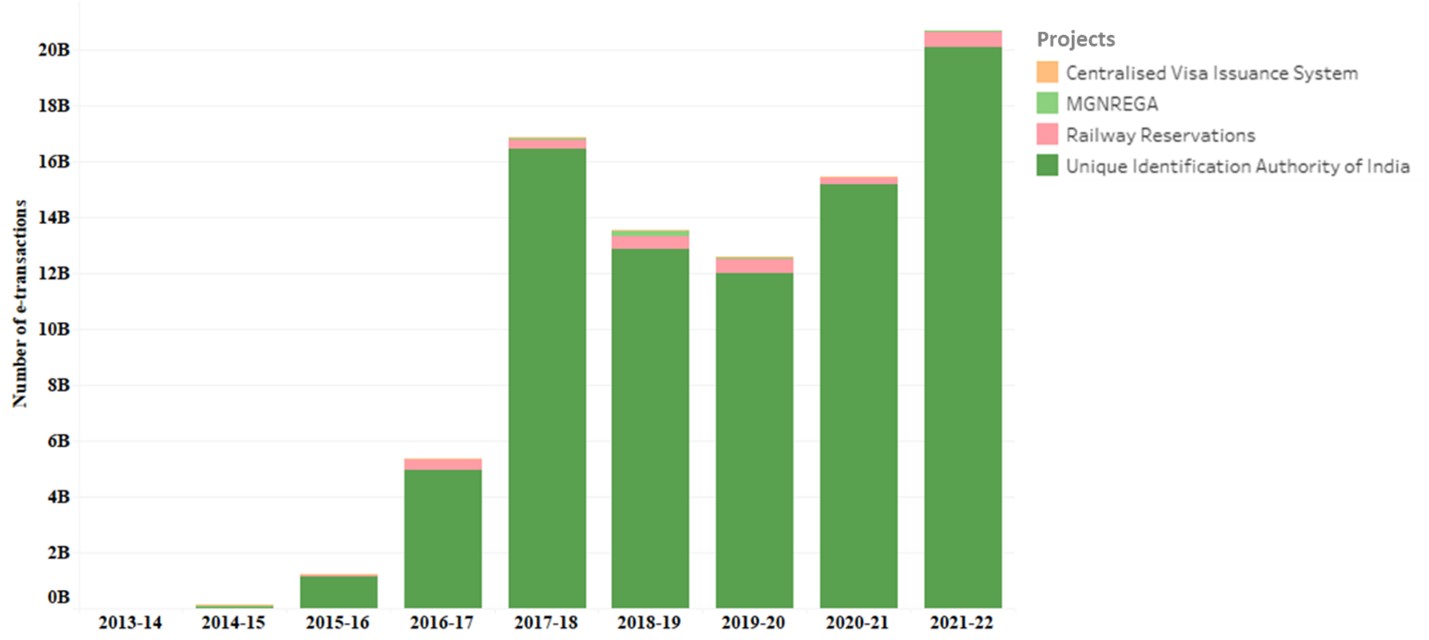
Under the statutory and non-statutory services category, Unique Identification Authority of India (UIDAI) services account for 98% of the total volume of e-transactions (see Figure 6). UIDAI services saw a jump in FY2017-18, following which the number of e-transactions under this service category has not seen a major change.
Figure 6. Number of e-transactions by project under the statutory and non-statutory services category
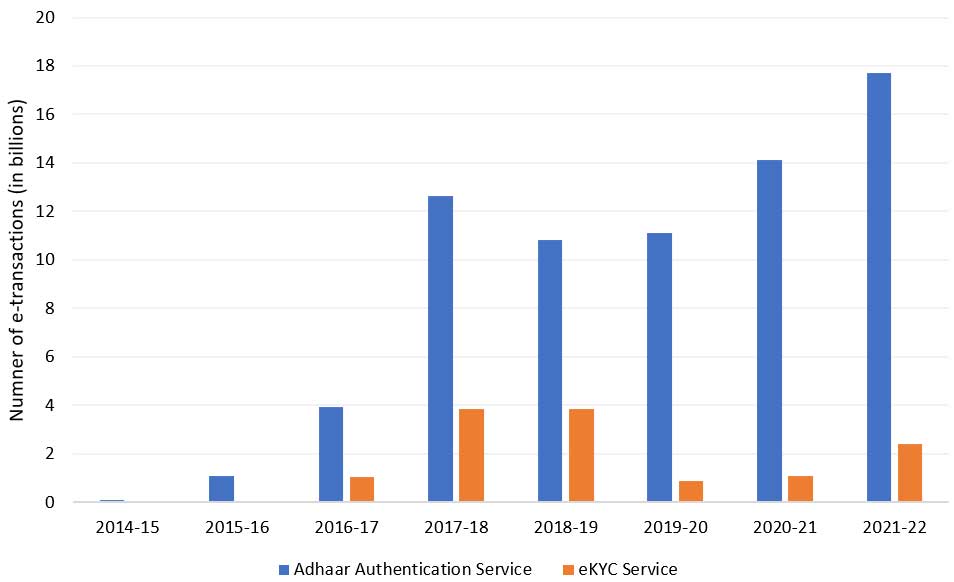
A deeper enquiry into this trend (Figure 7) reveals that UIDAI provides two kinds of services: A ‘Yes/No’ authentication validating the Aadhaar, demographic, and/or biometric information; and a full-fledged ‘e-KYC’3 that returns digitally signed, encrypted KYC data. While both the e-authentication as well as e-KYC transactions reduced in FY2018-19, the further drop in e-transactions in FY2019-20 was driven by reduction in e-KYC transactions. This can largely be attributed to the saturation of Aadhaar penetration, and it’s seeding with basic services like bank accounts and PAN cards that was driving the growth during the initial years.
Figure 7. Breakup of e-transactions for UIDAI services
Analysis by state and union territory
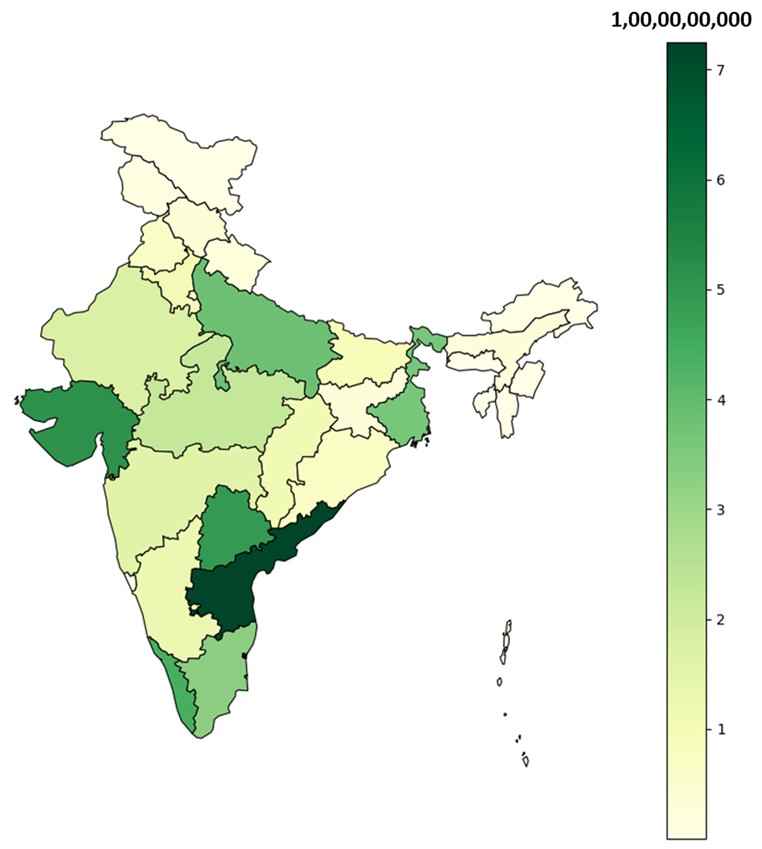
If we look at the cumulative number of e-transactions made by any state from 2013-2021 (as depicted in Figure 8), it is observed that the highest number of e-transactions were from Andhra Pradesh, Gujarat, Telangana and Kerala, while the lowest number of e-transactions have been from Ladakh.
Figure 8. State-wise distribution of e-transactions from FY2013-14 to FY2021-22
Meanwhile, Figure 9 tracks the change in e-transaction density across states over the years. In FY2019-20, the number of e-transactions per thousand population surpassed the one thousand mark in all states. Gujarat is the only state where the e-transaction density has consistently been higher than 5,000 each year, from FY2013-14 till date.
Figure 9. The changing number of e-transactions per 1,000 population from FY2013-14 to FY2021-22
Figure 10 showcases the temporal trend in the number of e-services and e-transaction density across states. It is evident that initially, the leading states in particular tend to convert their existing offline services into e-services through basic digitisation. This leads to a large number of services being available, but their usage still continuing to be low in terms of e-transactions density. Eventually, as quality of service becomes a priority, the need for convergence leads to a lower number of e-services with increased usage, which points to the evolving maturity of e-government applications in such states.
Figure 10. State-wise trends in e-transactions from FY 2013-14 to FY2021-22
Notes: i) The y-axis denotes the number of e-transactions per 1,000 population. ii) The x-axis denotes the number of e-services available. iii) The circle size denotes the total number of e-transactions.
Looking at the state and category-wise e-transaction split (see Figures 11 and 12), we note that Andhra Pradesh and Telangana have more e-transactions in the social benefits services category; this volume largely belongs to the social welfare pensions and rural development services. Under the social welfare pensions services, the maximum transactions were through social security pension releases to beneficiary accounts, while for rural development services, the maximum e-transactions were Aadhaar-linked payments to beneficiaries and loan requests for unemployment in villages.
Figure 11. Cumulative e-transactions by state and category, from FY2013-14 to FY2021-22
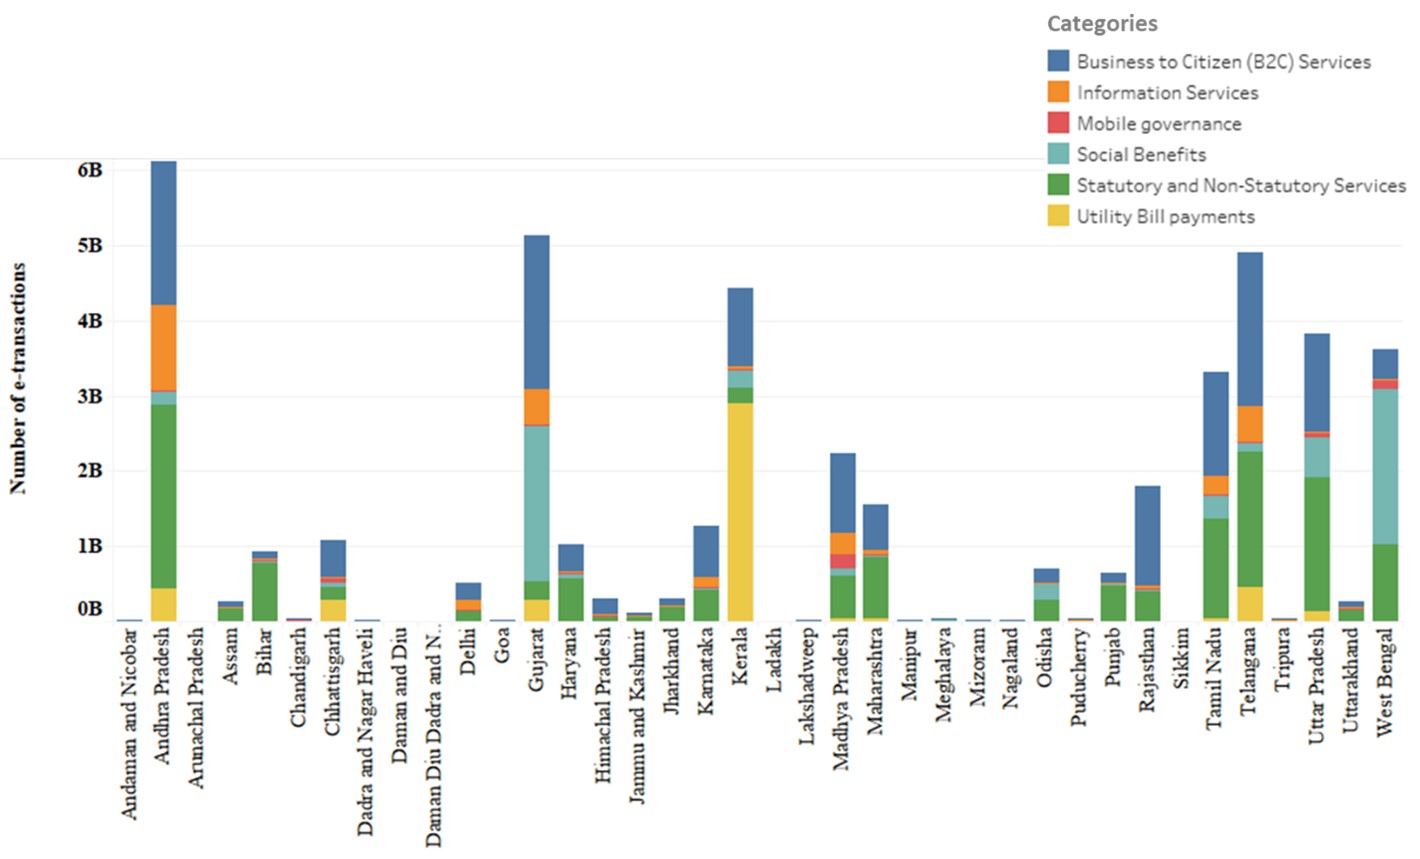
Figure 12. Growth of e-transactions across states and categories, from 2013 -2022
The adoption of e-transactions for mobile services is exceptionally high in Kerala. This is can largely be attributed to the strong legacy of ICT-based reforms: right from the Akshaya project – India’s first e-governance project – to the mGovernance project launched by Kerala State IT Mission (KSITM) in early 2010 to cover over sixty state departments and provide mobile services using SMS and an integrated service delivery platform (Karunakaran 2011, Nissar 2014).
Andhra Pradesh, Gujarat, and Telangana have recorded higher e-transactions in the statutory and non-statutory services as compared to other states. For Andhra Pradesh and Telangana, this is largely due to the excellent implementation and adoption of 'MeeSeva’, a portal which provides smart and efficient citizen-centric delivery of an entire range of G2B and G2C services through a one-stop platform.
In the early years, Gujarat gained a large number of e-transactions by issuing and receiving public distribution system (PDS) food coupons; however, over the years, informational services like viewing exam results and land records online have also resulted in a high number of uses. Gujarat has also been one of the leading states in the implementation of e-governance through infrastructure, policies and projects.4
Analysis by ministry
Figure 13. shows that almost 97% of the volume of cumulative e-transactions from 2013-2022 were concentrated within five union ministries – namely the Ministry of Finance, Ministry of Electronics and Information Technology, Ministry of Agriculture and Farmers Welfare, Ministry of Law and Justice and Ministry of Petroleum and Natural Gas.5
Figure 13. Cumulative e-transactions by ministry, from FY2013-2014 to FY2021-2022
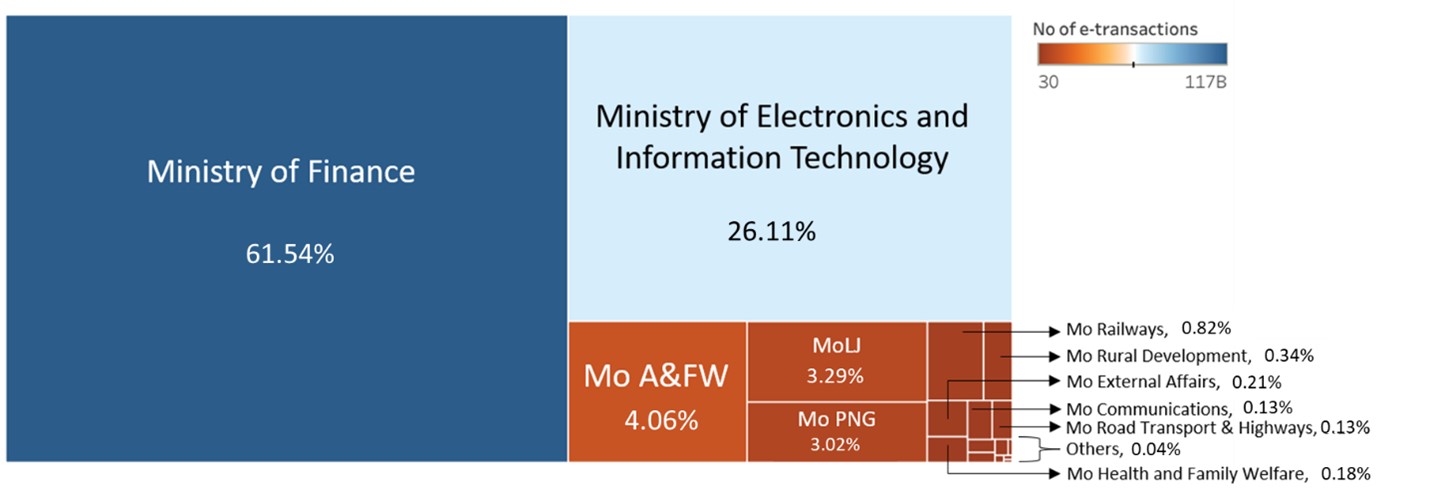
Source: Authors’ calculations based on data published on the eTaal dashboard.
Analysing the number of e-services offered and the number of e-transactions recorded under each of the union ministries over the years (Figure 14), a reduction in the number of e-services offered can be observed. This indicates a shift from a siloed e-service approach to an integrated one, with a focus on quality rather than quantity.
Looking at the trend in the number of e-transactions, the Ministry of Finance saw a massive increase of 19.8 times from FY2016-2017 to FY2017-2018.
Figure 14. Distribution of e-services and e-transactions for union ministries by year
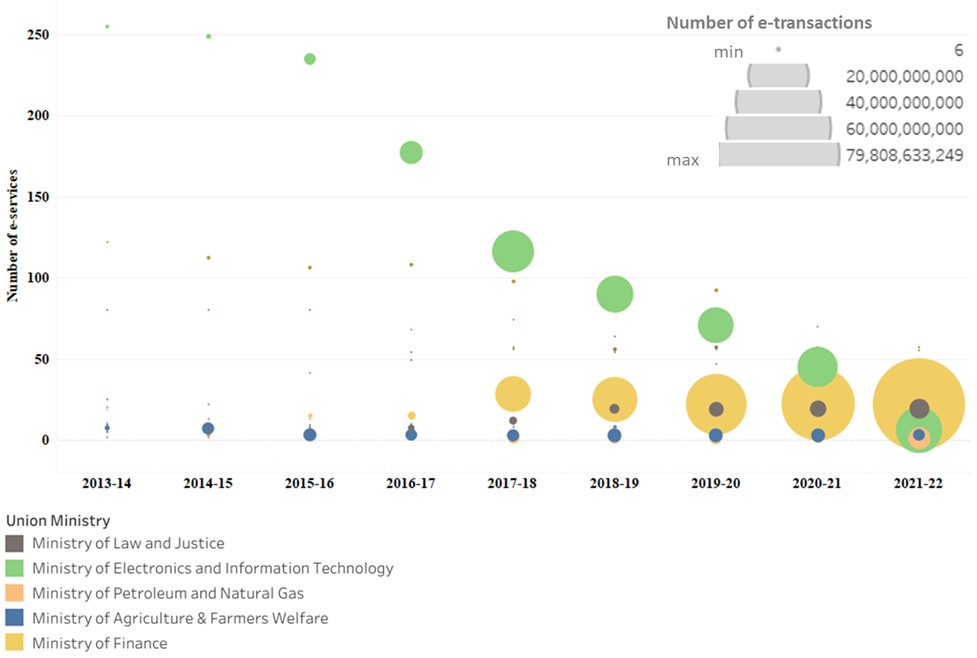
Source: Authors’ calculations based on data published on the eTaal dashboard.
Note: The legend is intended to help distinguish the trend seen in the top five union ministries in terms of number of e-transactions; the remaining data points are drawn to display the general trend over the years.
Conclusion
Our presentation and analysis of these statistics reveal that India has experienced an exponential growth in the adoption of e-governance services. Digital payments and UIDAI have been the key drivers of this growth, demonstrating the widespread success of two key elements of the Jan Dhan-Aadhaar-Mobile (JAM) trinity. Additionally, the transfer of social benefits (incorporating the third pillar of Jan Dhan accounts) has also seen 192% growth since 2015, which corroborates the widespread adoption of Direct Benefit Transfer (DBT) in almost all major developmental and social protection programmes of the Government of India.
At a sub-national level, states and union territories with early adoption of e-government initiatives such as Andhra Pradesh, Telangana, Gujarat, and Kerala have led the way, with most other states catching up significantly post FY2017-2018. The adoption trends of the leading states over time demonstrate the initial shift from informational or communicational to transactional stages of e-governance development, with the growth concentrated in a large number of siloed e-services. This was subsequently consolidated into fewer but more integrated services, highlighting the shift in focus towards improved quality of services, and thereby driving increased use of e-governance services.
Overall, the findings indicate that India is presently on its way from the ‘transactional stage’ towards the ‘integration stage’ of e-governance development. With the current government’s continued focus on open and unified digital platforms, India is well on its way to leapfrog into the arena of interactive democracy. The agenda that lies ahead for most states and ministries to move towards, is breaking through silos to arrive at a more citizen-centric, unified, platforms-driven approach towards improved e-governance service delivery.
Notes:
- For more details, see the e-Kranti: National eGovernance Plan 2.0 (Department of Electronics and Information Technology, 2015).
- This calculation doesn’t take 2022 into account, as the count at the time of writing this was not representative of the entire year’s e-transactions.
- e-KYC, or paperless KYC (Know Your Customer), is the process of electronically verifying a customer's credentials.
- Some of the notable e-services enabled by the state include e-Dhara, e-City, and the e-Gram Viswagram project, among others.
- This was achieved mainly through digital payments, UIDAI services, Kisaan SMS portal, e-courts and Pratyaksh Hanstantrit Labh (PAHAL) for the delivery of subsidies to LPG consumers, respectively.

Comments will be held for moderation. Your contact information will not be made public.