

 03 September, 2020


Large fiscal deficits and even larger public-sector borrowing requirements are a regular feature of the fiscal landscape in India. In this context, Mundle and Sikdar argue that rationalisation of the prevailing large volume of non-merit subsidies should constitute a major component of deep fiscal reforms. Doing so could free up the fiscal space needed to address the challenge of declining growth.
In Part I of this two-part series, the authors present estimates of central, state, and combined budget subsidies for the years 1987-88, 2011-12, 2015-16, and their merit and non-merit components.
The Indian economy is chronically under fiscal stress. While total tax revenue (Centre plus states) has remained below 18% of GDP (gross domestic product), total expenditure has progressively risen to 29% of GDP (Government of India, 2018). Large fiscal deficits and even larger public-sector borrowing requirements are a regular feature of the fiscal landscape. In this context, we argue that rationalisation of the prevailing large volume of non-merit subsidies should constitute a major component of deep fiscal reforms. Such reforms could free up the fiscal space needed to address the challenge of declining growth since 2017-18 – a challenge that has been greatly aggravated by the Covid-19 shock, and the stringent nationwide lockdown which followed.
In part I of this series, we present estimates of central, state, and combined budget subsidies for the years 1987-88, 2011-12, 2015-16, and their merit and non-merit components1. In part II, we will discuss the relationship between subsidies and service delivery, the efficiency of states in the use of subsidies, and the use of fiscal space freed up through subsidy rationalisation and other deep fiscal reforms2.
Estimating budget subsidies
Following the method of subsidy measurement in the original estimate by Mundle and Rao (1991), budget subsidy has been defined in this exercise as the unrecovered cost of social and economic services delivered by the government. Administrative services are assumed to be pure public goods for which costs are not recoverable by definition. Hence, the 36 administrative services in the Finance Accounts database are not included in the reckoning. Formally,

Where, j = 37…123 indexes the services.
For the jth sector;
sj is the subsidy;
vj is the variable cost or revenue expenditure on the service;
Kj is the capital stock in the sector;
Lj is the stock of investment outside government by the sector in the form of loans or equity;
i is an imputed interest rate representing the opportunity cost of money for government;
d is the depreciation rate;
yj is revenue receipts by the sector;
rj is income by way of interest or dividend on loans and equity; and
tj is a transfer payment from the sector to individual agents.
The total volume of subsidies on all services is given by

Direct transfers, concessional interest rates, concessional prices of land or other assets, and tax concessions or exemptions (tax expenditures), are not included in the estimate. Thus, the concept of budget subsidy is strictly confined to the unrecovered cost of government services (goods) other than pure public services (goods).
The estimates cover 18 major states for which the requisite data are available. These correspond to what were earlier (1987-88) 14 major states, including the undivided states of Andhra Pradesh, Bihar, Madhya Pradesh, and Uttar Pradesh. For purposes of comparability, these states have been treated as undivided in the presentation of the estimates. Taken together, these states account for 93% of India’s total population.
The estimates are presented in Table 1. The incidence of total subsidies (Centre plus states) declined from 12.9% of GDP in 1987-88 to 10.7% in 2011-12, and further to 10.3% in 2015-16, that is, a 20% decline in 28 years. The decline was more pronounced for the central government, going down from 4.9% in 1987-88 to 2.9% in 2015-16, that is, a decline of over 40%. The average level of the states’ subsidies declined from 9.4% of the gross state domestic product (GSDP) in 1987-88, to 7.8% in 2015-16, that is, a 17% decline. The distribution around this average ranged from 6.5% (Maharashtra) to 15.3% (Bihar including Jharkhand) in 1987-88. In 2015-16, it ranged from 5.1% (Tamil Nadu) to 11.8% (Madhya Pradesh including Chhattisgarh).
Table 1. Distribution of merit, non-merit, and total subsidies in social and economic sectors (% of GSDP/GDP)
|
Merit subsidies |
Non-merit subsidies |
Total subsidies |
|||||||||||||||||||
|
State |
Social sector |
Economic sector |
Social sector |
Economic sector |
Social sector |
Economic sector |
Total |
||||||||||||||
|
87-88 |
12-Nov |
15-16 |
87-88 |
12-Nov |
15-16 |
87-88 |
12-Nov |
15-16 |
87-88 |
12-Nov |
15-16 |
87-88 |
12-Nov |
15-16 |
87-88 |
12-Nov |
15-16 |
87-88 |
12-Nov |
15-16 |
|
|
(0) |
(1) |
(2) |
(3) |
(4) |
(5) |
(6) |
(7) |
(8) |
(9) |
(10) |
(11) |
(12) |
(13) |
(14) |
(15) |
(16) |
(17) |
(18) |
(19) |
(20) |
(21) |
|
Andhra Pradesh (Telangana) |
3.8 |
2.8 |
3.3 |
0.1 |
0.1 |
0.1 |
2 |
1.2 |
1.5 |
4 |
4.5 |
4.7 |
5.8 |
4 |
4.8 |
4.1 |
4.6 |
4.7 |
10 |
8.6 |
9.6 |
|
Bihar (includes Jharkhand) |
6 |
4.2 |
4.4 |
0.3 |
0.1 |
0.2 |
1.8 |
1.4 |
1.5 |
7.2 |
5.7 |
5 |
7.8 |
5.6 |
6 |
7.5 |
5.8 |
5.3 |
15.3 |
11.4 |
11.2 |
|
Gujarat |
4.1 |
3.3 |
3.2 |
0.1 |
0.1 |
0.1 |
1 |
0.9 |
0.7 |
4.6 |
2.5 |
3.1 |
5.1 |
4.2 |
3.9 |
4.7 |
2.6 |
3.2 |
9.7 |
6.8 |
7.1 |
|
Haryana |
3.1 |
2.5 |
2.8 |
0.1 |
0.1 |
0.1 |
0.9 |
0.8 |
0.8 |
4.4 |
2.3 |
2.9 |
4 |
3.4 |
3.6 |
4.4 |
2.5 |
3 |
8.4 |
5.8 |
6.5 |
|
Karnataka |
4 |
2.7 |
2.8 |
0.1 |
0.2 |
0.4 |
1.6 |
1.3 |
1.5 |
4.1 |
4.2 |
3.9 |
5.6 |
3.9 |
4.3 |
4.2 |
4.4 |
4.2 |
9.8 |
8.4 |
8.5 |
|
Kerala |
4.7 |
2.9 |
2.8 |
0.2 |
0.3 |
0.3 |
1.3 |
1 |
1.7 |
2.7 |
1.8 |
1.7 |
6 |
3.9 |
4.5 |
2.9 |
2.1 |
2 |
8.8 |
6 |
6.5 |
|
Madhya Pradesh (includes Chhattisgarh) |
4.9 |
4.1 |
4.8 |
0.2 |
0.2 |
1 |
1.7 |
1.1 |
1.9 |
4.6 |
4.4 |
4.1 |
6.5 |
5.2 |
6.7 |
4.8 |
4.6 |
5.1 |
11.3 |
9.8 |
11.8 |
|
Maharashtra |
3.5 |
3 |
2.7 |
0.2 |
0.1 |
0.1 |
0.7 |
0.9 |
0.8 |
2.1 |
2.9 |
2.9 |
4.2 |
3.8 |
3.5 |
2.3 |
3 |
3 |
6.5 |
6.8 |
6.5 |
|
Orissa |
3.8 |
3.4 |
4.5 |
0.2 |
0.5 |
0.5 |
1.5 |
1.3 |
1.1 |
4.7 |
3.6 |
3.7 |
5.3 |
4.7 |
5.7 |
4.8 |
4 |
4.2 |
10.1 |
8.7 |
9.8 |
|
Punjab |
3.2 |
2.7 |
2.7 |
0.1 |
0 |
0.1 |
0.8 |
0.5 |
0.6 |
4.7 |
2.4 |
1.9 |
4 |
3.1 |
3.3 |
4.8 |
2.4 |
2 |
8.8 |
5.6 |
5.3 |
|
Rajasthan |
4.9 |
4.8 |
5.1 |
0 |
0 |
0 |
0.9 |
0.6 |
0.8 |
6.2 |
2.2 |
3.1 |
5.8 |
5.4 |
6 |
6.2 |
2.3 |
3.1 |
12 |
7.7 |
9.1 |
|
Tamil Nadu |
3.4 |
2.7 |
2.7 |
0.3 |
0.1 |
0.1 |
0.8 |
0.6 |
0.6 |
4.2 |
2.2 |
1.7 |
4.2 |
3.3 |
3.3 |
4.5 |
2.3 |
1.8 |
8.8 |
5.6 |
5.1 |
|
Uttar Pradesh (includes Uttarakhand) |
3.4 |
4.4 |
4.3 |
0.2 |
0.3 |
0.2 |
0.9 |
0.8 |
1.7 |
4.3 |
4.5 |
5.5 |
4.4 |
5.2 |
6 |
4.4 |
4.8 |
5.7 |
8.8 |
10 |
11.7 |
|
West Bengal*** |
3.5 |
3.9 |
2.5 |
0.2 |
0.1 |
0.1 |
0.9 |
0.7 |
1 |
2.7 |
1.9 |
2.2 |
4.4 |
4.6 |
3.5 |
2.9 |
2 |
2.2 |
7.3 |
6.6 |
5.7 |
|
All states* |
3.4 |
3 |
3 |
0.1 |
0.1 |
0.2 |
1 |
0.8 |
1 |
3.5 |
2.9 |
3.1 |
4.4 |
3.8 |
4.1 |
3.7 |
3.1 |
3.3 |
8.1 |
6.9 |
7.3 |
|
Centre* |
0.3 |
0.9 |
0.2 |
0.7 |
1.5 |
1.1 |
0.3 |
0.1 |
0.2 |
3.5 |
1.3 |
1.4 |
0.7 |
0.9 |
0.4 |
4.2 |
2.8 |
2.5 |
4.9 |
3.8 |
2.9 |
|
All states + Centre* |
3.7 |
3.9 |
3.2 |
0.9 |
1.6 |
1.3 |
1.3 |
0.9 |
1.2 |
7 |
4.3 |
4.5 |
5 |
4.8 |
4.5 |
7.9 |
5.9 |
5.8 |
12.9 |
10.7 |
10.3 |
|
All states' average** |
4 |
3.4 |
3.5 |
0.2 |
0.2 |
0.2 |
1.2 |
0.9 |
1.2 |
4.3 |
3.2 |
3.3 |
5.2 |
4.3 |
4.6 |
4.5 |
3.4 |
3.5 |
9.7 |
7.7 |
8.2 |
Notes: (i) GSDP for 2011-12 and 2015-16 are at current prices in 2011-12 National Accounts Statistics (NAS) Series, whereas GSDP for 1987-88 are at current prices in 2004-05 NAS Series.
(ii) *These numbers are expressed in percentage of GDP.
(iii) ** All states’ averages are expressed in percentage of GSDP.
(iv) ***West Bengal’s GSDP for 2015-16 are collected from State Budget Speech, and 2011-12 GSDP is at current prices in 2004-05 NAS Series.
Discussion
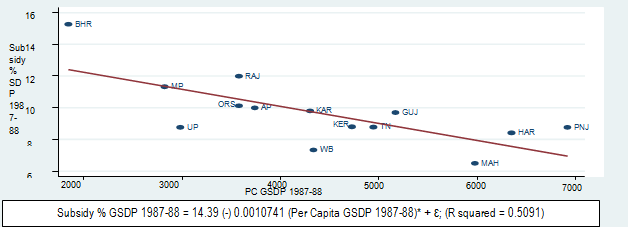
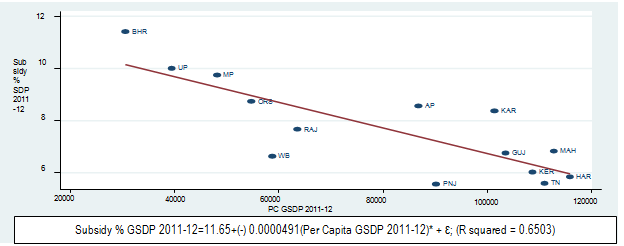
There is a robust inverse relationship between the incidence of subsidies and per capita income. Comparing across states, this inverse relationship is statistically significant at 1% level3, and has persisted for nearly 30 years (Figure 1). This cross-section4 regression result is consistent with the decline in incidence of subsidies with rising per capita income (GDP) observed longitudinally from 1987-88 to 2015-16 at the all India level. It is also evident in longitudinal comparisons for most states. The incidence of subsidies was higher in 2015-16 compared to 1987-88 in only two states, namely, Uttar Pradesh and Madhya Pradesh5.
The equation in Figure 1 provides a basis for estimating the expected level of subsidy incidence for a given level of per capita GSDP. In some states, the incidence of subsidies is much higher than the expected level. These include Uttar Pradesh, Madhya Pradesh, Andhra Pradesh, and Karnataka. Conversely, subsidy incidence is much lower than the expected level in West Bengal, Punjab, and Tamil Nadu. In Bihar, which still has the highest incidence of subsidies, this was much higher than the expected norm in 1987-88, and in 2011-12. But it had come down to the expected level by 2015-16.
Figure 1. Relationship between subsidy (% of GSDP) and per capita GSDP
Panel 1: 1987-88
Panel 2: 2011-12
Panel 3: 2015-16
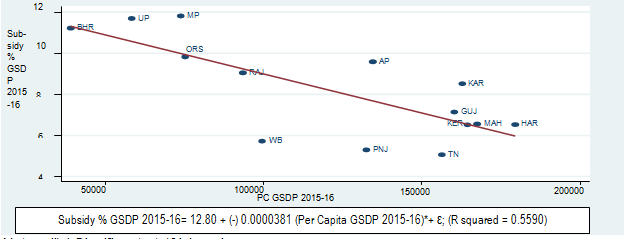
Notes: (i) * Significant at 1% Level.
(ii) State codes: AP-Andhra Pradesh (Telangana); BHR-Bihar (includes Jharkhand); GUJ-Gujarat; HAR-Haryana; KAR-Karnataka; KER-Kerala; MP-Madhya Pradesh (includes Chhattisgarh); MAH-Maharashtra; ORS-Orissa; PNJ-Punjab; RAJ-Rajasthan; TN-Tamil Nadu; UP-Uttar Pradesh (includes Uttarakhand); WB-West Bengal
Not all subsidies are undesirable. For some goods and services, the social benefit of private consumption exceeds the private benefit, for example, basic education. For such items, a subsidy is socially desirable to induce private consumption beyond the level dictated by the private cost-benefit calculus at market prices. Such goods and services with positive externalities are called merit goods or collective goods, and the subsidies provided to induce their consumption may be described as merit subsidies. Such merit subsidies should be identified conservatively. Otherwise, a positive externality can be claimed for virtually any good or service to justify a subsidy. In this post, the list of merit subsidies has been limited to subsidies for primary and secondary education, health services, and food. All other subsidies are treated as non-merit subsidies.
The distribution of merit and non-merit subsidies at central, state, and all government levels has been presented in Table 1. The incidence of merit subsidies has remained about the same at 4.5% of GDP (2015-16) as compared to 4.6% in 1987-88. The incidence of non-merit subsidies declined from 8.3% of GDP in 1987-88 to 5.7% in 2015-16, but these still account for over half of total subsidies. The bulk of these non-merit subsidies are in economic services (4.5% of GDP), and most of these are provided at the state level (4.1% of GDP).
Notes:
- Subsidies for elementary and secondary education, food distribution, and water supply and sanitation have been treated as merit subsidies. Subsidies for all other economic and social services have been treated as non-merit subsidies.
- This two-part series has been extracted from Mundle and Sikdar (2020).
- The significance level is the probability of rejecting the null hypothesis when it is true. A significance level of 1% indicates a 1% risk of concluding that a difference exists when there is no actual difference.
- Cross-section refers to data at a specific point in time.
- For details, see Mundle and Sikdar (2020).
Further Reading
- Government of India (2018), ‘Indian Public Finance Statistics 2016-17’, Ministry of Finance, Department of Economic Affairs, Economic Division, May 2018.
- Mundle, Sudipto and Satadru Sikdar (2020), “Subsidies, Merit Goods and the Fiscal Space for Reviving Growth: An Aspect of Public Expenditure in India”, Economic & Political Weekly, 1 February, 55(5):52-60.
- Mundle, Sudipto and M Govinda Rao (1991), “Volume and Composition of Government Subsidies in India, 1987-88”, Economic & Political Weekly, 4 May, 26(18):1157-11

Comments will be held for moderation. Your contact information will not be made public.