

 10 May, 2019


While rural electrification has been a high priority for governments in the developing world, the factors that make individual households more likely to pay for electricity have received insufficient attention. Using data on rural households from six Indian states, this article finds that service quality has a substantial impact on willingness to pay for connections, which is critical for improving access.
Does the quality of electricity affect households’ willingness to pay (WTP) for it, and if so, how? On the one hand, households might consider their local electricity service adequate but too expensive. On the other, households might be willing and able to pay for service but choose not to do so because the quality of service does not meet their needs. We seek to answer these questions using data from a detailed 2014-2015 survey of rural households across six states in India (Kennedy, Mahajan, and Urpelainen 2019).
Quality of service in times of rapid rural electrification
The Indian government’s Saubhagya scheme, launched in September 2017, aims to provide all rural and poor urban households with free electricity connections. One year ago, the government announced its success in achieving universal village electrification. To date, government statistics indicate that fewer than 19,000 of the 26.3 million households targeted as non-electrified at the onset of the programme still lack electricity .
Despite this impressive progress, millions of households still do not have access to power. Research in rural Uttar Pradesh by the Institute for Sustainable Electricity Policy (ISEP) sheds light on this discrepancy. Some households were simply missed by rural electrification teams, who failed to offer them connections. Others obtained electricity through illegal connections, which the electrification teams ignored.
Most importantly, ISEP found that the government ignored households that were unwilling to pay their electricity bills (Urpelainen 2019). With low demand for electricity among rural households (Smart Power India, 2019), millions of households may have been excluded.
What explains households’ unwillingness to obtain legal electricity connections? First, the quality of electricity available to rural households in North India remains unsatisfactory (Jain et al. 2018). Additionally, many poor households given free electricity connections still find the monthly electricity bills and meter fees unaffordable.
Is it the high cost of electricity that deters consumers or its low quality? As opposed to previous research (Alkon, Harish and Urpelainen 2016, Rahman et al. 2013, Riley 2014, Winkler et al. 2011), our work seeks to disentangle these two effects by understanding how the quality of electricity service affects consumers’ WTP for it.
Households’ self-selection into those with and without connections
To conduct the study, we rely on the 2014-2015 ACCESS (Access to Clean Cooking Energy and Electricity: Survey of States) survey with data from 8,500 households across 714 villages and six states in India (Aklin et al. 2016).
The dataset includes each non-electrified household head’s WTP for a grid connection, which serves as our dependent variable1. The explanatory variable of interest is the average quality of electricity available to connected households in the village. We also control for several characteristics that affect households’ WTP for electricity connections2.
Using survey data to understand the relationship between the quality of electricity and households’ WTP for it poses a challenge, because it cannot reveal how much electrified households would be willing to pay for an electricity connection at the time the survey is conducted. At best, responses from electrified households only reveal how much they would be willing to pay for an electricity connection if they did not already have a connection.3
Households in places where the quality of service is high are also likely to pay for connections, so it is no longer possible to gauge their WTP. As a result, data on households’ WTP was only collected from non-electrified households. Simply relying on their responses, however, introduces selection bias.4 Compared to the entire sample of connected and unconnected households, those that report their WTP for electricity are more likely to live in villages with poor quality of electricity supply. As a result, inferences drawn from these observations describe behaviour in villages with poor-quality electricity rather than the entire sample of villages.
To correct for this bias, we first predict whether the household does not have grid electricity based on the size of the natural village in which the household is located. All else held equal, the size of a household’s natural village is unrelated to other characteristics affecting its WTP for electricity. Then, from the set of households without grid electricity, we compare the WTP among households with similar predicted probabilities of having grid electricity, based on the size of their natural villages.5
Quality of service affects households’ willingness to pay
We find that high-quality electricity service significantly affects households’ WTP. Figure 1 illustrates the relationship between the quality of electricity available in a village and households’ WTP, using three models.6
Moving clockwise from the top-left, the first measures quality on the basis of total hours of electricity available during a typical 24-hour period; the second on the basis of night-time hours typically available between sunset and midnight; and the third on the basis of a quality index, ranging from 0-1, which incorporates total hours, nightly hours, and the typical monthly frequency of electricity outages and voltage fluctuations that damage electrical equipment. The quality metrics are self-reported by connected households and then aggregated to the village-level.
The figure illustrates the positive relationship, in all three models, between quality and households’ WTP for connections. A one-hour increase in a village’s total and night-time hours increases households’ WTP by approximately 13% and 34%, respectively. Similarly, an increase in the quality scale by 1/10th of a point increases WTP by nearly 50%.
Figure 1. Effect of electricity quality on willingness to pay, using three different measures of quality
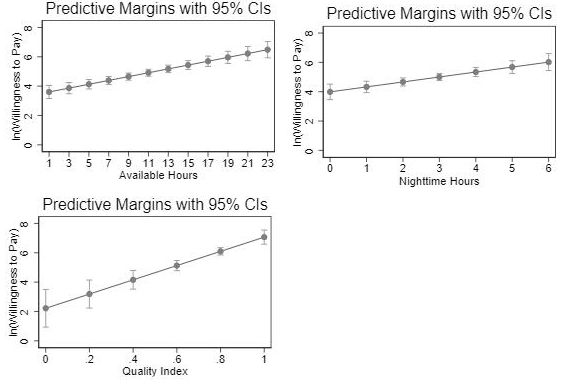
Note: Figure shows linear prediction and 95% confidence intervals7 (CIs) for the effect of electricity reliability on WTP.
We can also consider the monetary effects of improving quality, noting that the average non-electrified household reports a WTP of Rs. 399 (US$6.18) for a connection. A one-hour increase in total and night-time hours available increases this by about Rs. 52 (US$0.81) and Rs. 136 (US$2.12), respectively. A 1/10th point increase in quality increases WTP by about Rs. 192 (US$ 3).
Improving the quality of service is essential
Many of India's problems with rural electrification stem from the poor financial performance of electricity distribution companies (Joseph 2010, Santhakumar 2008). In part, their performance is the product of the country’s electrification efforts, which have focused on subsidising prices to increase connectivity rather than investing in service quality or targeting communities with high WTP (Palit and Bandyopadhyay 2017).
Our results suggest that Indian policymakers can set off a ‘virtuous cycle’ by improving the quality of service. Doing so would increase demand for electricity, inducing more households to connect at higher prices. In turn, this would allow distribution companies to recover their real cost of generating, transmitting, and distributing electricity, which would help pay for those improvements.
Notes:
- Dependent variable is the variable which is explained in a regression model, whose value depends on the values of one or more other variables, called the independent or explanatory variables.
- We include state fixed effects and control for the log-transform of households’ kerosene expenditures and distance from the nearest town, and binary variables indicating whether household heads hold 10thyear or greater education (equivalent to 1st-10th grades) and whether they come from historically disadvantaged groups (‘backward caste’).
- While electrified households’ decisions about whether to purchase electricity can provide some information about their willingness to pay for a connection, it only provides a lower bound because the electricity is subsidised and can be purchased at below-market prices. Additionally, because the cost of obtaining an electricity connection varies over time and across geography, households with connections may have chosen to do so in response to different costs than those currently faced by non-electrified households.
- Selection bias occurs when the selection of observations from a population is not random, and is therefore unrepresentative of the population.
- In other words, we use a two-step Heckman selection model wherein we first predict whether the household does not have grid electricity (selection stage) and then, conditional on not having it, how much they would be willing to pay for it. We use the log-transformed habitation (natural village) size as an ‘instrumental variable’ in the first stage, as it is conditionally independent of WTP for an electricity connection.
- Because WTP data is skewed, we rely on the log-transform so that it better meets statistical assumptions of normality.
- A 95% confidence interval is a way of expressing uncertainty about estimated effects. Specifically, it means that if you were to repeat the experiment over and over with new samples, 95% of the time the calculated confidence interval would contain the true effect.
Further Reading
- Aklin, M, C Cheng, K Ganesan, A Jain, S Ray and J Urpelainen (2016), 'Access to Clean Cooking Energy and Electricity: Survey of States in India (ACCESS)', Harvard Dataverse. Available here.
- Alkon, Meir, SP Harish, Johannes Urpelainen ( 2016), “Household Energy Access and Expenditure in Developing Countries: Evidence from India 1987-2010”, Energy for Sustainable Development, 35: 25–34.
- Government of India (2019), 'Saubhagya: Household Progress from 11 October 2017', Saubhagya Dashboard.
- Jain, A, S Tripathi, S Mani, S Patnaik, T Shahidi and K Ganesan (2018), 'Access to Clean Cooking Energy and Electricity: Survey of States in India (ACCESS)', Report, November 2018.
- Joseph, Kelli L (2010), “The Politics of Power: Electricity Reform in India”, Energy Policy, 38(1): 503–511.
- Kennedy, Ryan, Aseem Mahajan and Johannes Urpelainen ( 2019), “Quality of Service Predicts Willingness to Pay for Household Electricity Connections in Rural India”, Energy Policy, 129: 319–326.
- Palit, Debajit and Kaushik Ranjan Bandyopadhyay (2017), “Rural Electricity Access in India in Retrospect: A Critical Rumination”, Energy Policy, 109: 109–120.
- Rahman, Md Mizanur, Jukka V Paatero, Aditya Poudyal and Risto Lahdelma ( 2013), “Driving and Hindering Factors for Rural Electrification in Developing Countries: Lessons from Bangladesh”, Energy Policy, 61: 840–851.
- Riley, Paul H (2014), “Affordability for Sustainable Energy Development Products”, Applied Energy, 132: 308–316.
- The Rockefeller Foundation, Smart Power India, and Initiative for Sustainable Energy Policy (2019), 'Rural Electrification in India: Customer Behaviour and Demand', February 2019.
- Santhakumar, V (2008), Analysing Social Opposition to Reforms: The Electricity Sector in India, Sage, Thousand Oaks.
- Urpelainen, J (2019), 'Universal Rural Electrification in India? Not So Fast', Power For All, 6 February 2019.
- Winkler, Harald, André Felipe Simões, Emilio Lèbre la Rovere, Mozaharu lalam, Atiq Rahman, and Stanford Mwakasonda (2011), “Access and Affordability of Electricity in Developing Countries”, World Development, 39(6): 1037–1050.

Comments will be held for moderation. Your contact information will not be made public.