What were the effects of the 2016 Indian demonetisation that removed 86% of currency in circulation overnight, on the production side of the economy? By combining data from financial statements and surveys of firms and workers, this article finds that firms that use cash more and obtain larger shares of labour or material inputs from the informal sector, experienced declines in these input shares after demonetisation. Further, casual labourers were more likely to report being unemployed post demonetisation.
Despite advances in payment technologies, paper currency continues to be widely used in developed and developing countries alike. Not just households, but even businesses may hold cash to pay for inputs like labour and materials. This is reminiscent of countries with a large informal sector1. Formal enterprises depend on the informal sector for agricultural inputs and informal labour that are typically paid for in cash, mainly because suppliers of these inputs do not use or even have bank accounts. In such environments, cash plays an important role in overcoming the transactional friction.
On 8 November 2016, Prime Minister Narendra Modi made a surprise announcement on national television stating that the two highest denomination currency notes of Rs. 1,000 and Rs. 500 would no longer be legal tender from the next morning onwards. The government’s stated policy objectives of fighting corruption and rooting out black money warranted the surprise nature of the announcement. Additionally, to maintain secrecy, the new notes were not printed ahead of time. The printing and distributing constraints slowed down the process of introducing the new Rs. 500 and Rs. 2,000 currency notes into the economy.
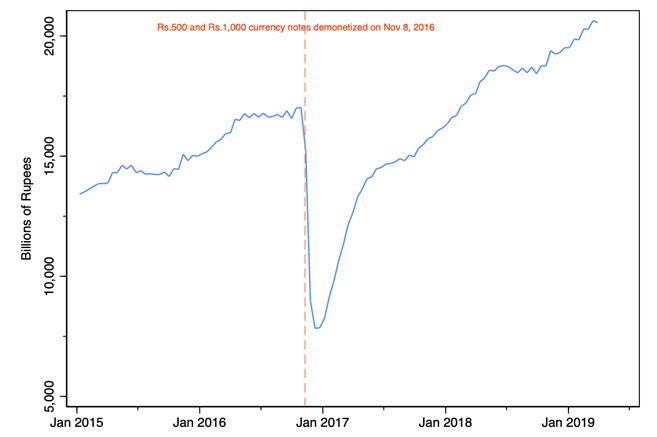
At the time, the demonetised notes accounted for 86% of currency in circulation. Figure 1 shows the time path of currency in circulation. The sharp drop after the announcement is followed by a prolonged decline in the supply of currency in the months that followed. Given that India is a cash-heavy economy2, a shock of such a large magnitude was bound to have some devastating consequences.
Figure 1. Currency in circulation

Source: Database of Indian Economy, Reserve Bank of India.
Note: Dashed line indicates the date of the announcement of demonetisation.
Estimating the supply-side effects of demonetisation
In recent research (Subramaniam 2020), I exploit cross-sectional variation (across observations in the same time period) in firm and industry characteristics that correlate with cash usage and exposure to the informal sector, to unpack the supply-side consequences of demonetisation on the economy. I study the near-term supply-side effects by merging firm financial statements with industry-level measures of cash usage, as well as industry- and firm-level measures of dependence on informally sourced labour and materials, respectively.3 These measures come from national surveys of firms, workers, and informal enterprises, administered before the demonetisation episode. Firms with varying degrees of exposure to informality were affected differentially by demonetisation. This cross-sectional variation helps unpack the causal effect of the shock on firm-level inputs by naturally producing firms that were treated with different intensity.4
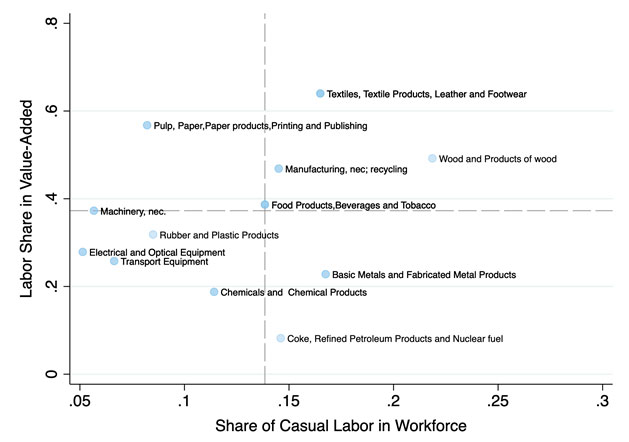
India is characterised by a large informal sector and the formal sector is highly dependent on it for inputs. A vast majority of India’s labour comprises informal workers. Figure 2 plots the share of casual (or informal) labour employed in the total workforce against labour intensity, as measured by the labour share in value-added for industries as classified in the KLEMS (capital, labour, energy, materials, and service) India Database, 2015-16. In general, more labour-intensive industries tend to tap into the informal labour market as it is cheaper to hire and fire these workers. Formal firms are also heavily reliant on the informal sector for inputs, such as agricultural inputs, that are typically paid for in cash, and were hence relatively more hurt following demonetisation.
Firms witnessed declines in labour and materials after demonetisation
I find that firms that use more cash faced significant declines in their labour and materials share in value-added in the two quarters after demonetisation. A one standard deviation5 increase in cash usage6 is associated with a 1.6 percentage-point decline in labour share in value-added and a 1.5 percentage-point decline in materials share in value-added.
Next, I construct measures of exposure to informality at the firm and industry level to explore the mechanism that explains these declines. I find that firms that were relatively more reliant on informal employees faced larger declines in their labour share in value-added in the period after the shock. Using an index that captures exposure to the informal sector based on the products used by firms and production by informal enterprises vis-à-vis total production, I find that firms that were more exposed to the informal sector faced larger declines in their materials share in value-added in the period after the shock.
Lastly, I use a household panel to study whether the employment experience for ‘informal-type’ workers was significantly different than ‘formal-type’ workers. Using information from the survey on the nature of occupation, I classify each worker as informal-type or formal-type. I find that informal-type workers were more likely to report being unemployed relative to formal-type workers in the months following demonetisation. These results on employment status from the worker-side corroborate my findings for labour input from the firm-level data.7
Demonetisation is primarily viewed as a demand shock (or a liquidity shock). However, cash is also used by firms to purchase inputs that go into production. For example, agricultural labour is traditionally paid in cash; firms and contractors may need to pay informal workers in cash; and suppliers of informal materials such as agricultural inputs are compensated in cash as they do not have or use bank accounts. To that end, demonetisation can be thought of as an aggregate supply shock.
Figure 2. Labour intensity and use of casual labour, by industry

Note: Dashed lines indicate median values.
Source: Author’s calculations using KLEMS India Database, 2011-12.
Why do we not see the effects of demonetisation in aggregate GDP data?
When we look at aggregate GDP (gross domestic product) data, we do not observe the full impact of demonetisation for two reasons. First, GDP is not measured, but estimated, for the informal sector using surveys that are carried out every few years. Hence, GDP may potentially overestimate economic activity. Second, due to the nature of the shock, a large shift from cash-based transactions to electronic payments could cause a moderate rise in formal-sector GDP, further creating additional measurement issues. These two reasons make it difficult to identify the causal effects of demonetisation using aggregates. If anything, official GDP data shows a slight uptick during that period, whereas in the months after the initial announcement there were news reports and anecdotal evidence of worker layoffs and job losses in the informal sector. These are at odds with one another.
Conclusion
Taken together, the results from this paper document significant supply-side effects of demonetisation in the near term. These results are an underestimate of the true effects because high-frequency data is available only for the formal sector. Needless to say, the informal sector bore the brunt of the shock. While other economists have focused on the cross-section of districts in India to unpack the effects of demonetisation (Chodorow-Reich et al. 2020), and have found a two-percentage point contraction in employment and output, my results speak to these aggregate findings using the cross-section of firms and industries. While the predominant channel in the aforementioned study is demand, my findings suggest a supply channel to have been operative as well.
Finally, my research focuses only on the near-term impacts of demonetisation. While there may be long-term benefits from moving away from cash, using digital payments, and improvements in tax compliance, it is less clear if these benefits justify the costs, especially given that our current estimates of the costs of demonetisation are a lower bound of the true effects.
Notes
- The informal sector or unorganised sector comprises firms that are not registered. The exact definition of varies from country to country.
- In 2012, India’s cash-GDP ratio stood at about 12%, while for comparable countries like Brazil, Mexico, and South Africa, that number was about 3-6%.
- For firm financial statements, I use the Prowess database; and for employment data, I use the Consumer Pyramids dataset. Both are compiled by the Centre for Monitoring the Indian Economy (CMIE).
- The econometric specification used is a simple difference-in-differences model where the regressors are time-invariant, and are taken from survey data before the demonetisation episode, such as the Annual Survey of Industries and the National Sample Survey.
- Standard deviation is a measure that is used to quantify the amount of variation or dispersion of a set of values from the mean value (average) of that set.
- Proxies for industry cash usage include the share of cash in current assets, and the share of cash in total input costs, where inputs are labour and materials.
- I control for firm size, demand, and profitability; account for unobserved variation at the firm-level; and use controls for seasonality.
Further Reading
- Chodorow-Reich, Gabriel, Gita Gopinath, Prachi Mishra and Abhinav Narayanan (2020), “Cash and the economy: Evidence from India’s demonetization”, The Quarterly Journal of Economics, 135(1):57-103.
- Ministry of Finance (2017), ‘Economic Outlook and Policy Challenges’, in Economic Survey 2016-17, Volume I, pg. 69.
- Subramaniam, G (2020), ‘The Supply-Side Effects of India’s Demonetization’, Working Paper.


 03 July, 2020


Comments will be held for moderation. Your contact information will not be made public.