

 24 March, 2021


A majority of borrowing in rural households in developing countries is from informal lenders. This article examines the relationship between these informal lenders and banks in rural India, from the early 2000s onwards. It shows that informal moneylenders rely on credit from banks to ease their own lending capital constraints. Hence, rather than competing with informal moneylenders, banks effectively collaborate with them.
Moneylenders have long been dominant in rural credit markets in India, gaining notoriety for the high interest rates that they charge, and their coercive recovery practices. In 1954, driven by concern that high-interest debt would lead to persistent poverty, the RBI (Reserve Bank of India) explicitly sought to expand access to formal credit to compete with the moneylender and put “him in his place” (RBI, 1954). However, over 60 years later, informal moneylenders continue to thrive, with rural household borrowing from formal and informal sources both having doubled over the last three decades.1
Given their coexistence, understanding the nature of the relationship between the formal and informal credit sectors is important for a proper assessment of the impact of related policies. The two sectors might either interact ‘horizontally’ by competing with each other (see for example, Giné 2011, Jain 1999) or ‘vertically’, with informal lenders acting as middlemen that on-lend formal credit (see for example, Floro and Ray 1997, Hoff and Stiglitz 1998). In recent research, I revisit this debate in the context of rural India, from the early 2000s onwards (Surendra 2020).
To do this, I use household data from the National Sample Survey (NSS) All-India Debt and Investment surveys (2001-02, 2002-03, 2011-12, 2012-13) and moneylender data from the NSS Unincorporated Non-Agricultural Enterprise Surveys (2015-16, 2010-11). I supplement this with data from a primary phone survey conducted, as part of this research, of 140 moneylenders operating across 30 villages in the south Indian state of Telangana, referencing lending practices in 2019.
The moneylending market in rural India
Multiple moneylenders operate in segmented local credit markets in rural India, with individuals largely borrowing from moneylenders connected to their local networks (which relate to caste and class).2 Moneylenders charge interest rates of 40% per year, on average, and deter default by employing coercive enforcement mechanisms. While moneylenders extend loans from their business revenue and wealth or savings, they also rely on loans from other informal lenders or banks for lending capital (Figure 1). In fact, the average moneylender that borrows from banks, borrows 45% of all credit that they advanced from banks. The moneylenders I surveyed in Telangana corroborate this: they report borrowing from banks or other informal lenders to on-lend, particularly when faced with a shortfall in lending capital. This relationship also allows moneylenders to arbitrage across the formal and informal sectors, since formal loans come at lower interest rates of around 12% a year.
Figure 1. Sources of lending capital of moneylenders
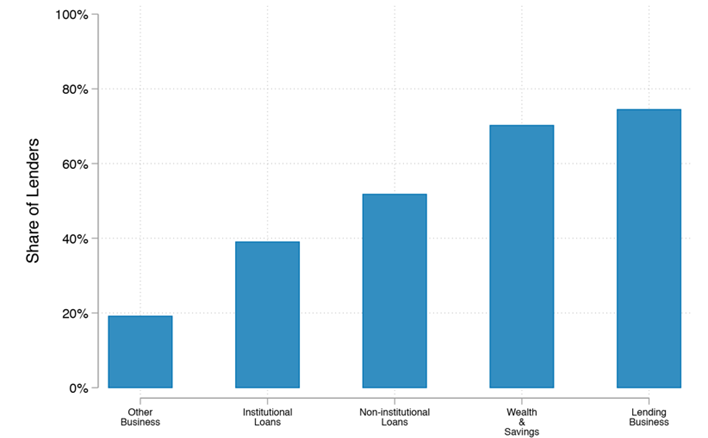
Source: Primary survey, Telangana (2020).
Household credit demand and moneylenders’ borrowing
To investigate the ‘vertical’ link between banks and moneylenders further, I turn to nationally representative survey data on households and moneylenders. Moneylenders are likely to face shortfalls in lending capital when there is an unanticipated increase in the demand for credit by rural households. I argue that an ‘exogenous’ increase in monsoon rainfall may lead to such an increase in demand.
This approach relies on the relationship between monsoon rainfall and incomes in rural India, where a large number of households are engaged in agriculture and see better harvests in years with good monsoon rainfall. This increase in monsoon rainfall thus leads to an increase in incomes which could, in turn, impact households’ demand for credit.3 Intuitively, one might expect a decrease in incomes following a drought to increase rural household borrowing. While household borrowing does go up following a drought, it goes up a lot more following a good monsoon (Figure 2). I use this ‘positive rainfall shock’ to show that moneylenders themselves borrow more when there is a sudden increase in demand for credit by households.
Figure 2. Rainfall shocks and rural households’ borrowing
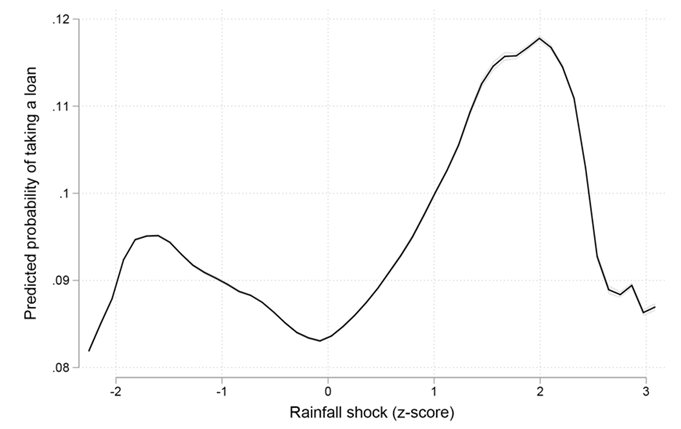
Note: (i) The horizontal axis represents the magnitude of the monsoon rainfall shock, which is defined as the deviation of the actual monsoon rainfall in a given year from its historical 50-year average, expressed in terms of the number of standard deviations. (ii) The vertical axis is the predicted probability that a household borrows from moneylenders in a given year.
Source: NSS Debt and Investment Surveys 2001-02, 2002-03, 2011-12, 2012-13.
Increased households’ borrowing in response to a good monsoon is accompanied by an increase in the interest rates at which loans are transacted. The higher interest rates are not driven by a change in the composition of borrowers, indicating that there is indeed a net increase in the demand for credit. In these instances, I find that households borrow to finance lumpy expenditures (such as purchases of durable goods), particularly when they lack savings. This is consistent with households’ borrowing more to improve their standard of living, as found in anthropological accounts of households’ relationships with debt and credit (for example, Guérin et al. 2011).
Contemporaneous with this increase in households’ demand for credit, moneylenders themselves borrow more from banks: a one-standard deviation increase in monsoon rainfall in a non-drought year increases households’ borrowing from moneylenders by 19% and increases moneylenders’ borrowing from banks by 31%. Finally, the finding that moneylenders themselves borrow more from banks following an increase in rural incomes suggests that the higher volumes of loans being transacted is not driven solely by any increases in moneylenders’ supply of capital.
Figure 3. Households’ borrowing from moneylenders and moneylenders’ borrowing from banks
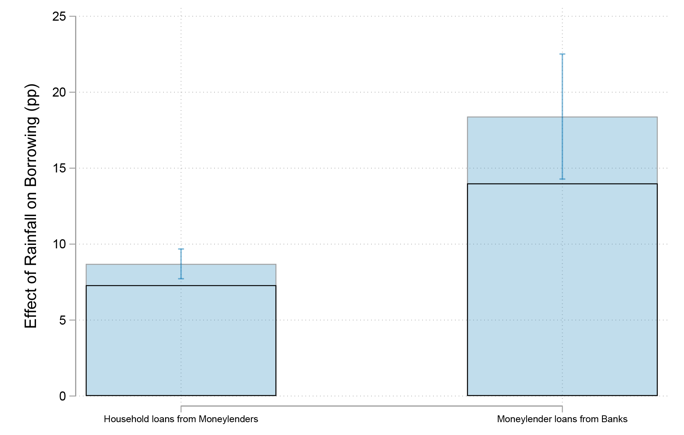
Note: (i) The vertical axis represents the incidence of borrowing, in percentage points. (ii) The first set of bars is households’ borrowing from moneylenders, while the second is moneylenders’ borrowing from banks. (iii) The black-outline bars represent borrowing in a year with average monsoon rainfall, while the blue solid bars represent the borrowing following a one-standard deviation increase in monsoon rainfall. (iv) The effect of the positive rainfall shock in percentage points is the difference between the blue bar and the black-outline bar. The blue error bars represent the 95% confidence interval. A 95% confidence interval is a way of expressing uncertainty about estimated effects. Specifically, it means that if you were to repeat the experiment over and over with new samples, 95% of the time the calculated confidence interval would contain the true effect. (v) The graph shows that 8.7% of households borrow following the positive rainfall shock, while 7.3% of households borrow on average. So, the 1.4 percentage point change in the graph is a (8.7 – 7.3)/7.3 = 19% change. For moneylenders, 18.4% of lenders borrow from banks following the positive rainfall shock, while 14% borrow on average. So, the 4.4 percentage point increase in the graph is a (18.4 – 14)/14 = 31% change.
Source: NSS Debt and Investment Surveys 2001-02, 2002-03, 2011-12, 2012-13; NSS Informal Enterprise Surveys 2015-16, 2010-11.
Impact of the moneylender-bank interaction on rural households
Due to these moneylender-bank interactions, it is plausible that changes in the supply of bank credit could affect households indirectly through the moneylending market. I study this by comparing the effect of a rainfall-induced increase in households’ credit demand in districts with high supply of bank credit to that in districts with low supply of bank credit. Since the actual credit transacted depends both on what banks want to lend and on what borrowers want to borrow (that is, credit transacted is an equilibrium quantity), this comparison requires constructing a measure of the supply of bank credit alone.4 To do this, I remove the influence of demand-specific factors – such as district characteristics, purpose for which a loan is taken, or the population group that a borrower belongs to – from the total credit transacted, and predict the supply of bank credit.5 I designate districts as having high supply of bank credit when predicted bank credit is above the median, and as having low supply of bank credit when it is below the median.
Districts with high supply of bank credit see 23% more households’ borrowing from moneylenders than districts with low supply of bank credit, following a one-standard deviation increase in rainfall in non-drought years. However, households that would ordinarily borrow in the moneylender market are not entirely without options when the supply of bank credit is low. They can partially substitute interest-bearing moneylender loans with interest-free loans from friends or relatives (when the supply of bank credit is low, around 40% of loans that would otherwise have been from moneylenders are from friends or relatives). This confirms that the increased borrowing from moneylenders in districts with high supply of bank credit is driven by the supply of moneylenders’ loans, and not households’ credit demand. This also demonstrates that the supply of bank credit impacts lending in the moneylender market, in addition to that in the formal credit market.
Concluding remarks
These findings help explain the persistence of moneylenders in the rural credit landscape, since rather than competing with informal moneylenders, banks end up collaborating with them inadvertently. For several rural borrowers, loans from moneylenders remain easier to access and offer greater flexibility than bank loans. However, moneylenders also wield considerable market power and rely on coercive enforcement mechanisms. Thus, there is potential to make rural households better off by improving the availability of non-agricultural credit in particular.
I4I is now on Telegram. Please click here (@Ideas4India) to subscribe to our channel for quick updates on our content.
Notes:
- Based on National Sample Survey (NSS) All-India Debt and Investment surveys in 1991-92 and 2012-13, and the NABARD (National Bank for Agriculture and Rural Development) All-India Rural Financial Inclusion Survey (NAFIS) survey in 2016-2017.
- Also see Hoff and Stiglitz 1998.
- A one-standard deviation increase in monsoon rainfall increases district GDP (gross domestic product) by 1%. The relationship between rainfall and incomes (or agricultural productivity) is also established in Emerick 2018, Jacoby and Skoufias 1998, Jayachandran 2006, Kaur 2019, Paxson 1992, and Wolpin 1982. Standard deviation is a measure that is used to quantify the amount of variation or dispersion of a set of values from the average of that set.
- These data are made available by the RBI aggregated to the loan type × population group × bank group level for a district in a given year. A bank group is a group of banks and there are five bank groups – State Bank of India and its associates, nationalised banks, other public sector banks, foreign banks, and private banks. Loan type indicates the loan purpose for personal loans, and the industry otherwise. Population groups are urban, rural, semi-urban, and metropolitan.
- I use a ‘shift-share’ instrument to predict bank credit supply in a district in a given year (see, for example, Greenstone et al. 2020). Growth in credit between consecutive years is decomposed into loan type, population group, district and bank group components using a linear regression. This yields a predicted bank group-specific growth in credit, and is the ‘shift’. The ‘share’ is a bank-group’s pre-period market share in a given district. The ‘shift-share’ for credit supplied in a district is the weighted average credit growth across bank-groups, using the shares as weights.
Further Reading
- Emerick, Kyle (2018), “Agricultural productivity and the sectoral reallocation of labor in rural India”, Journal of Development Economics, 135: 488-503.
- Floro, Maria Sagario and Debraj Ray (1997), “Vertical Links Between Formal and Informal Financial Institutions”, Review of Development Economics, 1(1): 34-56.
- Giné, Xavier (2011), “Access to Capital in Rural Thailand: An Estimated Model of Formal vs. Informal Credit”, Journal of Development Economics, 96(1): 16-29.
- Greenstone, Michael, Alexandre Mas and Hoai-Luu Nguyen (2020), “Do Credit Market Shocks affect the Real Economy? Quasi-Experimental Evidence from the Great Recession and ‘Normal’ Economic Times”, American Economic Journal: Economic Policy, 12(1).
- Guérin, I, M Roesch, G Venkatasubramanian and S Kumar (2011), “The Social Meaning of Over- Indebtedness and Creditworthiness in the Context of Poor Rural South Indian Households (Tamil Nadu)”, Rural Microfinance and Employment (RuMe) Working Paper.
- Hoff, Karla and Joseph Stiglitz (1998), “Moneylenders and Bankers: Price-Increasing Subsidies in a Monopolistically Competitive Market”, Journal of Development Economics, 55(2): 485-518.
- Jacoby, Hanan G and Emmanuel Skoufias (1998), “Testing Theories of Consumption Behavior using Information on Aggregate Shocks: Income Seasonality and Rainfall in Rural India”, American Journal of Agricultural Economics, 80(1): 1-14.
- Jain, Sanjay (1999), “Symbiosis vs. crowding-out: the interaction of formal and informal credit markets in developing countries”, Journal of Development Economics, 59(2): 419-444.
- Jayachandran, Seema (2006), “Selling Labor Low: Wage Responses to Productivity Shocks in Developing Countries”, Journal of Political Economy, 114(3): 538-575.
- Kaur, Supreet (2019), “Nominal Wage Rigidity in Village Labor Markets”, American Economic Review, 109(10): 3585-3616.
- Paxson, Christina H (1992), “Using Weather Variability to Estimate the Response of Savings to Transitory Income in Thailand”, American Economic Review, 82(1): 15-33.
- Reserve Bank of India (1954), ‘All-India Rural Credit Survey: The General Report’, Publication Report.
- Surendra, V (2020), ‘The Moneylender as Middleman: Formal Credit Supply and Informal Loans in Rural India’, Working Paper.
- Wolpin, Kenneth I (1982), “A New Test of the Permanent Income Hypothesis: The Impact of Weather on the Income and Consumption of Farm Households in India”, International Economic Review, 23(3): 583-594.

By: Misha Sharma 04 April, 2021
Interesting and novel finding, Vaishnavi.