

 31 March, 2023


Silicon Valley Bank is the largest bank failure in the US since the 2008 financial crisis. Viral Acharya and Raghuram Rajan reflect on this and attribute the bank’s collapse to more than bankers’ mismanagement. They outline the systemic monetary policy drivers for it, and the bloating of uninsured ‘runnable’ deposits on bank balance sheets in the face of the prolonged quantitative easing during the Covid-19 pandemic. They suggest that regulators should stress-test banks for stagflation to get a true picture of their capitalisation.
The recent bank failures in the United States seem to have an obvious cause: over 90% of the deposits of Silicon Valley Bank (SVB) and Signature Bank were uninsured. Uninsured deposits are understandably prone to runs. Moreover, both banks had invested significant amounts in long-term bonds. So with the rapid rise in interest rates, the value of their bond portfolios fell. When SVB sold some of these bonds to raise funds, the losses embedded in its bond portfolio started coming to light, and an offering of equity failed– setting off the depositor run that led to its closure.
There are four aspects to this simple explanation that suggest the problems may be more systemic. First, there is typically a huge increase in uninsured bank deposits whenever the Fed1 engages in quantitative easing (QE), in which the Fed buys securities from the market in exchange for its own liquid reserves (a form of cash). That QE is associated with not just an increase in the size of the central bank balance sheet, but also an expansion in the banking system’s balance sheet and its uninsured demandable deposits is little appreciated. It is something we (with co-authors) noted in a paper presented at the Federal Reserve’s Jackson Hole conference in August 2022 (Acharya et al. 2023).
As the Fed resumed quantitative easing during the pandemic, uninsured bank deposits went up from about $5.5 trillion at the end of 2019 to over $8 trillion by the first quarter of 2022. Figure 1 shows that this implied a quarterly increase in uninsured deposits of over $300 billion (and close to $900 billion in the first quarter of 2020), as a result of which the share of uninsured deposits in overall deposits grew from below 48% to 53%.
Figure 1: Uninsured deposit growth over QE during the pandemic years
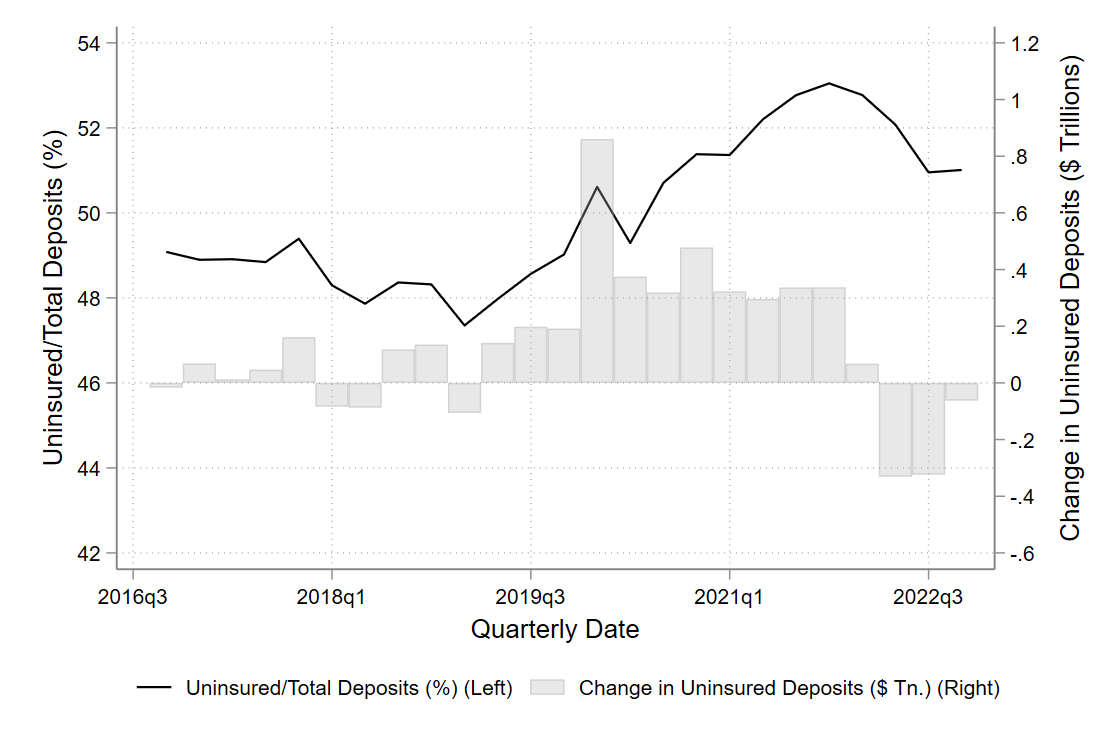
Notes: (i) Line graph shows the growth in the ratio of uninsured deposits to total deposits between 2016Q4 and 2022Q4 on the left-y-axis. (ii) The right-y-axis shows the scale for the bar graph with changes in total uninsured deposits in $ trillions. (iii) Data is sourced from Call Reports.
SVB’s balance sheet mirrored this aggregate phenomenon (Figure 2). Before QE, deposit inflows at SVB in the third quarter of 2019 were less than $5 billion, whereas they averaged $14 billion per quarter during QE. However, once QE ended and switched quickly to quantitative tightening, the flows reversed. SVB started seeing uninsured deposit outflows – no doubt some of it coincident with the downturn in the tech sector, with the bank’s stressed clients starting to draw down deposits.
Figure 2: Silicon Valley Bank’s quarterly change in deposits
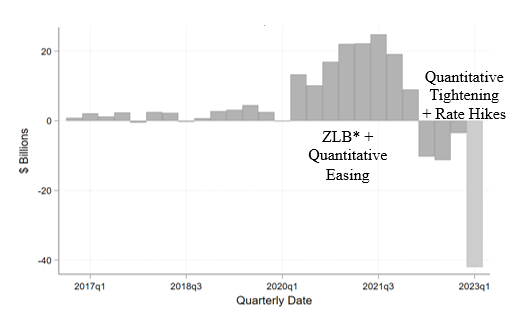
Notes: (i) Graph plots the quarterly change in total deposits of Silicon Valley Bank (SVB Financial Group). (ii) The estimate for 2023Q1 is based on Silicon Valley Bank’s mid-quarter update. (iii) ZLB or Zero Lower Bound refers to a situation when interest rates are zero or near-zero, limiting a central bank’s options to stimulate growth by further cutting rates.
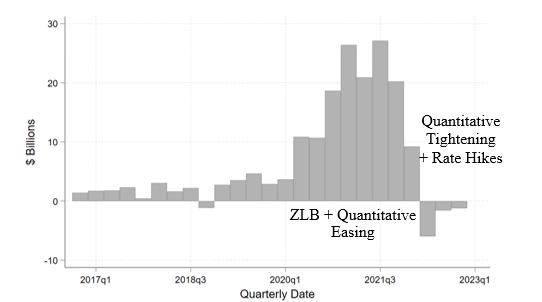
Second, many banks, showered with this firehose of deposits, parked them in liquid longer-term securities such as Treasury bonds and mortgage-backed securities so as to generate a profitable ‘carry2 in the form of an interest rate spread. SVB grew its assets extremely rapidly during QE by between $10 billion to $25 billion per quarter (see Figure 3). Ordinarily, this would not be risky. Long-term interest rates had not moved up much for a long time. As important – even if they did – depositors are usually sleepy and accept low deposit rates for a long time, even when market interest rates move up. Banks felt protected by history and depositor complacency. Yet this time was different: these were flighty uninsured deposits, and they would flow out when the Fed shifted course. Indeed, because large depositors can coordinate more easily, the actions of a few can take more depositors with them. Even at healthy banks, depositors have woken up both to bank risk and the healthy interest rates available at money market funds, and they will want to be compensated with higher interest rates. The juicy interest rate spreads between investments and somnolent deposits that banks enjoyed in the recent past will be threatened, impairing bank profitability and solvency. As the saying in the financial sector goes, “The road to hell is paved with positive carry”.
Figure 3: Silicon Valley Bank’s quarterly change in assets
![]()
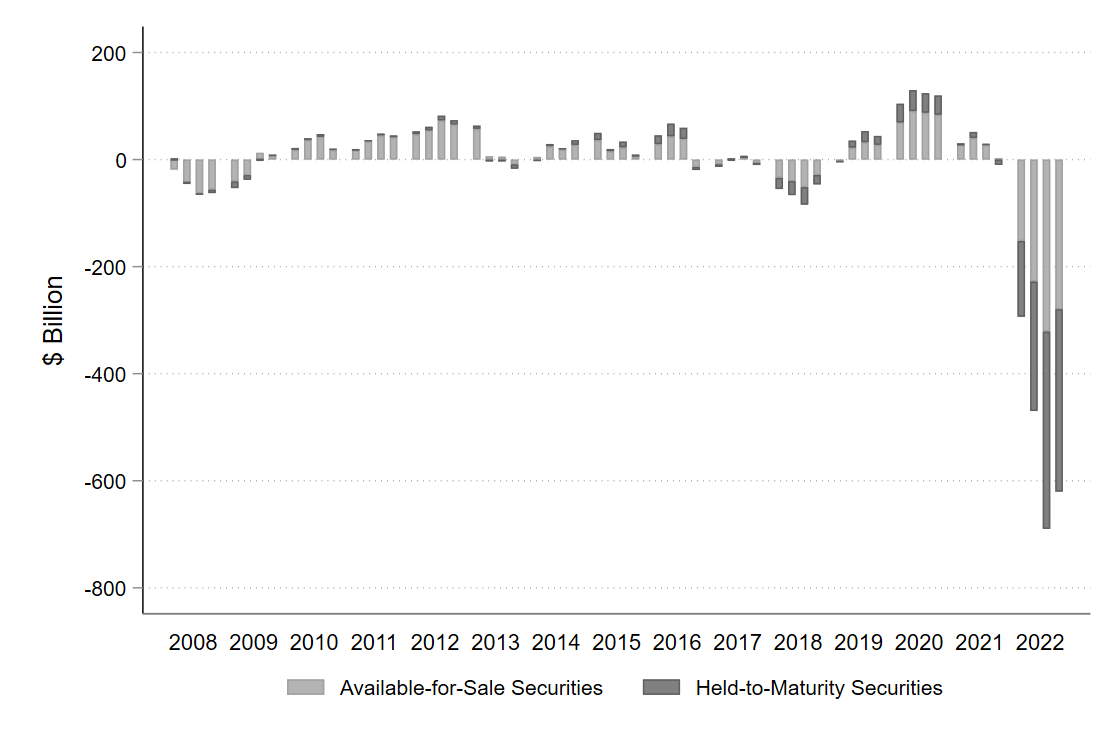
The third concern is that the first two concerns are magnified this time around. When the Fed switched to quantitative tightening and raising rates the last time round (2017-19), the rise in policy rates was less sudden and to a lower level, and the quantity of interest-sensitive securities held by banks was lower. Consequently, the unrealised losses on bank balance sheets then were small (less than $50 billion as seen in Figure 4. There were no depositor runs, though many of the same ingredients were in place.
Figure 4: Unrealised gains on investment securities for insured institutions
![]()
This time, both the quantum of rate rises, their rapidity, and bank holdings of interest-rate sensitive assets are all much larger, with the FDIC3 suggesting losses on available-for-sale (AFS) and held-to-maturity (HTM) bank securities holdings alone are over $600 billion (Figure 4). The capital for many large banks when properly marked (that is, reflecting a theoretical and immediate liquidation value of securities to the extent of each bank’s portion of runnable deposits) would likely be below the comfort zone of 8-10% Common Equity Tier 1 Capital Ratio4, as Figure 5 shows5.
Figure 5: Impact of unrealised securities losses on capital rations
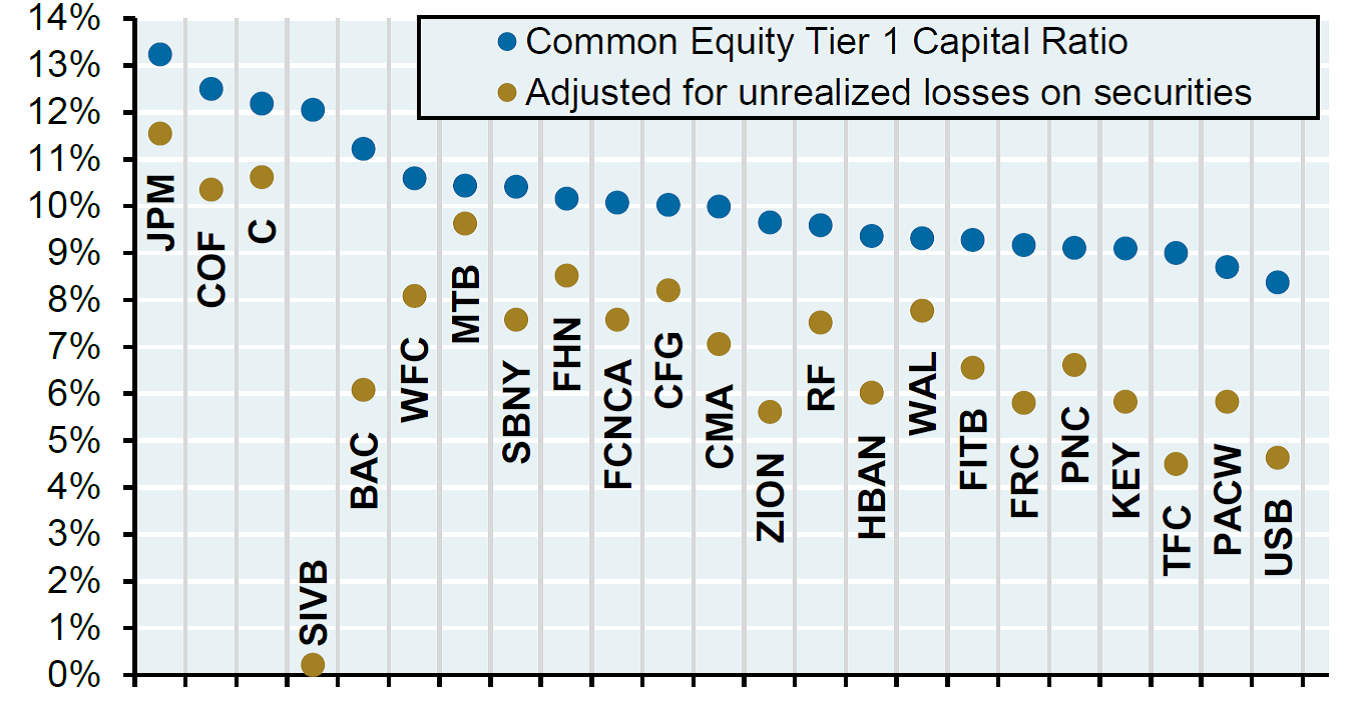
Note: Acronym labels refer to different US banks, and SIVB refers to Silicon Valley Bank
Source: J.P. Morgan Asset Management Q4, 2022 (Cembalest 2023)
The fourth concern is unwitting supervisory coordination. Clearly, too many supervisors did not see the rising bank interest rate exposure, or were unable to force banks to reduce it. The more forceful supervision might have meant (and we still are trying to gauge the extent) that fewer banks would be in trouble today. But supervisors’ closer scrutiny of the largest banks, including through stress tests, without applying similar standards to all banks, may have also caused a migration of risky commercial real estate loans (think, half empty office buildings post the pandemic) from larger, better capitalised banks to relatively weakly-capitalised, small and medium sized banks.
Preparing for further stress: policy implications
The broader point is that the vulnerabilities in the banking system are, no doubt, partly banker created, but the Federal Reserve also created some of the vulnerabilities. Periodic bouts of quantitative easing have expanded bank balance sheets and stuffed them with more uninsured deposits, but reversing QE is much harder because banks have become dependent on the easy liquidity. The larger the scale of QE and the longer its duration, the more time the Fed should take to normalise its balance sheet and, ideally, also interest rates.
Unfortunately, these financial stability concerns conflict with the Fed’s inflation-fighting mandate. Markets now expect rate cuts in a time of significantly-above-target inflation and some observers are calling a halt to quantitative tightening even as the Fed provides liquidity in large quantities once again through the discount window and other channels. If financial sector problems do not slow the economy, such actions could make the fight against inflation more protracted and costly. As it reexamines bank behaviour and supervision in any post-mortem, the Fed cannot afford to ignore the role its own monetary actions, especially QE, played in creating today’s difficult conditions.
Focusing on the present, financial market uncertainty remains high, credit conditions are tightening – both at banks and in capital markets, and several global banks with weak intermediation models appear to be under strain. So what can the Fed (and other regulators) do if confidence continues to erode in the banking system?
One possibility is to employ what worked well in the Summer of 2009 for stabilising the financial system, that is, stress-test the banking system to risks that are germane now (Acharya 2023b):
In currently employed regulatory stress scenarios, economic recessions are associated with low interest rates that boost the value of banks’ securities investments. This is, however, counterfactual at the present juncture. Reflecting reality, the stress scenarios need to feature instead an economic slowdown with a high level of rates and possibly even further hikes which may be essential to arrest above-target inflation. Not just loan losses but also mark-to-market losses on securities should be transparently recognized. Some concession in marking to market could be considered formulaically based on whether the bank has a stable, insured retail deposit base.
Such a stress test could pave way for the regulators to credibly get undercapitalised banks to raise capital and to resolve the decapitalised banks using the regulatory toolkit of mergers, possibly with government assistance.
Finally, risks are spreading to the banking sectors of countries besides the US. So, such a plan could be considered by all central banks and bank regulators wherever such risks of stagflation are high and banks have hidden losses on securities portfolios in the wake of sharp rises in interest rates.
This piece is based on the ProMarket and Project Syndicate pieces dated 28th March 2023.
Notes:
- Federal Reserve Bank, referred as the Fed, is the US central bank.
- Positive or profitable carry is the strategy to invest borrowed capital (here, refers to bank deposits) to make a profit on the difference between interest earned and interest paid.
- The Federal Deposit Insurance Corporation is a US regulator that insures deposits and supervises financial institutions.
- Common Equity Tier 1 (CET1) is a component of Tier 1 capital that is primarily common stock held by a bank or other financial institutions.
- As stated, Tier 1 capital ratios (blue dots in Figure 5) are exaggerated on the higher side due to the high level of unrealised losses in HTM portfolios. As a reminder, however, the adjusted Tier 1 capital methodology (brown dots) is also exaggerated by assuming the entire liquidation of HTM and AFS (Cembalest 2023).
Further reading
- Acharya, Viral V, Rahul S Chauhan, Raghuram Rajan, and Sascha Steffen (2023), ‘Liquidity Dependence and the Waxing and Waning of Central Bank Balance Sheets’, NBER Working Paper Series, Working Paper 31050
- Acharya, Viral V (2023b), ‘The Case for a Stagflation Stress Test’, The Hill, 29 March.
- Cembalest, M (2023), ‘Eye on the Market’, J.P. Morgan, 10 March

Comments will be held for moderation. Your contact information will not be made public.