

 21 June, 2021


India’s national lockdown in 2020, imposed to contain the spread of Covid-19, threw millions of people out of work and sharply reduced earnings for those who remained employed. Based on data from multi-state surveys, Drèze and Somanchi highlight the devastating impact of the pandemic on food security, and make a case for stronger relief measures.
India’s national lockdown in 2020, in response to the Covid-19 crisis, was one of the harshest in the world. It threw millions of people out of work, and sharply reduced earnings for those who remained employed in some fashion. With the collapse of purchasing power and continued restrictions in many areas, the economic crisis continued well after the national lockdown. In addition, there was a severe disruption of public services including nutrition-related services – midday meals, in particular, were discontinued as schools and anganwadis (childcare centres) were closed in most states for a large part of 2020. The provision of non-Covid health services also declined sharply during and after the lockdown – according to the official Health Management Information System (HMIS), April-May 2020 coverage as a proportion of April-May 2019 coverage was only 80% for antenatal care, 74% for child immunisation, and 53% for outpatient attendance – with much lower figures in states like Bihar and Uttar Pradesh.
These setbacks were only partly compensated by relief measures. Foodgrain rations under the public distribution system (PDS) were more or less doubled from April to November 2020; employment generation under the Mahatma Gandhi National Rural Employment Guarantee Act (MNREGA) expanded by nearly 50% compared to the previous year; and some cash transfers were also made, for example, to old-age pensioners and women’s Jan Dhan Yojana (JDY)1 accounts. Some state governments supplemented this national package with relief measures of their own (Khera and Malhotra, forthcoming). For most households, however, these transfers were just a fraction of what they had lost due to the lockdown and ensuing economic crisis.
Official statistics and macroeconomic aggregates do not shed much light on this livelihood crisis. As it happens, however, a large number of household surveys were conducted by independent research institutions and civil society organisations in 2020. A valuable compilation of 76 such surveys is available on the website of the Centre for Sustainable Employment at Azim Premji University (CSE-APU). We use these surveys to assess the food situation in India in 2020 (Drèze and Somanchi 2021a), focussing mainly on multi-state surveys that have a sample size of at least 1,000 and a reasonably clear sampling method (the ‘reference surveys’, henceforth)2.
The reference surveys, by and large, focus on the informal sector of the economy, or sub-groups of it such as slum-dwellers or migrant workers. During the national lockdown, surveys were mainly telephonic, possibly missing the poorest households. We also make occasional reference to findings based on the Consumer Pyramids Household Survey (CPHS) of the Centre for Monitoring Indian Economy (CMIE) – not included in the CSE-APU compilation.
Income and employment
Numerous surveys present evidence of a sharp decline in employment and incomes during the national lockdown, in April-May 2020 – no surprise here3. The Dalberg survey, a large (and largely representative) survey across 15 states, indicates that the proportion of households affected by income reductions was well above 80% in both months, with nearly a quarter of the households earning no income at all. This is consistent with CMIE data – the bottom quartile of the per-capita income distribution in the CPHS sample earned nothing in April and May. Table 1 presents available estimates of average income reduction in different months compared with pre-lockdown levels. Clearly, large income losses persisted well after the national lockdown.
Table 1. Average income reduction from pre-lockdown levels
|
Source |
Reference period (2020) |
Average income reduction (%) |
|
CPHS (CMIE) |
April-May |
42 |
|
Dalberg |
April-May |
56 |
|
CSE-APU (Round 1) |
April-May |
64 |
|
IDinsight+ (Round 1) |
May |
72a |
|
CEP-LSE (Centre for Economic Performance-London School of Economics) |
May-July |
48 |
|
IDinsight+ (Round 2) |
July |
68a |
|
IDinsight+ (Round 3) |
September |
74a |
|
CSE-APU (Round 2) |
September-November |
50 |
Notes: (i) The last column refers to the average income reduction among sample households. For details of the respective samples, see Appendix in Drèze and Somanchi (2021a). (ii) ‘a’ refers to non-agricultural households.
A few of the reference surveys are particularly informative as far as income and employment are concerned. The “IDinsight+” survey, covering roughly 5,000 households in six states, found that the average weekly income of non-agricultural respondents crashed from Rs. 6,858 in March 2020 to Rs. 1,929 in May, and was still around that level in September. The proportion of non-agricultural respondents who reported zero days of work shot up from 7.3% in early March 2020 to 23.6% in the first week of May and was still as high as 16.2% in the first week of September.
The Dalberg survey (47,000 households in 15 states) found that primary income earners of 52% of households were unemployed in May despite having a job before the lockdown, and another 20% were still employed but earning less than before. Urban households were worse hit than rural households – this is corroborated by other surveys. The CEP-LSE survey (8,500 individuals in urban areas of Bihar, Jharkhand, and Uttar Pradesh) also indicates a sharp increase in unemployment – from 1.9% before the lockdown to 15.5% in May-July 2020 among those aged 18-40 years. Average income in the sample dropped by 48%, and the share of income going to the top quartile increased from 64% to 80%, reflecting a sharp rise in pre-existing income inequalities.
The most recent survey with detailed income data, by CSE-APU, found that 19% of informal-sector workers who had a job before the lockdown were unemployed in September-November 2020 (the corresponding figures for men and women were 15% and 22% respectively). The rest, however, had more or less recovered their pre-lockdown earning levels. The fact that employment losses were worse for women than men is corroborated by other surveys 4.
In short, the reference surveys clearly point to large-scale unemployment and massive income losses not only during the national lockdown but throughout the rest of 2020. It is doubtful that income and employment ever regained their pre-lockdown levels before a second wave of the Covid-19 epidemic hit the country in early 20215.
Food insecurity
As one might expect, drastic employment and income declines in 2020 led to a surge in food insecurity. Table 2 presents summary evidence on this from the reference surveys. The different surveys are not strictly comparable, but they clearly point to severe food insecurity during the national lockdown. Even the least alarming estimate, by IDinsight, suggests that a large proportion (26%) of households were eating less than usual at that time. Once again, hardship lasted well beyond the national lockdown. The CSE-APU survey, for instance, found that the proportion of households eating less than before the lockdown, was still as high as 60% in October-December 2020, relative to 77% during the lockdown.
Table 2. Food insecurity
|
Indicator and source |
Reference period (2020)a |
Incidence (%) |
|
Eating less food than before (%) |
||
|
CSE-APU (Round 1) |
April-May |
77 |
|
ActionAid (Round 1) |
May* |
67 |
|
Hunger Watchb |
October |
53c |
|
CSE-APU (Round 2) |
September-November |
60 |
|
Smaller meal size or fewer items in meals (%) |
||
|
PRADAN+ (Round 1) |
April* |
68 |
|
IDinsight+ (Round 1) |
May |
26 |
|
PRADAN+ (Round 2) |
June* |
55 |
|
Gaon Connection |
June-July* |
46 |
|
IDinsight+ (Round 2) |
July |
14 |
|
IDinsight+ (Round 3) |
September |
13 |
|
RCRC (Rapid Rural Community Response) (Rd 2) |
December 2020 - January 2021* |
40 |
|
Fewer meals (%) |
||
|
PRADAN+ (Round 1) |
April* |
50 |
|
PRADAN+ (Round 2) |
June* |
43 |
|
Gaon Connection |
June-July* |
38 |
|
Eating less than two meals a day (%) |
||
|
ActionAid (Round 1) |
May* |
34 |
|
ActionAid (Round 2) |
June* |
19 |
Note: (i) The last column indicates the proportion of affected households (or individuals, in the case of ActionAid) in the sample. For details of the samples, see Appendix in Drèze and Somanchi (2021a). (ii) ’a’ refers to survey period, in cases (flagged with an asterisk) where the reference period for these indicators is not explicit. (ii) ‘b’ refers to samples which focus on particularly vulnerable groups. (iii) ‘c’ refers to cereal (rice and wheat) consumption.
The situation was predictably worse among disadvantaged groups. For instance, ActionAid reported that 35% of nearly 10,000 informal workers (mainly migrants) were eating less than two meals a day in May 2020. Similarly, a survey of approximately 20,000 returning migrant workers in Bihar found that close to 60% were unable to ensure two square meals a day for all members of the family in June 2020, with a similar proportion in July. In September-October 2020, two-thirds of the respondents in the Right to Food Campaign’s “Hunger Watch” survey (adults from India’s poorest households) said that they were eating less nutritious food at that time than before the lockdown – a chilling thought.
The decline in food intake is also evident from CPHS data. Trends in per-capita expenditure (PCE) on selected food items at constant prices are displayed in Figure 1 for three groups – the top quartile, middle half, and bottom quartile of the overall PCE scale6. Expenditure declines were relatively small for cereals (and also pulses – not shown here), but expenditure on nutritious food items such as fruits, eggs, fish, and meat declined dramatically in all groups. Compared to 2019 averages, CPI (consumer price index)-deflated food expenditure in the bottom PCE quartile was just 51% for fruits, 58% for eggs, and 38% for meat and fish during the national lockdown (April-May 2020). There was a gradual recovery after that, but even over a two-month period, this is a nutritional catastrophe, bearing in mind that baseline consumption levels are very low in the first place. Also, the recovery pattern must be read in light of the fact that the CPHS seems to be heavily biased towards better-off households (Drèze and Somanchi 2021b)
Figure 1. Average monthly per-capita expenditure on selected food items
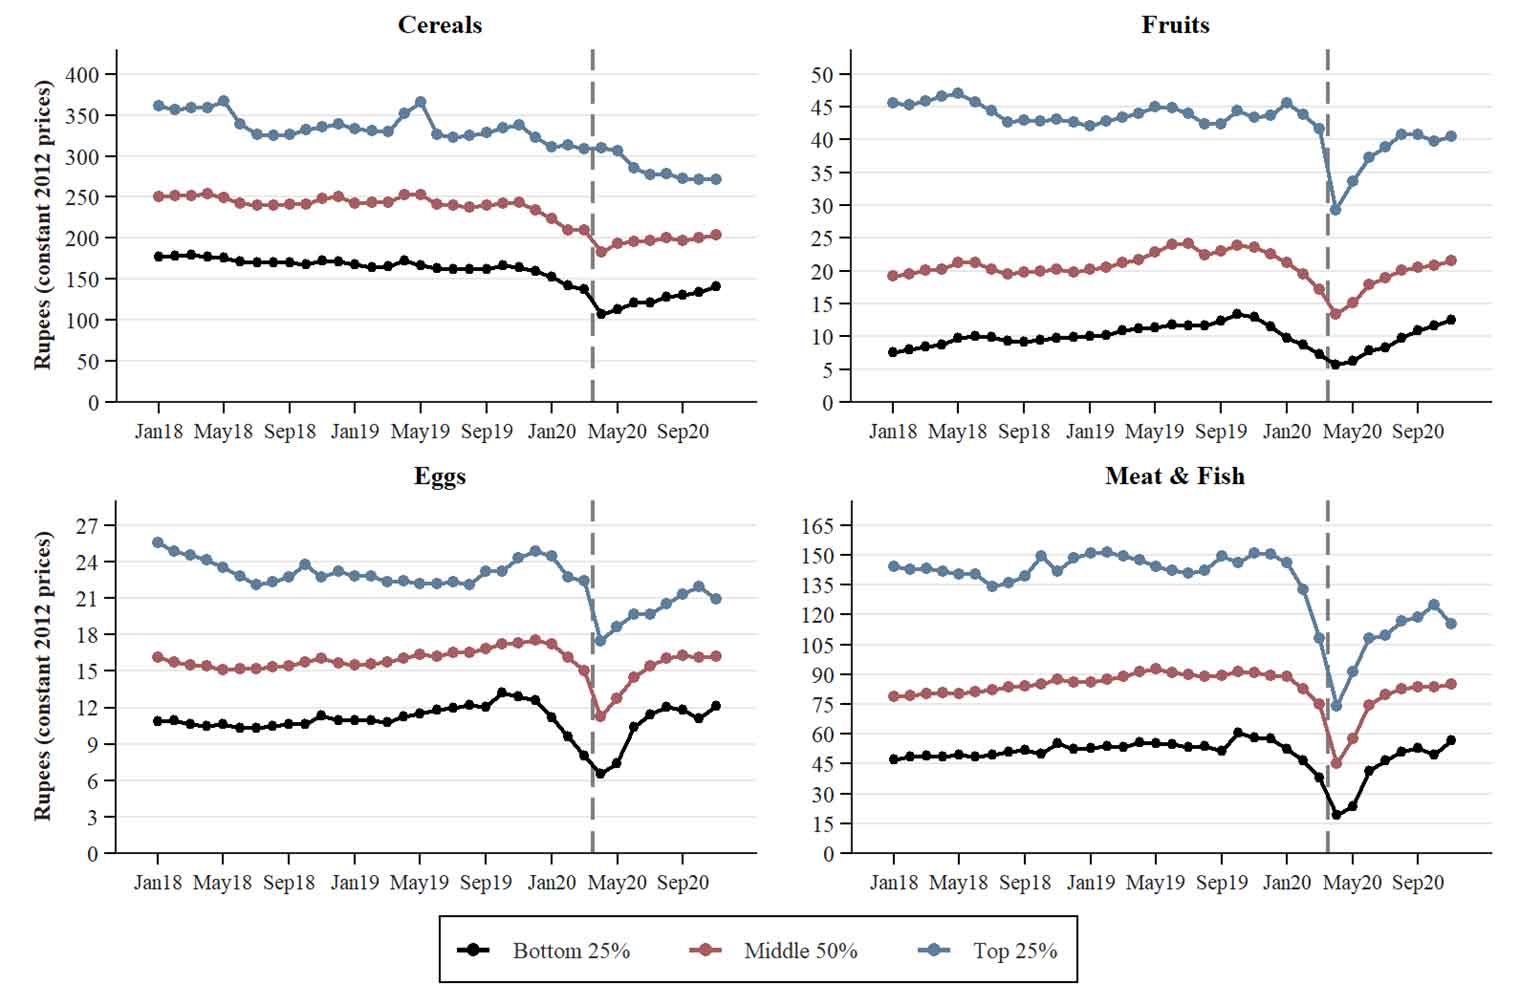
Notes: (i) Households are grouped by intervals of the PCE distribution, based on overall expenditure. (ii) Figures are weighted to account for sampling design.
Source: Authors’ calculations based on CPHS (CMIE) data.
Relief measures: Too little, too late
The reference surveys make it amply clear that State support played a critical role in sustaining poor people during and after the national lockdown. The PDS, in particular, reached a vast majority of the population, as prescribed under the National Food Security Act (NFSA)7. In six large-scale multi-state surveys, the proportion of households with a ration card (mainly NFSA cardholders) varied between 75% and 91% (see Table 3). Access to the PDS is likely to be higher than average among poor households. Conditional on having a ration card, the proportion of respondents who had received some foodgrains from the PDS during the reference period was higher than 80% in all the surveys except one (Gaon Connection), and higher than 90% in four surveys (Table 3).
Table 3. Access to the public distribution system
|
Source |
Reference period (2020)a |
Focus states |
Percentage of sample households that received grains from PDS |
Percentage of sample households that had a ration card |
Percentage of households with card that received grain from PDS |
Percentage of households with card that received free grain from PDSb |
|
PRADAN+ (Round 1) |
April |
AS, BR, CG, GJ, JH, KA, MH, MP, OD, RJ, UP, WB |
- |
- |
84 |
- |
|
Dalberg |
April-May |
AS, BR, GJ, HR, JH, KA, KL, MP, MH, OD, PB, RJ, TS, UP, WB |
89 |
87 |
92 |
92 |
|
NCDHR (National Campaign on Dalit Human Rights) |
April-May * |
AP, BR, KL, MH, MP, OD, UP |
- |
80 |
83 |
- |
|
CSE-APU (Round 1) |
April-May |
AP, BR, DL, GJ, JK, KA, MH, MP, OD, TS, UP, WB |
78 |
- |
- |
- |
|
RCRC (Round 1) |
April-May * |
AP, AS, BR, GJ, JH, MP, OD, RJ, UP |
- |
- |
- |
88 |
|
RCRC (Round 2) |
April-June * |
AP, AS, BR, CG, GJ, JH, MP, MG, OD, RJ, UP |
- |
90 |
- |
92 |
|
MicroSave (Round 1) f |
May |
All major states except CG, JH, HP, UK plus a few smaller states (18 in total) |
- |
- |
91 |
- |
|
PRADAN+ (Round 2) |
June * |
AS, BR, CG, GJ, JH, MP, OD, RJ, TR, UP, WB |
- |
- |
84 |
- |
|
Gaon Connection |
June-July |
All major states except AP, plus a few smaller states (20 in total) |
63 |
83 |
71 |
- |
|
MicroSave (Round 2) |
September |
All major states except CG, JH, HP, UK plus a few smaller states (18 states) |
- |
- |
94 |
- |
|
IDinsight+ (Round 3) |
September |
AP, BR, JH, MP, RJ, UP |
68 |
75 |
89 |
88 |
|
CSE-APU (Round 2) |
September-November |
AP, BR, DL, GJ, JK, KA, MH, MP, OD, RJ, TS, WB, UP |
- |
91 |
91 |
- |
Notes: (i) A list of state abbreviations can be found here (OD and TS are updated abbreviations for Odisha and Telangana respectively). (ii) ‘a’ refers to survey period, in cases (flagged with an asterisk) where the reference period for these indicators is not explicit. (iii) ‘b’ refers to supplementary foodgrain rations distributed for free under Pradhan Mantri Garib Kalyan Anna Yojana (PMGKAY). For further details, see Drèze and Somanchi (2021a).
A significant minority of ration card holders, however, had not received any foodgrain rations during the reference period. Further, PDS utilisation does not imply that the concerned households received their full entitlements. Aside from their normal NFSA entitlements (5 kilograms (kg)) per person, per month for priority households and 35 kg per month for Antyodaya households, the poorest of the poor), NFSA cardholders were supposed to get additional monthly rations of 5 kg per person, for free, from April to November 2020, under PMGKAY. Four major surveys found that about 90% of sample households had received some free grain during the reference period (see Table 3). This is reassuring (regular rations are sold at a price, so free grain must refer to additional rations under PMGKAY), but it does not rule out the possibility that many people received less than their due by way of free grain. Alas, none of the reference surveys included careful recording of the sort of information (type of ration card, quantity of PDS grain received, breakdown between regular and PMGKAY quotas, etc.) that would make it possible to estimate leakages with any confidence.
Similar issues arise with MNREGA and even cash transfers. Take the case of the cash transfers of Rs. 500 per month to all JDY accounts held by women in April-June 2020 under the central government’s relief package. Not only were nearly 40% of poor households left out because they did not include an adult woman with a JDY account (Pande et al. 2020, Somanchi 2020), roughly one-third of women with a JDY account also denied receiving any benefits, judging from multiple surveys (Totapally et al. 2020, RCRC 2020, National Coalition of Civil Society Organizations, 2020). In addition to low awareness levels and lack of clarity on rules and eligibility, JDY transfers were also plagued by account dormancy, transaction failures, and vulnerability to fraud (Somanchi, forthcoming). The infrastructure of cash transfers in India is still far from satisfactory.
Limited and unreliable as they were, relief measures failed to make up for more than a small fraction of the income losses induced by the national lockdown and the economic crisis that followed, even among poor households. Given the possibility that relief measures may be required again in the near future, it is important to aim at more extensive and effective interventions. A transition from ad hoc, short-term measures, to durable entitlements may help in this respect.
Concluding remarks
The 76 household surveys compiled by CSE-APU (along with CMIE data) represent an invaluable body of evidence. They provide rich insights on the humanitarian impact of the Covid-19 crisis, including many aspects we have not dealt with such as psychological damage, children’s well-being, and the predicament of marginalised communities. As far as food security is concerned, a few points stand out.
First, there is clear evidence that the national lockdown of April-May 2020 was associated with a devastating food crisis. Large numbers of people struggled to feed their families, and food intake dipped in both qualitative and quantitative terms for a majority of the population. There was a particularly sharp decline in the consumption of nutritious food including non-vegetarian items.
Second, there was some recovery from June 2020 onwards, when the lockdown was gradually relaxed, but hardship persisted well beyond that. Employment, income, and nutrition levels were still much below pre-lockdown levels even at the end of the year.
Third, relief measures helped, but they were patchy, and their effective reach is uncertain. A large majority of the population had access to the PDS in 2020 (with enhanced monthly rations for eight months), and this played a critical role in averting the worst. But it is possible that some of the supplementary rations got diverted, initially at least, and a significant minority of poor households had no access to the PDS at all for lack of a ration card. Other relief measures such as MNREGA and cash transfers also had a patchy coverage. The Covid-19 crisis brings out once again that India needs a more reliable and comprehensive social security system.
This lesson, however, was lost on the central government, judging from the 2021-22 Budget. No provision was made for further relief measures in 2021 (even in the limited form of contingency funds), even as enormous sums continued to be allocated to business concessions in the name of an economic stimulus. The central government seemed to be in blissful denial of the continuing livelihood crisis and to count on a “V-shaped recovery”.
A few weeks after the 2021-22 Union Budget announcement, the second wave of Covid-19 hit the country with full force. The livelihood crisis may or may not be worse in 2021 than in 2020. There is no national lockdown this time, but there are local lockdowns of varying intensity and duration across the country. And in some respects, circumstances are more challenging today. People’s reserves are depleted and many are in heavy debt. The number of infections and deaths is much larger than in 2020, forcing large numbers of households to contend with heavy health expenditure, if not the loss of a breadwinner. With mass vaccination making slow progress, hard times are likely to continue for many months. A second, stronger wave of relief measures is essential to avoid a repeat of last year’s tragic humanitarian crisis.
I4I is now on Telegram. Please click here (@Ideas4India) to subscribe to our channel for quick updates on our content.
Notes:
- JDY is a financial inclusion programme of the Government of India, which aims to expand access to financial services such as bank accounts, remittances and insurance among Indian citizens.
- For further details of sampling methods and related aspects of the reference surveys, see Drèze and Somanchi (2021a).
- The national lockdown (imposed from 24 March 2020) lasted well into the month of June, and some aspects of it (for example, closure of schools and anganwadis) continued even after that. However, April-May 2020 is still a useful reference period for the full-fledged national lockdown.
- On this, see also Deshpande (2020a). The decline of paid employment opportunities for women, it seems, was accompanied by an increase in the burden of domestic work, possibly because more family members were at home (Deshpande 2020b). On a more positive note, women appear to have benefitted more than men from the expansion of MNREGA employment in 2020, because they had fewer alternatives (Afridi et al. 2021).
- An important confirmation of this comes from an ongoing study (Dhingra and Kondirolli forthcoming) based on a survey of informal-sector workers in January-March 2021.
- In Figure 1, we have used the consumer price index (CPI, combined general index) to deflate money expenditures. The graphs are very similar when we use the CPI (combined food and beverages) as a deflator.
- The NFSA requires the PDS to cover at least 75% of the rural population and 50% of the urban population, based on the latest Census figures. These national ratios have been adjusted state-wise to ensure that PDS coverage is higher in the poorer states (for example, 86%/60% in rural/urban Jharkhand). Some states have distributed additional ration cards, outside the NFSA, at their own expense. Chhattisgarh has its own Food Security Act, with near-universal coverage in rural areas. For further details, see Khera and Somanchi (2020).
Further Reading
- Afridi, F, K Mahajan and N Sangwan (2021), ‘Did MNREGA cushion job losses during the pandemic?’, Ideas for India, 11 February.
- Deshpande, A (2020a), ‘The Covid-19 pandemic and lockdown: First order effects on gender gaps in employment and domestic work in India’, GLO Discussion Paper No. 607.
- Deshpande, A (2020b), ‘The Covid-19 pandemic and gendered division of paid and unpaid work: Evidence from India’, IZA Discussion Paper No. 13815.
- Dhingra, S and F Kondirolli (forthcoming), ‘City of Dreams No More, A Year On: Worklessness and Active Labour Market Policies in Urban India’, Centre for Economic Performance, London School of Economics.
- Drèze, JP and A Somanchi (2021a), ‘The Covid-19 Crisis and People’s Right to Food’, SocArxiv.
- Drèze, JP and A Somanchi (2021b), ‘Not Having the Have-Nots’, The Economic Times, 20 June.
- Khera, R and R Malhotra (forthcoming), ‘Covid Lockdown Relief’, in Y Jain et al. (eds.), Covid-19: A View from the Margins.
- Khera, R and A Somanchi (2020), ‘A review of coverage of the Public Distribution System’, Ideas for India, 19 August.
- National Coalition of Civil Society Organizations (2020), ‘Exploring Cash Transfer to Jan Dhan Accounts as Covid-19 Response: Findings from A Rapid Survey (28 April to 12 May 2020) for Assessing the Ground Reality’, Survey Report, Oxfam India.
- Pande, R, S Schaner, CT Moore and E Stacy (2020), ‘A majority of India’s poor women may miss Covid-19 PMJDY cash transfers’, Yale University and University of Southern California Brief, 17 April.
- Rapid Rural Community Response to Covid-19 (2020), ‘Rapid Assessment Survey of Cash Transfers to Women Jan Dhan Account Holders’, Survey report, RCRC, April 2020.
- Somanchi, A (2020), ‘Covid-19 relief: Are women Jan Dhan accounts the right choice for cash transfers?’, Ideas for India, 22 May.
- Somanchi, A (forthcoming), ‘Evaluating the performance of Covid cash relief to Jan Dhan accounts’.
- Totapally, S, P Rao, P Sonderegger and G Gupta (2020), ‘The efficacy of government entitlements in helping BPL families navigate financial impacts of Covid-19’, Dalberg.

Comments will be held for moderation. Your contact information will not be made public.