

 10 October, 2022


In the second post of a six-part series on the estimation of poverty in India,
The World Bank has been using the standard of $1.90 per person per day (in 2011 purchasing power parity US dollars) to monitor levels of extreme poverty around the world. By this standard, 22% of India’s population was deemed to be in extreme poverty in 2011-12. Though a decade has now passed by, more recent estimates of poverty in India remain embroiled in controversy. The reason is the absence of comparable data from the National Sample Survey (NSS) Office’s Consumer Expenditure Surveys (CES), which have been the mainstay of poverty measurement in India for decades (Datt et al. 2020).
The last publicly available round of the NSS consumption survey was for the year 2011-12. Another round of the survey was conducted for the year 2017-18, but neither the results nor the data from this survey were released with the government citing “data quality issues” as the reason for its suppression. But leaked tabulations from the survey – which indicated a stagnation in national poverty and an increase in rural poverty since 2011-12 – made many an observer wonder whether the decision (made months before the 2019 general elections) was politically motivated.
Be that as it may, the data vacuum has led to a number of attempts to estimate post-2012 poverty levels in India using a variety of imputation methods and/or alternative data sources.1 Most of these indicate a decline in poverty since 2012, though at a rate slower than that observed for the preceding decade, which seems consistent with the slowdown of India’s growth especially since 2016-17.
One exception to this is the recent IMF Working Paper by Bhalla, Bhasin and Virmani (hereafter BBV), which has declared the virtual elimination of extreme poverty in India. To put it in their own words: “By this standard [the World Bank’s $1.90 poverty line], India can reasonably claim that in pre-pandemic [sic] India was on the verge of eliminating extreme poverty”.
There are other claims in the paper too regarding the fall in inequality and the negligible poverty impact of the pandemic, but my focus is on the claim of virtual elimination of extreme poverty pre-pandemic. Does it hold up to reasonable scrutiny? To answer this question, we need to unpack the claim.
How accurate are the poverty estimates?
BBV present two sets of poverty estimates: with or without taking account of the food transfers through the Public Distribution System (PDS). Without food transfers, they claim poverty to have fallen from 21.8% in 2011-12 (not very different to the aforementioned estimate of 22%) to 3.4% by 2019-20; with food transfers, the estimated fall in poverty is from 19.9% to 1.9%. Thus, it is enough for the claim of virtual elimination of extreme poverty to rest on the estimated progress even without food transfers; the valuation of the subsidy component of food transfers is only a cherry on top. So, let’s focus on the claimed fall in poverty from 22% in 2011-12 to 3% in 2019-20.
BBV’s methodology of arriving at these numbers is relatively straightforward.
- Begin with the consumption distribution from the last NSS consumption survey for 2011-12.
- Assume that mean per capita consumption in nominal terms has grown at the same rate as the per capita private final consumption expenditure (PFCE) from the National Accounts (NA).
- Assume that every household’s per capita consumption has grown at the same rate as the mean per capita consumption, to arrive at the ‘updated’ distribution for every subsequent year after 2011-12 (which, except for the mean, is the same as the 2011-12 distribution).
- Estimate poverty measures for every subsequent year using the ‘updated’ distribution from the third step and the 2011-12 poverty line updated by the Consumer Price Index (CPI).
Thus, BBV effectively assume distribution-neutral growth since 2011-12 at a rate given by the NA growth in private consumption per person.2 BBV defend their first assumption by arguing that “survey capture [the ratio of survey-to-NA consumption] in India has “normalized” to around 50% in 2004-5, 2007-8 (a small-sample NSS survey), 2009-10 and 2011-12 according to the URP [Uniform Recall Period] method”. The trouble is that there is no evidence of this.
Figure 1 shows the survey capture ratio (also referred to as the ‘pass-through’ rate) over nearly sixty years based on the work of Datt et al. (2020). It has been falling rapidly since the mid-1980s, with no sign of stability since 2004-05 either. Even using the new revised back series of National Accounts, the survey capture ratio was 48, 45 and 46% for the years 2004-05, 2009-10 and 2011-12 respectively. This is hardly the evidence on which to hang the projected constancy of the ratio for the next decade, especially in light of its secular decline over the preceding four decades.
Figure 1. Falling ratio of survey-to-NA per capita consumption (nominal)
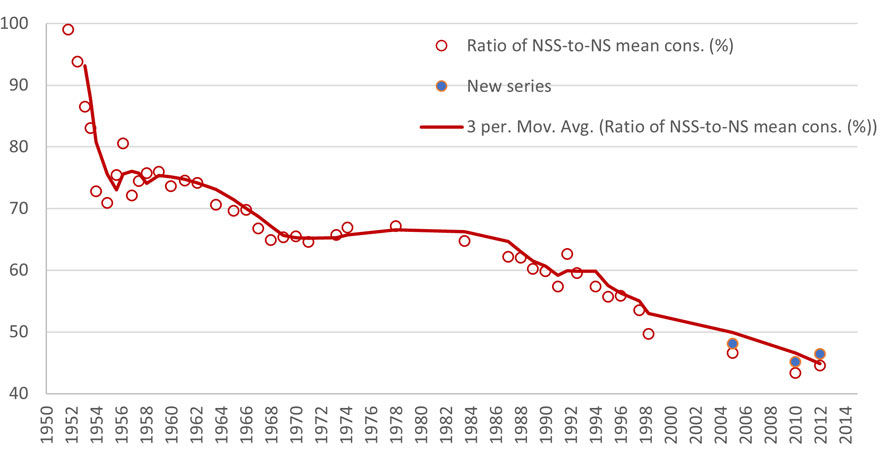
Source: Based on data from Datt et al. (2020).
Notes: i) The graph shows the ratio of nominal values of per capita consumption from NSS surveys to that from the National Accounts (NA). ii) To mesh the survey and NA data, the latter (available on annual basis) are linearly interpolated to the mid-point of the survey period for each NSS round. iii) Survey estimates of per capita consumption relate to those based on the Uniform Recall Period. iv) The New Series (NS) refers to revised back series of NA after the base was shifted to 2011-12.
The declining survey capture ratio is closely related to the violation of BBV’s second assumption. The survey capture ratio has been declining in good measure precisely because the surveys fail to capture the top tail of the income distribution, while top income shares have been rising rapidly. Estimates by Chancel and Piketty (2019) indicate that missing top incomes account for a large and increasing share of the gap in mean incomes in the NA and surveys, which was about 45% in 2014-15 (Figure 2).
Figure 2. Missing top incomes as a proportion of the NA-survey income gap (left panel), and rising income inequality (right panel)
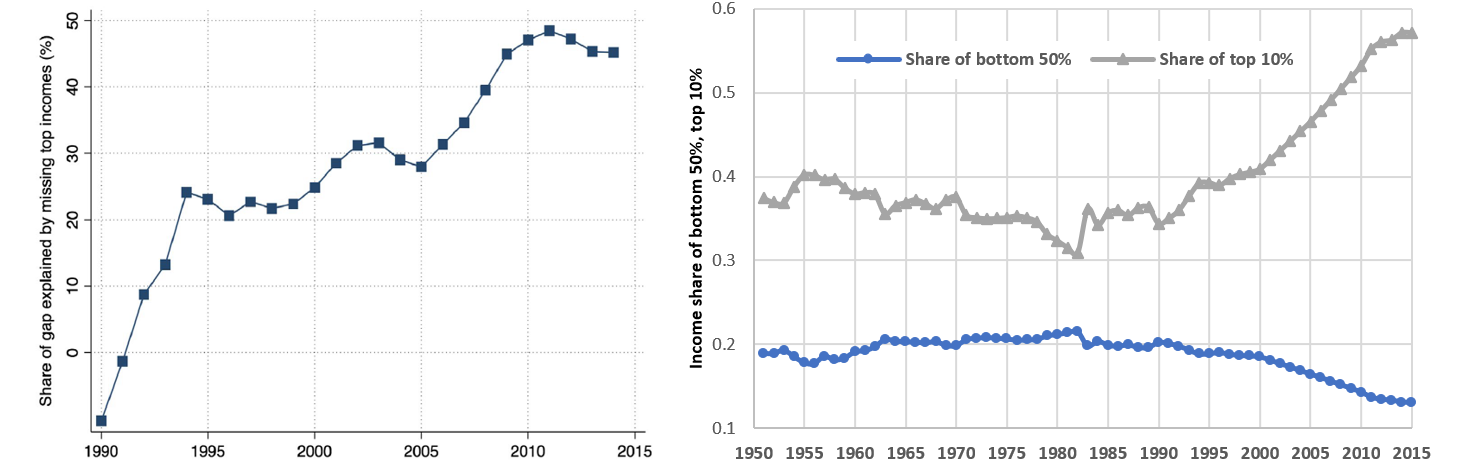
Source: Chancel and Piketty (2019)
There is thus little justification for the two assumptions.
Give up on these assumptions, and the entire house of cards built up by BBV collapses. Alternative estimates that relax the first assumption and use a survey capture ratio of 0.67 put the extreme poverty rate for FY2017-18 at about 10%. Other estimates that use alternative (reweighted) data from the Consumer Pyramid Household Surveys (CPHS) since 2014, and survey-to-survey imputation methods3 to infer consumption levels comparable to the NSS surveys, also arrive at a similar estimate of extreme poverty of about 10% for 2019-20 (Roy and van der Weide 2022). These alternative estimates are not perfect, but they cast significant doubts on the claim of elimination of extreme poverty in India.
Conclusion
Way back in 1988, B. S. Minhas had warned against pro-rata (or proportional) adjustment to the survey-based distribution of consumption in the Seventh Five-Year Plan documents:
“…it is hazardous to carry out pro-rata adjustment in the observed size distribution of consumer expenditure in a particular NSS round by multiplying it with a scalar derived from the ratio between the NAS [National Accounts Statistics] estimate of aggregate private consumption (for some financial year) and the total household expenditure available from the NSS round. This kind of mindless tinkering with the NSS distribution, as practiced by the Planning Commission in the Seventh Plan documents, does not seem permissible either in theory or in light of known facts.”
Minhas was referring to a pro-rata adjustment in levels. BBV estimates amount to a pro-rata adjustment using growth rates (that is, multiplying the base NSS distribution by a growth scalar given by per capita consumption growth from the NAS), which is also hazardous when applied over a decade-long period. It is unfortunate that the gaps in India’s statistical system and the lack of comparable data has created an environment where such tinkering has continued over three decades later.
Notes:
- See, for instance, Newhouse and Vyas (2019), Edochie et al. (2022) and Roy and van der Weide (2022).
- BBV also present a version assuming distribution neutrality at the state-level. They also have another version of their estimates using the Modified Mixed Recall Period (MMRP) consumption measures from the NSS.
- These methods involve imputing consumption into a target survey without a comparable measure of consumption in the source survey. This is done using either an estimable relationship between consumption and a set of common household characteristics in the two surveys, or by estimating a relationship between measurement of consumption in the two surveys.
Further Reading
- Bhalla S, K Bhasin and A Virmani (2022), ‘Pandemic, Poverty, and Inequality: Evidence from India’, International Monetary Fund, IMF Working Paper No. 2022/069.
- Chancel, Lucas and Thomas Piketty (2019), “Indian Income Inequality, 1922-2015: From British Raj to Billionaire Raj?”, The Review of Income and Wealth, 65(S1): S33-S62.
- Datt, Gaurav, Martin Ravallion and Rinku Murgai (2020), “Poverty and Growth in India Over Six Decades”, American Journal of Agricultural Economics, 102(1): 4-27. Available here.
- Edochie, Ifeanyi Nzegwu, Freije-Rodriguez, Samuel, Lakner, Christoph, Herrera, Laura Moreno, Newhouse, David, Roy, Sutirtha Sinha and Yonzan, Nishant (2022). What do we know about poverty in india in 2017/18? World Bank Policy Research Working Paper 9931.
- Minhas, BS (1988), “Validation of Large Scale Sample Survey Data Case of NSS Estimates of Household Consumption Expenditure”, Sankhyā: The Indian Journal of Statistics, Series B (1960-2002), 50(3): 279-326.
- Newhouse, David Locke and Vyas, Pallavi (2019). Estimating poverty in india without expenditure data: A survey-to-survey imputation approach. World Bank Policy Research Working Paper 8878.
- Roy, SS and R van der Weide (2022), ‘Poverty in India Has Declined over the Last Decade But Not As Much As Previously Thought’, World Bank, Policy Research Working Paper 9994.

Comments will be held for moderation. Your contact information will not be made public.