

 27 April, 2021


The nationwide lockdown imposed in March 2020 to contain the spread of Covid-19, disrupted economic activity – particularly in urban India. Using data from the Periodic Labour Force Survey for the period April-June 2020, Mitra and Singh examine job losses in urban areas. They find that the secondary and tertiary sectors were more adversely affected than agriculture, and more women than men dropped out of the labour force.
During the early phase of the nationwide lockdown that was imposed on 25 March 2020, following the outbreak of the Covid-19 pandemic in India, the urban labour market was severely affected. While there were many reasons for this disproportionate effect on the urban labour market, two stand out distinctly. First, lockdowns were more strictly enforced in urban as compared to rural areas. Second, the lockdown stalled secondary and tertiary activities much more relative to agriculture, and 95% of the country’s urban workforce is engaged in secondary and tertiary activities. Impressions of this were clearly visible in the GDP (gross domestic product) estimates of the first quarter of 2020-21, which showed that urban-based activities – both secondary and tertiary – shrunk by almost 23%, while agriculture continued to grow despite the lockdown.
The magnitude of the adverse impact of Covid-19 on the labour market has been debatable in the absence of official data. In May 2020, the Centre for Monitoring of Indian Economy (CMIE) showed that about 122 million jobs had been lost both in rural as well as urban areas in the month of April. Now, over a year later, the Periodic Labour Force Survey (PLFS) results for the quarter April-June 2020 have been released by the Ministry of Statistics and Programme Implementation of the Government of India. Based on this data, we present estimates of job losses during this period, and seek to cross-validate with some of the popular estimates.
Using official data to estimate job losses
Released on a quarterly basis, PLFS is widely considered as the most credible source of data on employment and unemployment in India. The quarterly survey results are available both for urban and rural areas – with some additional information being available for urban areas. While new households in urban areas were surveyed in every quarter, households which were surveyed in the first quarter were resurveyed in the second quarter and these households were resurveyed in the third quarter and so on, though, this process was not followed in the rural context. Further, the survey measures labour market indicators only on the basis of current weekly status (CWS). The CWS takes a reference period of seven days preceding the date of the survey. The report publishes, among other things, three key indicators by gender and age group: labour force participation rate, worker-population ratio, and unemployment rates.
As mentioned in the report, due to the lockdown, some respondents were approached later, and were asked about their work status with respect to the April-June period. Phone surveys were used for about 61% of these revisit surveys. Since there is low possibility of seasonality in urban quarterly data, unlike the case of rural data, we have compared the estimates for the January-March 2020 quarter to the April-June 2020 quarter.
Labour force
We present estimates of the labour force1, workforce2, and unemployed for the quarters January-March 2020 and April-June 2020 for the age group ‘15 years and above’ in Figure 1. As per the estimates, about 182 million people were either looking for jobs or had a job in the quarter just before the lockdown. However, about 7 million withdrew from the labour force during the lockdown period.
Despite the fact that the number of women in the labour force (about 40 million) was much lower than the number of men (about 140 million), more women dropped out of the labour force relative to men (4 million versus 3 million).
Those who withdrew from the labour force may not get reflected in the unemployment rate3 as the denominator – labour force – has also declined. Therefore, the change in employment instead of unemployment rate is the right indicator to look at to gauge the performance of the labour market during the pandemic.
Figure 1. Persons of age '15 years and above' in labour force in 2020 (in million)
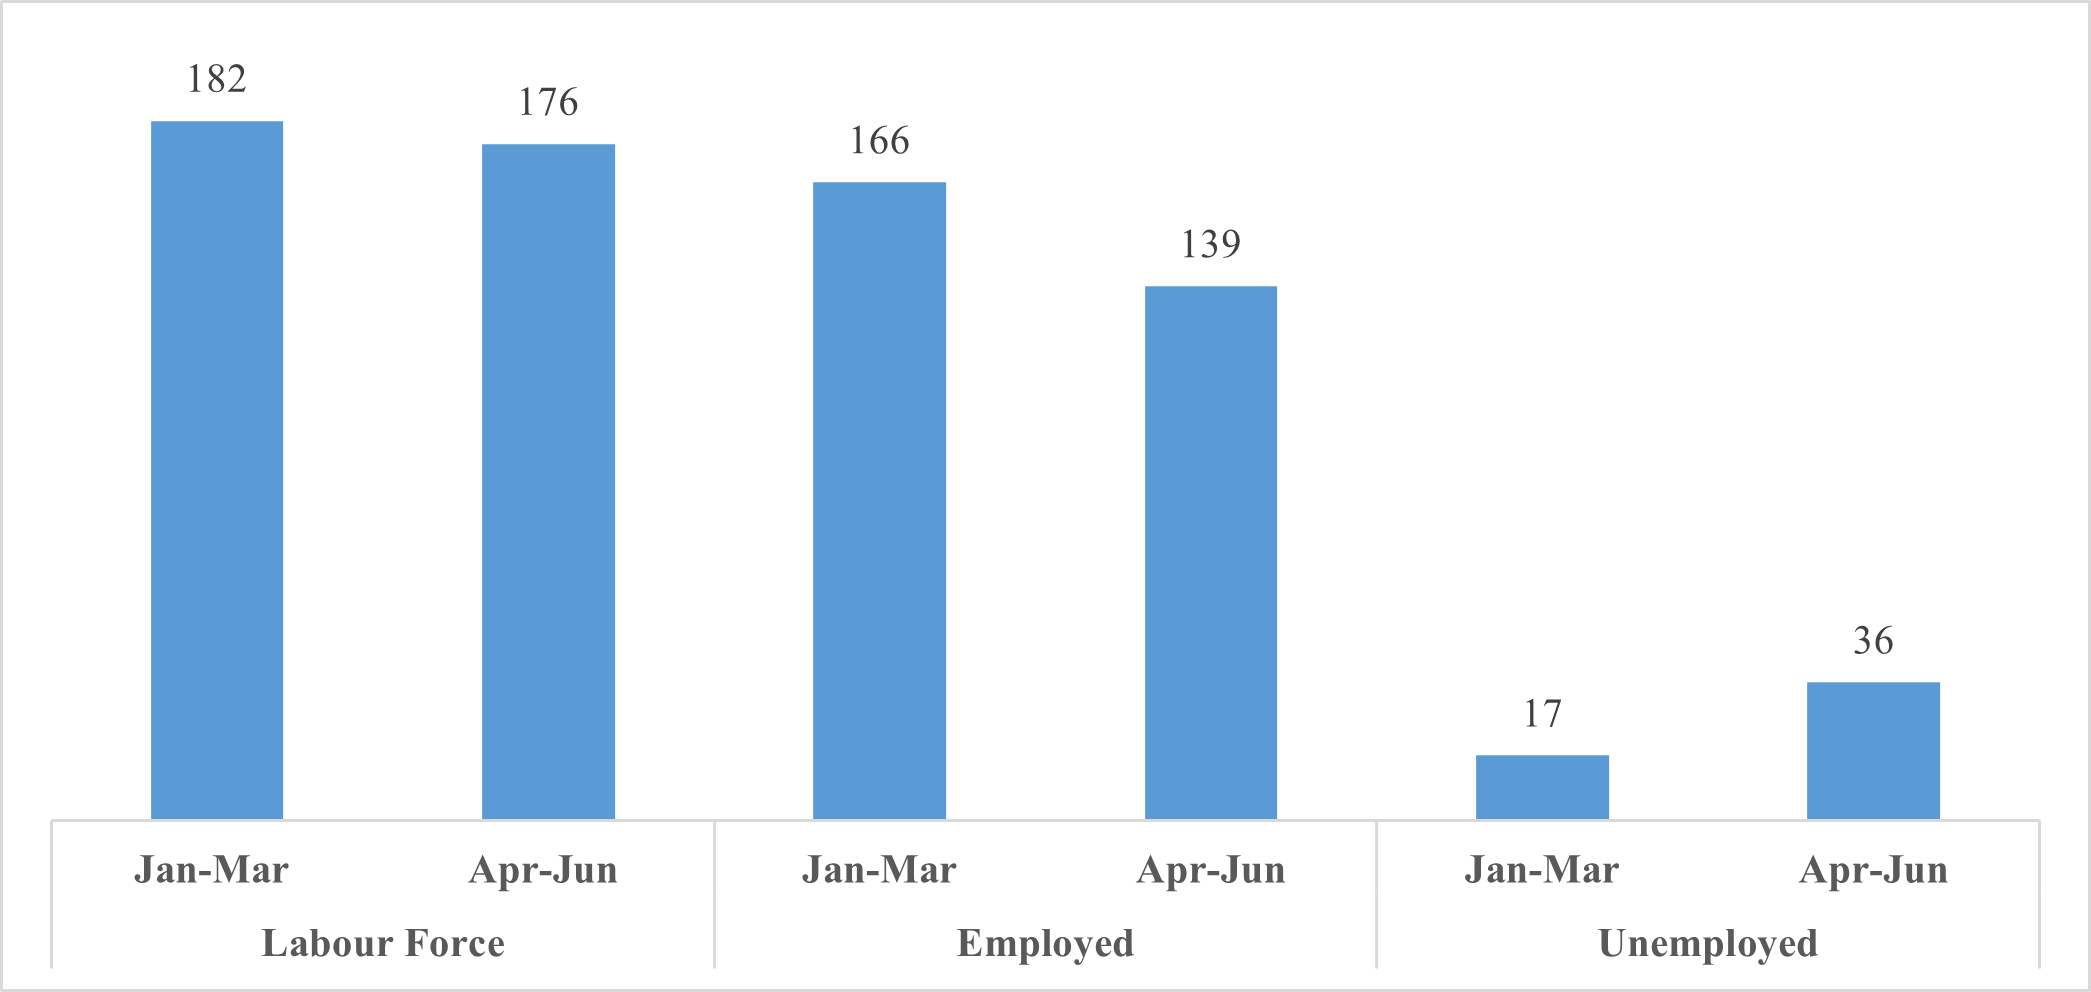
Notes: (i) Estimated using projected population for the age group ’15 years and above’ as on 1 February 2020 for January-March 2020 and as on 1 May 2020 for April-June 2020. The fraction of population in the age group ‘15 years and above’ for a particular quarter is calculated from the persons surveyed by age and gender as published in the survey. (ii) Projected population for January-March 2020 was 378.8 million and for April-June 2020 was 382 million. (iii) Formula for population projection is: A = A1 * [1 + R /100] (t/120), where A1 is the Census population as on 1 March 2011, R is the percentage decadal change in population between Census 2001 and 2011, and t is the number of months from March 2011.
Employment and unemployment
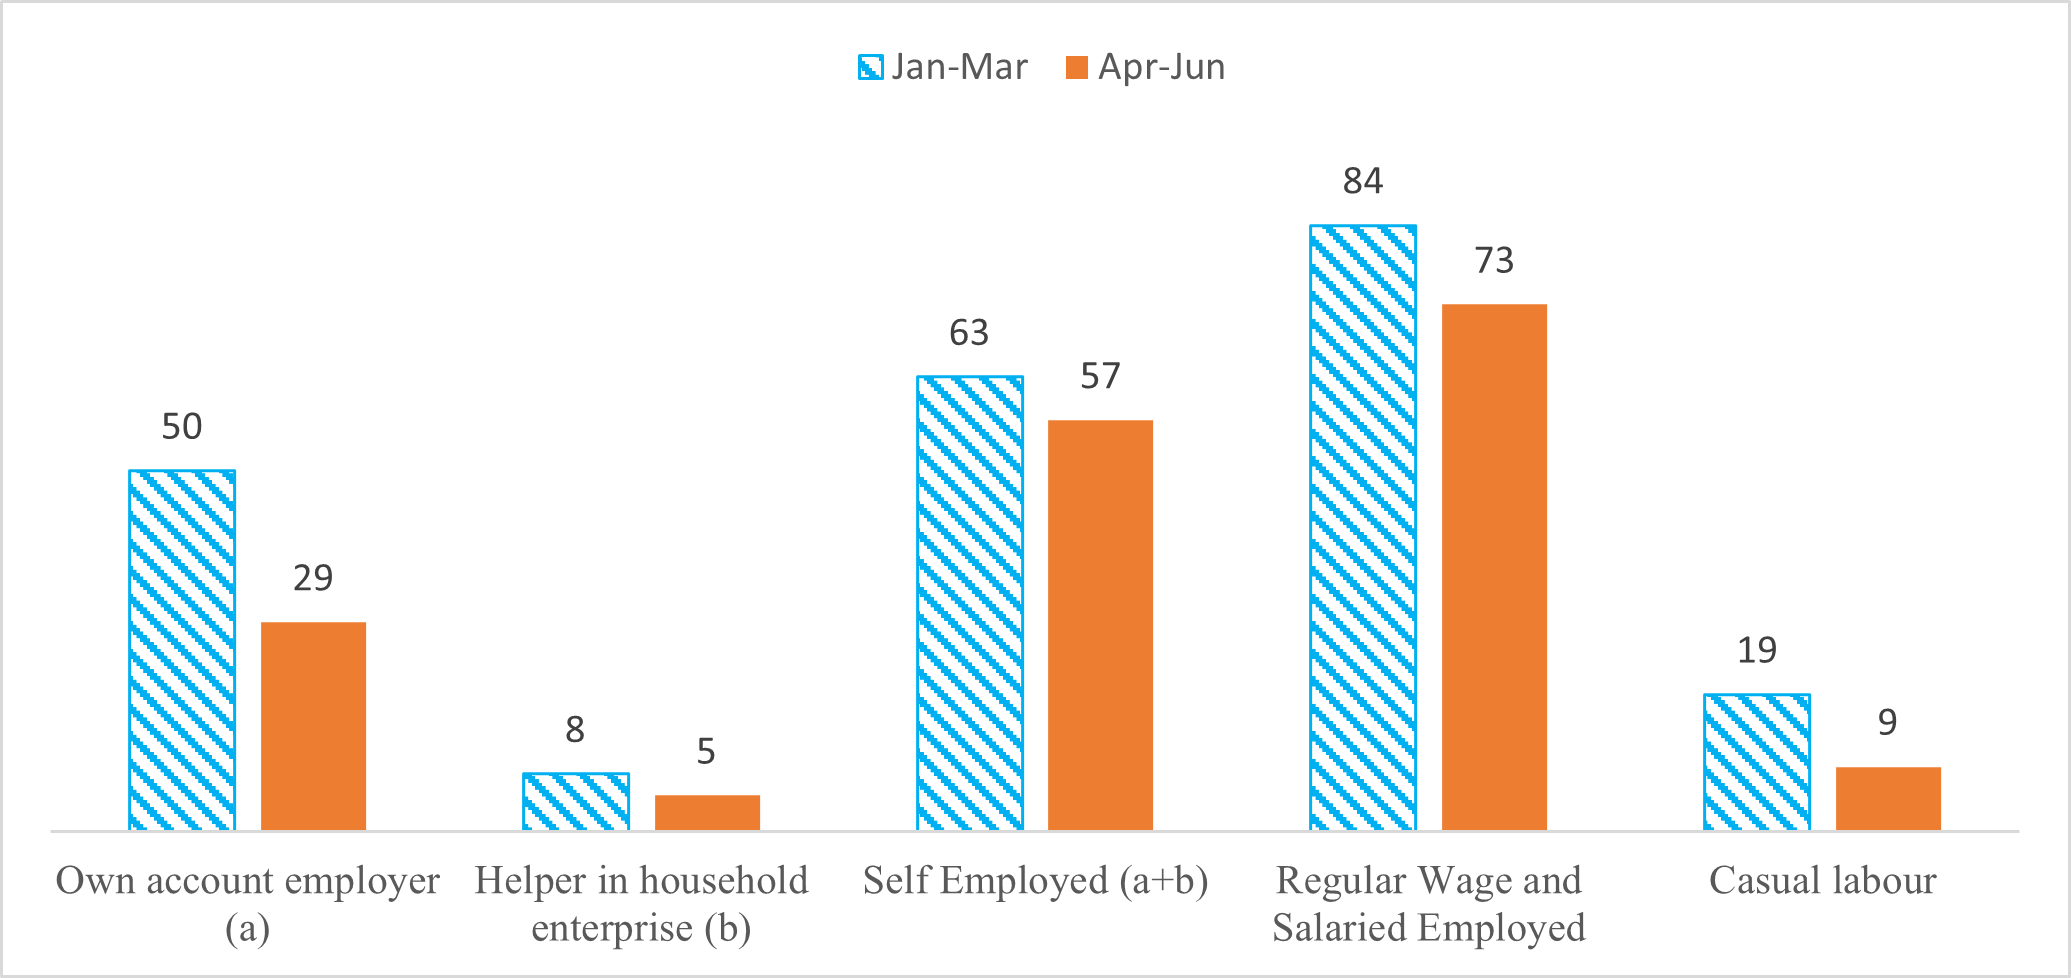
Employment estimates by industry and by broad employment status have been presented in Figures 2 and 3. As per the estimates, about 166 million people were employed in the January-March 2020 quarter. In April-June 2020, the decline in employment compared to the preceding quarter was about 26 million – 19 million for men and 7 million for women (Figure 1). The urban agriculture sector remained resilient as there was no change in the number of persons employed in April-June 2020 over the previous quarter. However, the secondary and tertiary sectors suffered job losses (Figure 2). The worst affected were the casual workers. Out of approximately 19 million employed during the pre-lockdown quarter, about 9 million lost their jobs during April-June 2020 (Figure 3). Employment declined by 10 million in the ‘regular wage and salaried’ category and by about 6 million in the ‘self-employed’ category. While some may have been forced to withdraw from jobs due to lockdown, some may have done so willingly due to the fear of contracting Covid-19.
Figure 2. Persons of age '15 years and above' employed, by industry, in 2020 (in million)
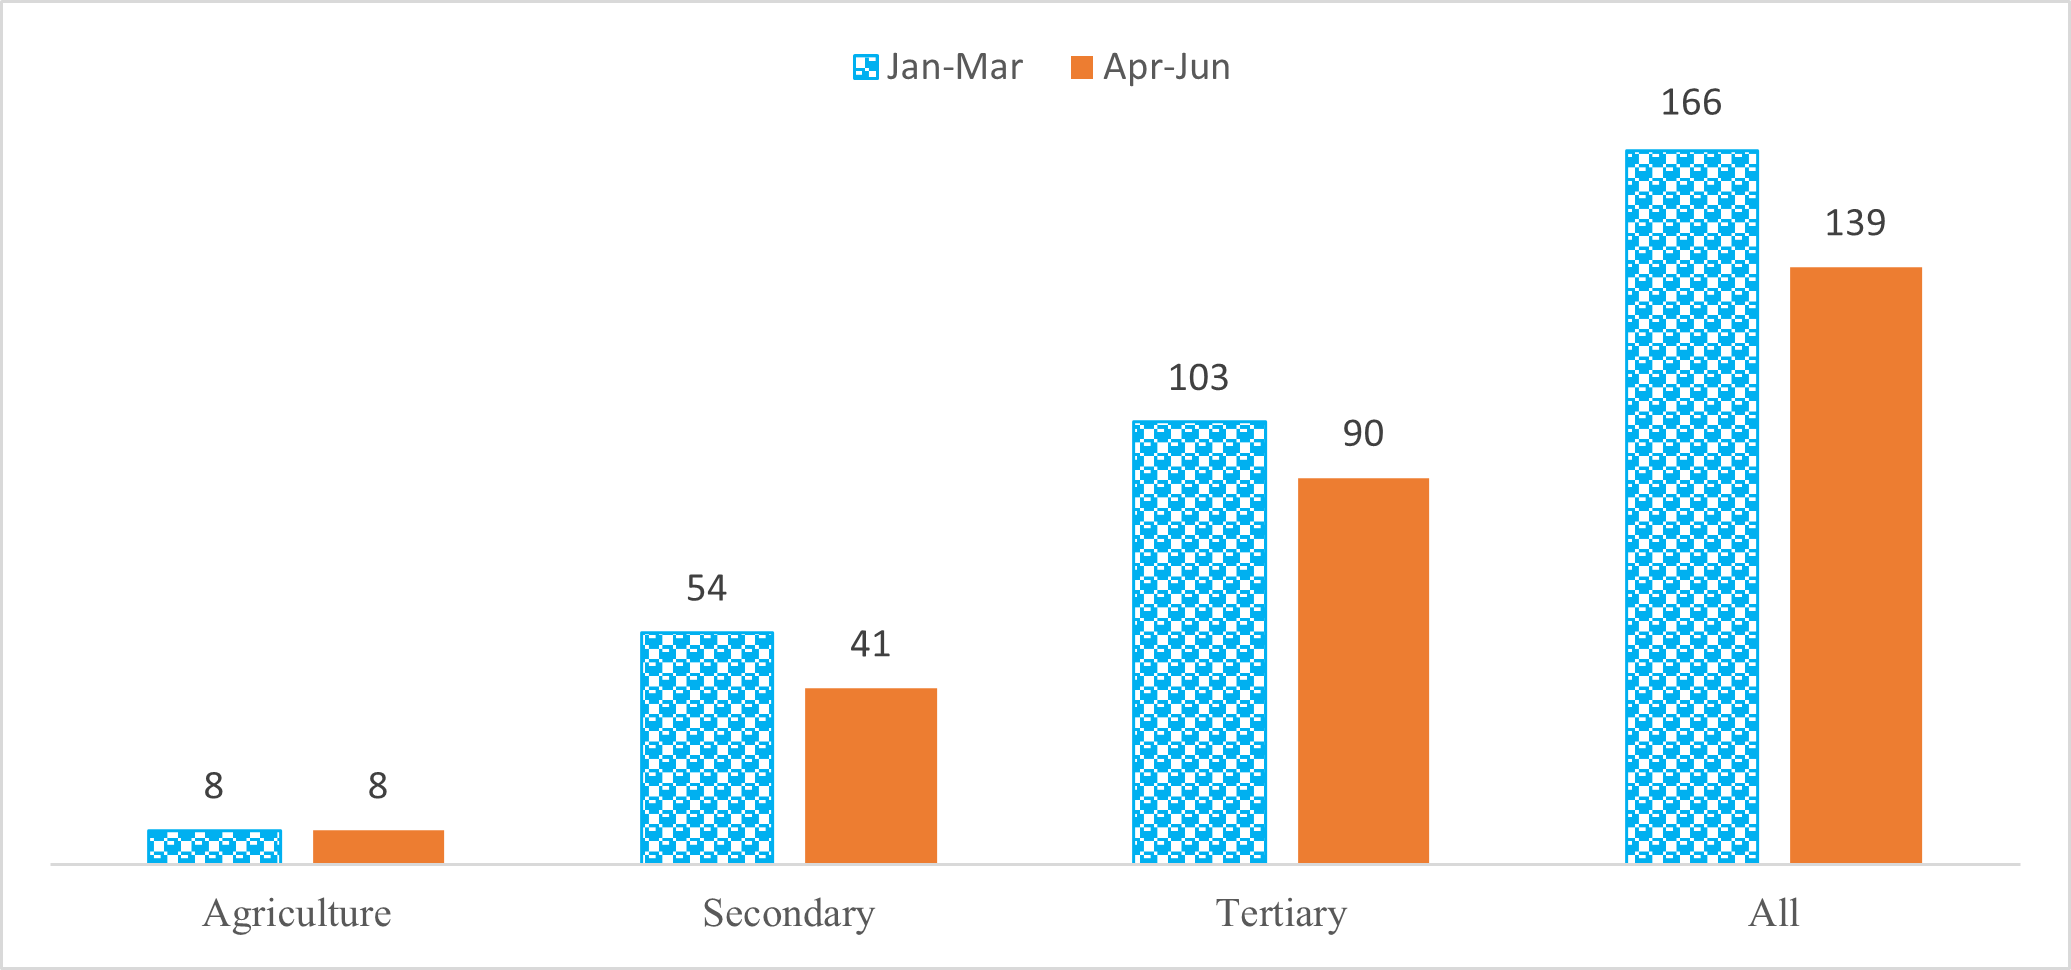
Figure 3. Persons of age ‘15 years and above’ employed, by broad employment status, in 2020 (in million)
Among those who were still in the labour market during the lockdown and looking for jobs, about 36 million were unable to find a job. While there were only about 17 million unemployed persons during the previous quarter, it went up by an additional 20 million. Hence, the net increase in the number of unemployed persons during April-June 2020 (Figure 1) was indeed substantial.
Concluding remarks
The estimates suggest that during April-June 2020, the number of employed persons declined by about 26 million in the urban sector relative to the preceding quarter; about 6 million – predominantly women – withdrew from the workforce; and the number of unemployed persons increased by about 20 million. When examined by employment status, the worst affected were casual workers. In terms of industry groups, the secondary and tertiary sectors took a big hit, while agriculture remained largely resilient. This is because the lockdown had a strong region-centric impact, affecting urban more than rural regions.
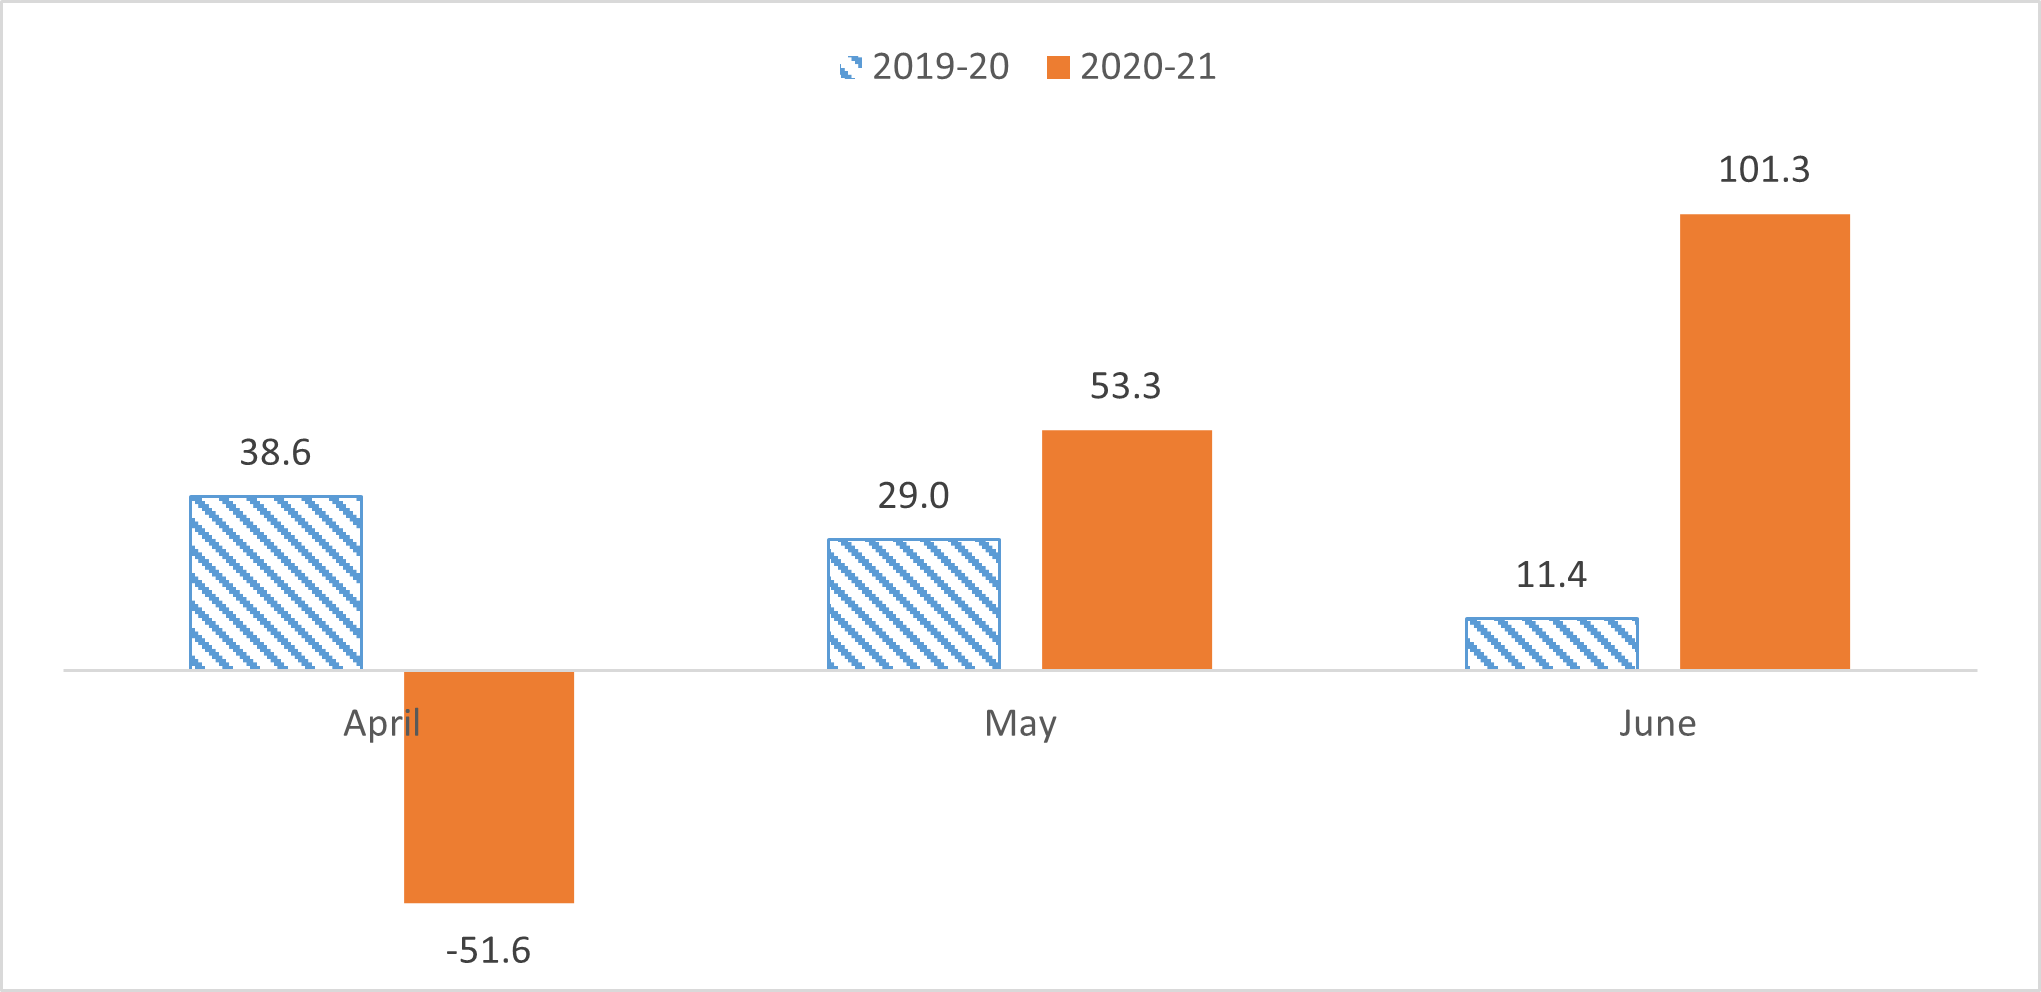
However, if those who migrated back to the villages were absorbed in rural agricultural or non-agricultural activities, the urban job loss would have been compensated to some degree – depending on the absorptive capacity of these rural activities. If agriculture is already saturated and rural non-farm activities are largely dominated by supply-push effects4, and not by the demand-induced components - the income and consumption losses would indeed be huge. The Mahatma Gandhi National Rural Employment Guarantee Act (MNREGA)5 jobs, which reflect ‘distress employment’, shot up significantly in May and June 2020 (Figure 4).
Figure 4. Year-on-year growth in persons who worked in MNREGA jobs (in percentage)
Besides, not everyone who lost jobs in urban areas would have been fresh migrants from rural areas. Many among them may have been residing in urban areas for long, with little association with rural relatives. Hence, their prospects in the rural labour market may have been bleak. Will not all this evidence add up to vouch for an urban employment guarantee programme?
I4I is now on Telegram. Please click here (@Ideas4India) to subscribe to our channel for quick updates on our content.
Notes:
- A person is counted in the labour force if either they did get work for at least one hour on any day during the reference week, or sought/were available for work for at least one hour on any day during the reference week.
- As per the PLFS, the workforce “provides the number of persons worked for at least 1 hour on any day during the 7 days preceding the date of survey”.
- Unemployment rate is a percentage of unemployed persons in the labour force.
- Activities which are not backed by demand, or activities which are characterised by an excess in the supply of labour.
- MNREGA guarantees 100 days of wage-employment in a year to a rural household whose adult members are willing to do unskilled manual work at the prescribed minimum wage.
Further Reading
- Ministry of Statistics and Programme Implementation of India (2020), ‘PLFS Quarterly Bulletin April-June, 2020’, Government of India.

Comments will be held for moderation. Your contact information will not be made public.