

 10 March, 2021


In developing countries, extreme climate events can have disastrous consequences for vulnerable populations. This article analyses state government’s responses to droughts in South India during 2008-2019, and shows that the allocation of relief by state governments is not solely driven by the goal of aiding the drought-affected. It also demonstrates that drought relief – if appropriately targetted – is associated with improved agricultural production.
Extreme weather and climate events affect households around the world. Moreover, climate change threatens to alter the frequency, duration, and intensity of such events (Intergovernmental Panel on Climate Change (IPCC), 2012). This is of particular concern in developing countries, where exposure to extreme events combines with highly vulnerable populations, to result in disasters. In these cases, government-provided disaster relief can become critical to securing the livelihoods of those affected.
India’s drought relief programme has a long history, going back to the famine codes1 of the pre-independence period (United Nations Development Programme, 2002). Today, India’s drought management programme brings together post-disaster relief and adaptation and mitigation strategies, which seek to build resilience to future weather and climate extremes. In recent research, I study India’s drought relief programme in the states of Andhra Pradesh, Telangana, and Karnataka, between 2008 and 2019 (Tarquinio 2020).
Is drought relief allocated to the drought-affected?
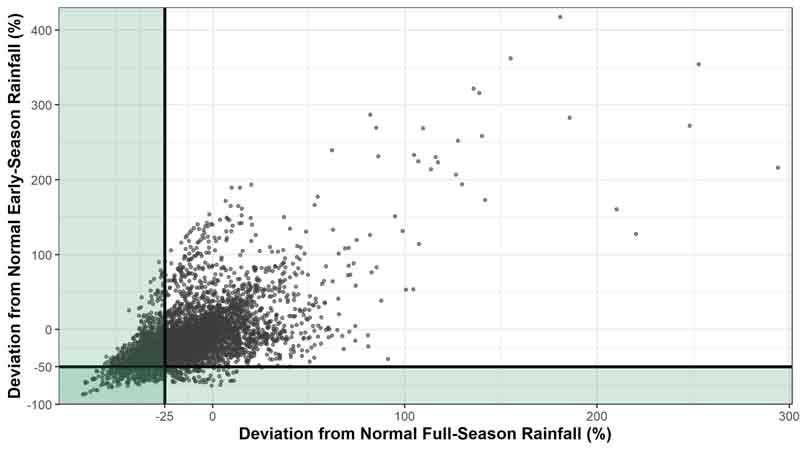
Drought is a complex event that can be difficult to identify. State governments are responsible for allocating joint national and state relief funds to blocks2 through official drought declarations.3 Once a block receives an official declaration, relief is provided in a number of forms, such as food and water, increased public employment, or agricultural input subsidies. To ensure that relief reaches the drought-affected, India’s central government has formulated guidelines for states to follow when allocating drought relief (Department of Agriculture and Cooperation, 2009). According to these guidelines, a block might be considered drought-affected during the kharif4 growing season if early-season rainfall (June-July) is more than 50% below normal, or full-season rainfall (June-September) is more than 25% below normal (shaded regions in Figures 1 and 2 below). Secondary environmental criteria, based on soil moisture or vegetation indices for example, are then used to provide sufficient evidence of drought.5 While blocks that meet one or both of the rainfall criteria are more likely to receive an official drought declaration, I find that many of these blocks do not actually receive relief (see Figure 1). This fact is not concrete evidence that states do not follow guidelines, as blocks that did not receive a declaration may have not met the secondary environmental criteria for determining drought occurrence. However, Figure 2 demonstrates that during this period many declarations were allocated to blocks that do not meet either of the rainfall criteria – in fact, declarations are allocated to blocks where rainfall is normal (deviation of 0) or even above normal. This indicates that state governments are not strictly adhering to national guidelines.
Figure 1. Rainfall in blocks without an official drought declaration
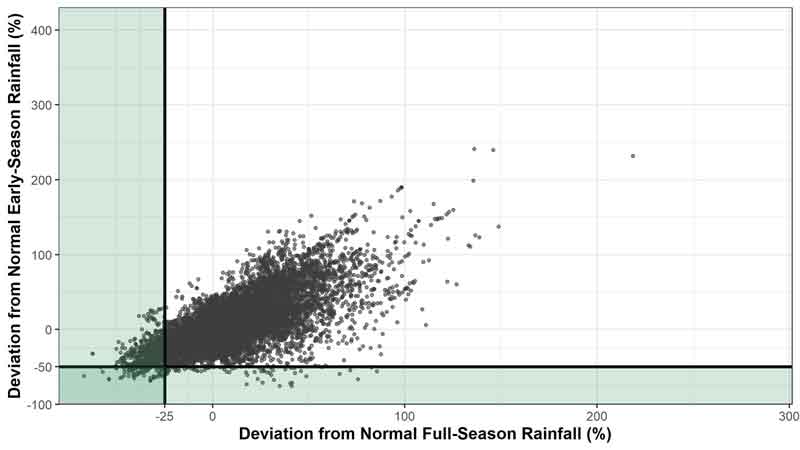
Figure 2. Rainfall in blocks with an official drought declaration
Do political incentives play a role?
Should we be concerned that state governments do not follow national guidelines for the allocation of drought relief? The answer depends on whether states manipulate declarations based on incentives other than improving welfare. For example, do state governments use drought relief to further their own political motives? Existing work suggests that voters might reward the state ruling party for the provision of drought relief (Cole et al. 2012). In this case, the state will provide relief to blocks where the increase in political support will have the greatest impact in helping it win re-election.
A concern in trying to identify such patterns of political manipulation is that when estimating the relationship between electoral incentives and the allocation of relief, unobserved factors (for example, unavailable data on past drought declarations) might bias the results.6 To overcome this issue, I use standard econometric techniques to measure variation in the ruling party’s vote margin7 that is meant to exclude local changes in political support influenced by past declarations.8 I find that a 10% closer vote margin increases a block’s likelihood of receiving a drought declaration by 9 percentage points, relative to an average likelihood of 33%. Again, I use standard econometric techniques, described in Tarquinio (2020), to show that blocks where the ruling party won the previous election (politically aligned blocks) are less likely to receive a declaration. Political alignment is associated with an increased likelihood of re-election for the ruling party and so the return to providing a declaration is lower in aligned blocks.
Comparing benefits from drought relief across areas
The preceding results demonstrate that deviations from national guidelines are partly motivated by the re-election concerns of state ruling parties. Is it still possible these deviations could be explained by states acting on private information regarding other dimensions of local need that are not captured in official rainfall-based measures of drought? If that were the case, we would expect the incremental benefit from drought relief in areas not meeting the official definition of drought to be similar to the incremental benefits in areas that did meet the official definition. To test this, I estimate whether the correlation between receiving an official drought declaration and a block’s agricultural production in the following year varies by rainfall.9
I group blocks into quintiles based on the distribution for blocks’ percentage of normal full-season rainfall in the prior year, when declarations were allocated. The first quintile consists of blocks where rainfall was at least 22% below normal, nearly aligning with the 25% cut-off for identifying drought in the national guidelines. Blocks in the middle quintile experience about normal rainfall, while blocks in the fifth quintile experience high levels of rainfall (at least 28% above normal). Figure 3 below compares blocks that received a declaration to those that did not, within a given quintile, when accounting for block-specific characteristics, state-specific annual variation, and contemporaneous environmental measures. As shown, a drought declaration provided to a drought-affected block (first quintile) is positively correlated with agricultural production in the following year. Declarations are also associated with higher agricultural production in blocks with moderate drought (second quintile) or high levels of rainfall (fifth quintile). On the other hand, this positive correlation does not exist for declarations provided to blocks with normal or just-above-normal rainfall.
Figure 3. Drought declarations and agricultural production, by rainfall levels
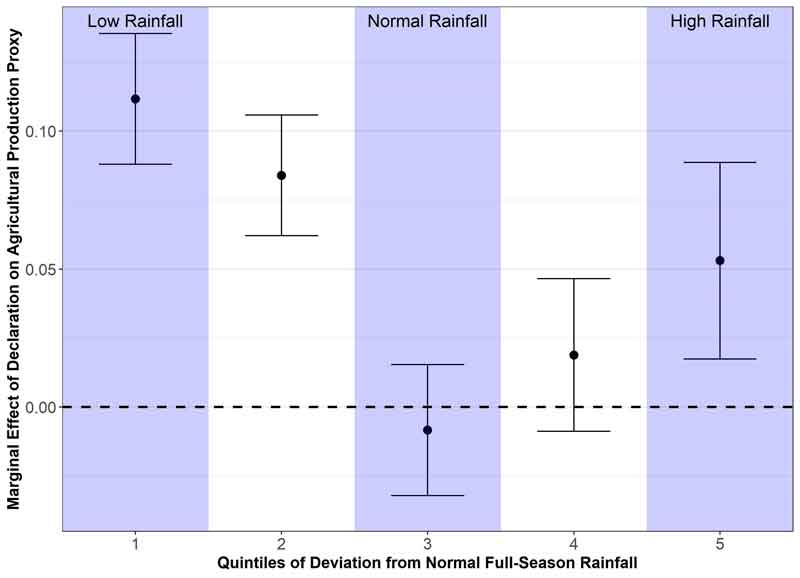
I demonstrate that these results are not sensitive to controlling for additional environmental measures (both in the current and prior year) or political variables that may influence this relationship. Likewise, I show that the results are unlikely to be driven by drought-affected blocks being given more relief funds, for example. While this analysis does not provide the causal effect of receiving drought declarations on agricultural production, it provides strong suggestive evidence that relief is misallocated. Declarations could be taken away from blocks with normal or just-above-normal rainfall (third and fourth quintile) where the correlation with agricultural production is not different from 0 and given to drought-affected blocks where the declaration is associated with about an 11% rise in the proxy measure for agricultural production.
Importantly, this study shows that when state governments are allowed to exercise discretion, political manipulation occurs. Further, I provide suggestive evidence that following national guidelines – in particular the rainfall-based criteria – could improve agricultural outcomes in these states. In sum, the findings of my research suggest that adhering to national guidelines could enhance both efficiency and fairness in the allocation of official drought declarations.
I4I is now on Telegram. Please click here (@Ideas4India) to subscribe to our channel for quick updates on our content
Notes:
- The famine codes were a post-disaster management programme that sought to limit deaths due to starvation.
- Block is an administrative subdivision at the district level.
- While I use the terms ‘declaration’ and ‘relief’ interchangeably, it is the allocation of these official drought declarations, or indicators for receiving non-zero relief, that I study.
- Kharif crops are crops that are cultivated and harvested in the monsoon season.
- The construction of block-level rainfall measures, depicted in Figures 1 and 2 (and referenced throughout the article), is described in Tarquinio (2020) and uses rainfall data from the India Meteorological Department (Pai et al. 2014) and maps (shapefiles) for each state (the map for Andhra Pradesh and Telangana is from ML InfoMaps).
- Consider, for example, an area that received a drought declaration in the prior election cycle. The declaration increased support for the ruling party and so likely increased that party’s vote share in the last election. The method used to identify the relationship between electoral incentives (election outcomes) and relief allocation should account for this change in the vote share but this is not possible when the history of drought declarations is not available. For this reason, I use an alternative approach for dealing with this concern.
- The ruling party’s vote margin, or the difference between the ruling party’s and opposition party’s vote share, is a measure of electoral competition for the ruling party in each constituency and election.
- For details on the estimation approach and official electoral data used, see Tarquinio (2020).
- Agricultural production data is not available at the block level and so I use a measure of crop performance derived from a satellite-based vegetation index (NDVI data from Didan (2015)) as a proxy as described in Tarquinio (2020) (this NDVI difference measure follows from Asher and Novosad (2020).
Further Reading
- Asher, Sam and Paul Novosad (2017), “Politics and local economic growth: Evidence from India”, American Economic Journal: Applied Economics, 9 (1): 229-73. Available here.
- Cole, Shawn, Andrew Healy and Eric Werker (2012), “Do voters demand responsive governments? Evidence form Indian disaster relief”, Journal of Development Economics, 97(2): 167-181.
- Department of Agriculture and Cooperation (2009), ‘Manual for drought management’, Ministry of Agriculture, Government of India.
- Didan, K (2015), ‘MOD13A2 MODIS/terra vegetation indices 16-day l3 global 1km sin grid v006’, NASA EOSDIS Land Processes DAAC.
- Field, CB, V Barros, TF Stocker, D Qin, DJ Dokken, KL Ebi, MD Mastrandrea, KJ Mach, GK Plattner, SK Allen, M Tignor and PM Midgley (2012), ‘Managing the risks of extreme events and disasters to advance climate change adaption (A Special Report of Working Groups I and II of the Intergovernmental Panel on Climate Change)’, Intergovernmental Panel on Climate Change, New York, NY, USA.
- Tarquinio, L (2020), ‘The politics of drought relief: Evidence from Southern India’, Institute for Economic Development (IED) Working Paper No. 354.
- Pai, D, L Sridhar, M Rajeevan, O Sreejith, N Satbhai and B Mukhopadhyay (2014), “Development of a new high spatial resolution (0.25x0.25) long period (1901-2010) daily gridded rainfall data set over India and its comparison with existing data sets over the region”, MAUSAM, 65 (1): 1-18.
- United Nations Development Programme (2002), ‘A climate risk management approach to disaster reduction and adaptation to climate change’, United Nations Development Programme Expert Group Meeting Report.

Comments will be held for moderation. Your contact information will not be made public.