

 18 July, 2022


The Covid-19 crisis and the subsequent recession has brought about a shift in financial savings; households have cut back on consumption and reduced their demand for credit, and banks tightened lending due to asset quality concerns. Looking at the trends in deployment of credit across different sectors of the economy, in this post Isha Gupta highlights the rising share of household credit in the form of credit cards and other personal loans, and its implications for economic recovery.
The unprecedented outbreak of the Covid-19 pandemic and the resultant lockdowns on domestic movement severely disrupted supply chains, blocked manufacturing activities and dislocated labour. As these disruptions were felt in the form of income and demand-side shocks, it depressed aggregate demand further, with the postponement of non-essential consumption. This triggered an extensive crisis at a time when the Indian economy had already been undergoing a lacklustre performance. Unlike past crises, the significantly lower financial and physical savings at the outset of the lockdown period made it difficult for Indian households to absorb income losses.
Debt, savings and liabilities of Indian households
The prolonged downward trend of the Indian economy during the 2010s at first stemmed from the weakening of domestic demand conditions in the home market owing to a shrinking consumption base. This overturned the euphoria of the 2000s, which was steered by all the primary engines of growth – such as consumption and private investment – and marked the beginning of a sharp structural slowdown.
When we consider the data on household debt to GDP ratio from FY2000-01 to FY2018-19, we observe a commonality in how this ratio peaked across growth cycles during the decades following 2000 and 2010 (Figure 1). This ratio, which had previously peaked at 10.2% in the high-growth phase of 2003-2008, reached 10.9% in the low-growth years of 2015-2018. As of March 2020 and March 2021, this figure stood at 12.4 and 14.5% of GDP respectively. Parallelly, the growth rate of financial liabilities of households, which hit a high of 53% in the 2000s, also increased significantly to 58% in the post-demonetisation period.
Figure 1. Household debt as a percentage of GDP and growth rates of household financial assets and liabilities
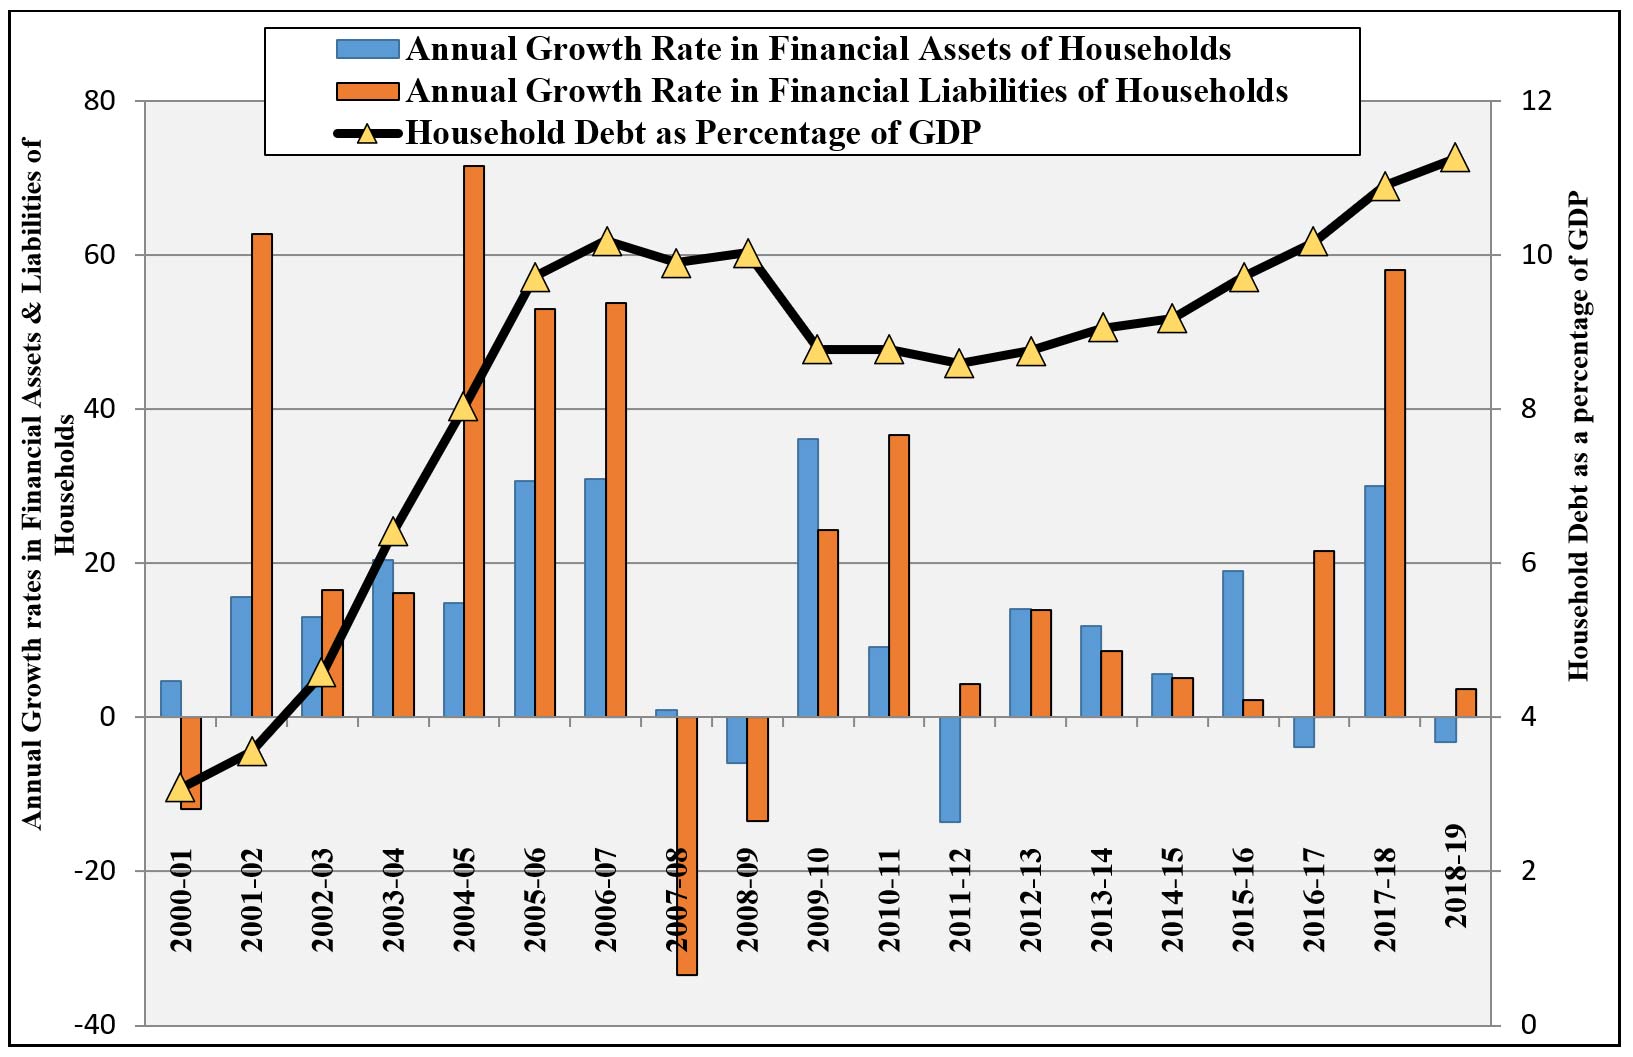
Source: RBI Handbook of Statistics on the Indian Economy 2020-21, CEIC Data
However, as households accumulated their financial liabilities, the 2000s also witnessed a continued upward trajectory in households’ savings, together with an improved physical investment rate1 that reached an average of 23.8% and 12.7% of GDP respectively (Mohan 2008) and economic growth which averaged 9% in real terms during this period. In contrast, a feature of the 2010s has been the incessant decline in all forms of household savings since FY2011-12, of which households’ fixed investment (particularly household investment in ‘Dwellings and Other Building Structures’2) has faced a steep decline (Table 1).
Table 1. Household savings
|
2011-12 |
2012-13 |
2013-14 |
2014-15 |
2015-16 |
2016-17 |
2017-18 |
2018-19 |
|
|
Household saving as a proportion of gross savings |
68.24 |
66.34 |
63.34 |
60.67 |
57.79 |
57.76 |
59.17 |
60.33 |
|
Proportion of net saving in household disposable income |
25.93 |
24.33 |
21.57 |
20.97 |
19.23 |
19.63 |
21.12 |
19.37 |
|
Household saving as a proportion of GDP |
23.64 |
22.48 |
20.34 |
19.56 |
17.97 |
18.11 |
19.17 |
18.17 |
|
Gross fixed capital formation (GFCF) by households as a proportion of GDP |
15.75 |
14.63 |
12.52 |
12.06 |
9.41 |
10.28 |
11.03 |
11.37 |
|
Investment by households in dwellings & other building structures as a proportion of GDP |
12.85 |
11.61 |
11.11 |
10.24 |
7.31 |
7.26 |
7.49 |
7.76 |
|
Household financial assets as a proportion of GDP |
10.68 |
10.7 |
10.6 |
10.08 |
10.86 |
10.49 |
12.05 |
10.52 |
Source: Computed from National Accounts Statistics (NAS) 2019 and RBI Handbook of Statistics on the Indian Economy 2020-21
Since FY 2011-12, the Indian economy has experienced a drastic downfall in the fixed investment rate, which has been languishing at around 30% of GDP. Taking into consideration the institutional break-up of fixed investment, while private corporate investment remained fairly sluggish at approximately 11.5% of GDP, it is the steep decline in households’ fixed investment that explains most of the deterioration in overall fixed investment during this period.
Slower growth in the purchase of houses is also reflected in stalled real estate projects, which have led to a build-up of unsold inventory over the years, which in turn has subdued the rate of growth of housing prices since FY2015-16 (Reserve Bank of India (RBI), 2019a, 2019b). Furthermore, as household savings in physical assets nosedived, neither household savings in gold and silver, nor net household financial savings rose as a proportion of GDP, which implies that these resources were typically expended on consumption.
Households’ financial liabilities rose sharply since FY2011-12 during the post-demonetisation years because of a sudden drop in the weighted average lending rates (WALR)3 of banks in an environment of surplus liquidity (Table 2).
Table 2. Household debt, financial liabilities, consumption expenditures and weighted average call rates (WACR)4
|
2011-12 |
2012-13 |
2013-14 |
2014-15 |
2015-16 |
2016-17 |
2017-18 |
2018-19 |
|
|
Household final consumption expenditure as a proportion of GDP |
56.21 |
56.46 |
57.65 |
58.13 |
59.01 |
59.29 |
59.02 |
59.32 |
|
Household final consumption expenditure as a proportion of household disposable incomes |
73.19 |
73.94 |
75.52 |
77.36 |
79.01 |
79.87 |
80.05 |
79.28 |
|
Household financial liabilities as a proportion of GDP |
3.32 |
3.32 |
3.19 |
3.02 |
2.79 |
3.04 |
4.32 |
4.04 |
|
Household financial liabilities as a proportion of household disposable incomes |
4.32 |
4.35 |
4.18 |
4.02 |
3.75 |
4.1 |
5.86 |
5.39 |
|
Household debt as a proportion of household disposable incomes |
11.19 |
11.47 |
11.86 |
12.22 |
13.02 |
13.69 |
14.79 |
15.05 |
|
Annual WACR |
8.22 |
8.09 |
8.28 |
7.97 |
6.98 |
6.25 |
5.94 |
6.27 |
Source: Computed from NAS (2019), RBI Handbook of Statistics on the Indian Economy 2020-21 and CEIC Data
This decline in the overall cost of household borrowing resulted in co-movement with the share of household consumption expenditures, which also rose during this period. However, towards the end of FY2018-19 household liabilities and financial savings, which showed positive signs of marginal decrease and increase respectively, have been put to the test again amid the Covid-19 crisis. This suggests that the build-up of household leverage in pre-pandemic years, accompanied by the consistent diminution of all forms of household savings – that could have provided adequate cushion at the time of pandemic – is now posing a risk for stimulating consumption, infusing business confidence and steering economic recovery.
Credit deployment across organisations and occupations
Analysing time-series data on outstanding loans by type of organisation and occupation (Figure 2)5 indicates that the share of credit to private corporate sector decreased since FY2014-15; the share of the household sector increased to 50.2%; and the share of credit to other categories remained mostly unchanged.
Figure 2. Organisation-wise distribution of outstanding credit
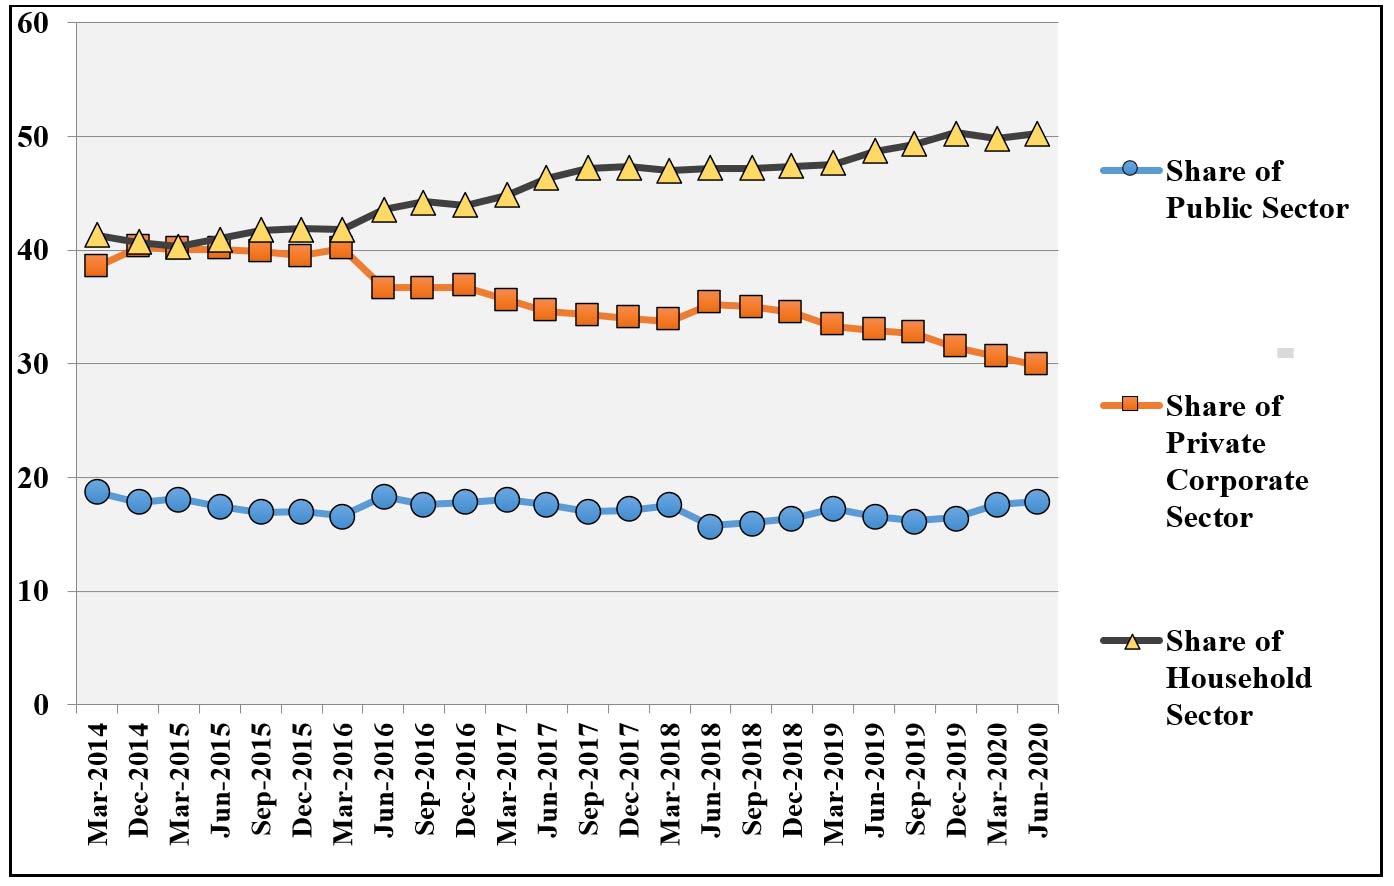
Source: Computed from RBI Reports on ‘Outstanding Credit of Scheduled Commercial Banks’ 2020-21
Correspondingly, the occupation-wise distribution of outstanding credit (Figure 3) points to a striking slowdown in credit to industry. Whereas credit to services has increased only mildly, and that of agriculture has stayed more or less constant. It points to the shift in the lending pattern of bank credit from industry to personal loans in these years. This shift in credit allocation can be explained by the mounting debts of private corporate sector. As the non-performing assets of commercial banks from advances for infrastructure loans mounted, banks curbed the flow of credit to industry, which was reeling under overstretched balance sheets.
Figure 3. Occupation-wise distribution of non-food credit
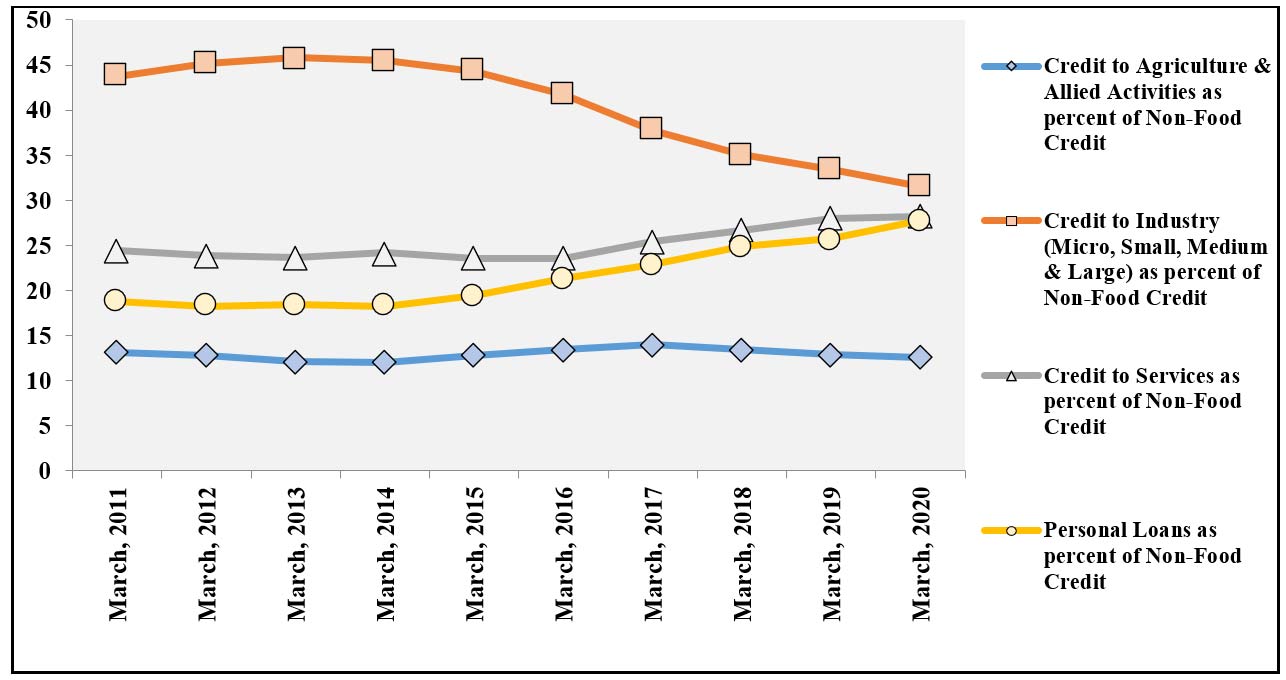
Source: Computed from RBI Reports on ‘Outstanding Credit of Scheduled Commercial Banks’ 2020-21
Concurrently, retail lending6 exposure had remained inconsequential, reflected in its low default rates. Considering that India has a relatively low ratio of personal loans to personal disposable incomes, compared to other developing countries, retail lending provided enormous prospects for expanding credit in this underexploited area. Therefore, with the withdrawal of industrial credit, lending for personal loans experienced a remarkable surge, particularly in the post-demonetisation period.
Within personal loans, the subcategories of ‘credit cards outstanding’ and ‘other personal loans’ have recorded maximum growth (Gupta 2022). Figure 4 indicates that both shot up in the post-demonetisation period. While ‘vehicle loans’ have been revealing signs of retreat, lending for ‘education’ and ‘consumer durables’ signify marked deterioration, whereas ‘housing loans’ show stagnation over the given period. This is also supported by the fact that the share of unsecured loans increased from 2.4 to 4.1% of GDP between FY2015-16 and FY2019-20, whereas the share of housing loans increased from 5.5 to 6.5% and those of vehicle, education and consumer durable loans diminished noticeably in the same time. This lending pattern is also observed in the data on retail loans sanctioned by non-banking financial companies (NBFCs), an added source of credit to households in the post-demonetisation period, where the shares of both ‘credit card receivables’ and ‘other retail loans’ in outstanding NBFC retail credit have shown unwavering growth since March 2017 (Gupta 2022).
Figure 4. Components of outstanding personal loans
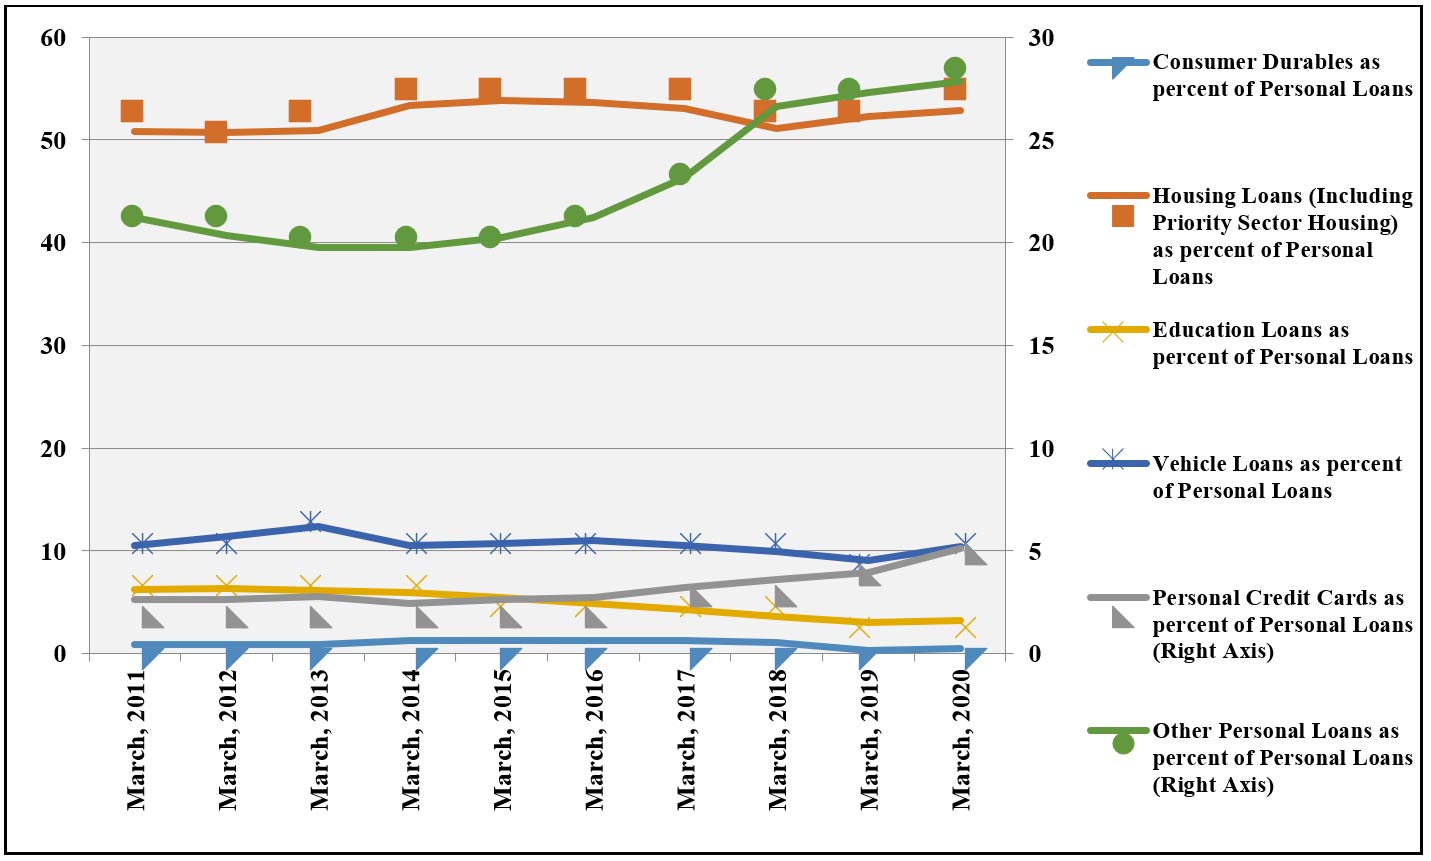
Source: Computed from RBI Reports on ‘Outstanding Credit of Scheduled Commercial Banks’ 2020-21
Policy implications
Demonetisation caused sudden increases in deposits and created large surplus liquidity conditions in the banking system. This, in turn, allowed several banks to substantially lower their WALR on both outstanding and fresh-rupee loans even when the policy rates changed only slightly – significantly reducing the overall cost of borrowing. Spurred by cashless modes of transactions, and together with the penetration of smartphones and cheap mobile data, Indian households demonstrated digital preparedness through increased transactions from retail electronic payments, whose growth surged in both volume and value (RBI, 2017). The demand for the unsecured loan segment increased and provided room for the fast growth of these products from a large proportion of credit-underserved population (TransUnion 2019a, 2019b, 2020, Gupta 2022).
As a result, financial institutions extensively dealt in credit cards and other personal loans. This also facilitated in shoring up their profit margins, since interest rates charged on these segments is much higher than other advances. This examination therefore ascertains that with easy availability of credit for personal loans, Indian households increasingly accumulated debt in short-term smaller-valued consumer lending products, in addition to significantly cutting down on their savings over this period, which is uncharacteristic of their perpetually savings-prone and debt-averse outlook.
As financial institutions enormously expanded the scope of their operations during the expansionary phase of retail lending in post-demonetisation years, they encouraged borrowing excesses by households, who were induced to spend future incomes using credit. This not only drained excess liquidity from the system, but also channelled credit through the expansion of digital footprints in the economy, with a pile up of household debt in the process.
As more and more households were accumulating debt, it fuelled an artificial stimulus to consumption which was unsustainable. The jolt of Covid-19 – which caused job losses, a shrinkage of real incomes and curtailment in purchasing power – may severely jeopardise households’ ability to service debt. This also inflates the debt-to-income ratio for households, which implies that interest on existing debt accumulates, even when incomes are not rising fast enough– this provokes them to lower their future consumption below disposable incomes. This could mean that households would react to the current economic disturbance by drastically curtailing discretionary consumption and adding to their savings in order to repay existing debts. Unfortunately, this temperance could instigate an overall shortfall in aggregate demand, stall business appetite for fresh investments, curb employment growth and stifle economic recovery.
Notes:
- Physical savings (or physical investment rate) includes savings by households in physical assets such as land, and in the form of gold and silver ornaments.
- ‘Dwellings and Other Building Structures’ is a component of GFCF by households, which includes investments in housing, residential buildings and home improvements.
- WALR of scheduled commercial banks is the interest rate charged on all the outstanding loans of a bank.
- Call money rate (or WACR) is the interest rate at which short-term funds are borrowed and lent in the money market. Banks resort to these loans to fill the asset liability mismatch, comply with the Cash Reserve Ratio (CRR) and Statutory Liquidity Ratio (SLR) requirements and to meet the sudden demand of funds. The RBI, banks and primary dealers are the participants of the call money market.
- The database on Indian economy (DBIE) of the RBI provides data on outstanding credit of scheduled commercial banks under various categories. However, outstanding credit of the scheduled commercial banks accruing to the household sector can be obtained from the categories of organisation- and occupation-based classifications. Organisation-based classification categorises the outstanding credit across public sector, co-operative sector, private corporate sector, households, micro-finance institutions and non-profit institutions serving households. On the other hand, occupation-based classification categorises the outstanding credit on the basis of sector-wise distribution between agriculture, industry, transport operators, professional services, personal loans, trade, finance and others, where household credit is derived from ‘personal loans’ (or retail loans) that include advances for consumer durables, housing, advances against fixed deposits, credit cards outstanding, education loans, vehicle loans etc.
- Retail lending is defined as credit extended to individuals for household, family, and other personal expenditures.
Further Reading
- Chandrasekhar, CP (2020), “Revisiting the NBFC Crisis”, Economic & Political Weekly, 55(2).
- Gupta, Isha (2022), “India’s Household Leverage and the COVID-19 Crisis: Ramifications for the Post-pandemic Recovery Phase”, Economic & Political Weekly, 57(18).
- Mohan, Rakesh (2008), “Growth Record of the Indian Economy, 1950-2008: A Story of Sustained Savings and Investment”, Economic & Political Weekly, 43(19).
- RBI (2017), ‘Bulletin, November 2017’, Reserve Bank of India.
- RBI (2019a), ‘Monetary Policy Report, April 2019’, Reserve Bank of India.
- RBI (2019b), ‘Monetary Policy Report, October 2019’, Reserve Bank of India.
- RBI (2020a), ‘Bulletin, June 2020’, Reserve Bank of India.
- RBI (2020b), ‘Economic Review, 2019-20’, Reserve Bank of India.
- Bertrand, M, K Krishnan and H Schofield (2020), ‘How are Indian households coping under the COVID-19 lockdown? 8 key findings’, Rustandy Center for Social Sector Innovation Blog, 11 May.
- TransUnion CIBIL (2019a), ‘Industry Insights Report - Quarterly overview of consumer credit trends (Third Quarter 2018)’, TransUnion CIBIL Limited.
- TransUnion CIBIL (2019b), ‘Industry Insights Report- Quarterly overview of consumer credit market (Second Quarter 2019)’, TransUnion CIBIL Limited.
- TransUnion CIBIL (2020), ‘Industry Insights Report - Quarterly overview of consumer credit market (Third Quarter 2019)’, TransUnion CIBIL Limited.

Comments will be held for moderation. Your contact information will not be made public.