

 18 April, 2024


Cereal production in India recently crossed 300 million tonnes for the first time. In this post, Drèze and Oldiges point out that a major gap has emerged between the net availability of cereals and household consumption – and it is unclear where the balance goes. With cereal production expected to increase further, they argue that there is a looming inconsistency between pricing policy and the realities of cereal demand.
Cereal production in India recently crossed 300 million tonnes for the first time. If we take an average of annual cereal production over the last three years for which estimates are available (2021-22 to 2023-24), it comes to 293 million tonnes – still very close to 300 million.2 Meanwhile, as discussed in this post, household consumption is unlikely to be more than 200 million tonnes. There is a comfortable margin there, and it may grow in the near future: cereal production has been growing at 2.5% per year in the last 10 years, more than twice as fast as population growth.2
To some extent, the margin has been absorbed by record cereal exports in recent years: 23 million tonnes in 2020-21, 32 million tonnes in 2021-22, and another 31 million tonnes in 2022-23 despite a ban on wheat exports from May 2022 onwards.3 Where the remaining margin goes is not very clear, as discussed below. This lack of clarity, along with the uncertain scope of future exports, is a lurking challenge for foodgrain policy. Before elaborating on this, consumption figures call for a closer look.
Cereal consumption
The latest estimates of per-capita cereal consumption (PCCC) in India pertain to 2011-12: 11.6 kg per month according to the second India Human Development Survey (IHDS-2), and just 10.7 kg per month according to the National Sample Survey (NSS) (Table 1). If the same PCCC figures apply today, and assuming that India’s population is around 1.4 billion, total household consumption must be somewhere between 180 and 195 million tonnes. This is more than 100 million tonnes below current production levels.
Table 1. Per-capita cereal consumption (PCCC, kg/month)
| 2004-05 | 2011-12 | ||||||
|---|---|---|---|---|---|---|---|
| Rural | Urban | Total | Rural | Urban | Total | ||
| IHDS | 12.4 | 9.8 | 11.8 | 12.3 | 9.8 | 11.6 | |
| NSS | 12.1 | 9.9 | 11.6 | 11.3 | 9.4 | 10.7 | |
Source: Authors’ calculations based on IHDS-1, IHDS-2 and NSS (61st and 68th Rounds) data.
There is a view that this shortfall is a symptom of under-consumption, itself due to endemic poverty. If so, one might expect it to decline as and when incomes rise and poverty goes down.
This view is consistent with the conventional understanding of cereal consumption patterns in India, largely based on NSS data. In that understanding, cereal consumption increases steadily as monthly per-capita expenditure (MPCE) rises. This is plausible enough at very low levels of income or expenditure. NSS data, or rather cross-sectional NSS data, suggest that it applies across the per-capita expenditure scale, at least in rural areas (Oldiges 2012, Table 3; Deaton and Drèze 2009, Figure 2). That, however, jars a little with casual observation: it is doubtful that people keep eating more and more cereals when their purchasing power increases, as opposed to diversifying towards more nutritious items such as pulses, dairy products, fruit, meat and fish. The cross-sectional pattern observed in NSS data is also at odds with time-series NSS data: cereal consumption declined steadily from the 1970s onwards, especially among better-off sections of the population, despite rising per-capita expenditure (Oldiges 2012, Table 2). NSS-based cereal consumption patterns are summarised in Figures 1 and 2.
Figure 1. PCCC trends
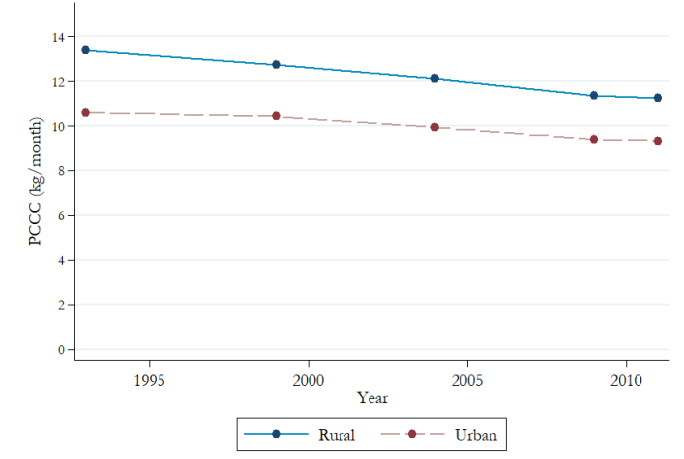
Source: NSS Reports 555, Table 16.
Figure 2. PCCC by MPCE decile (NSS data)
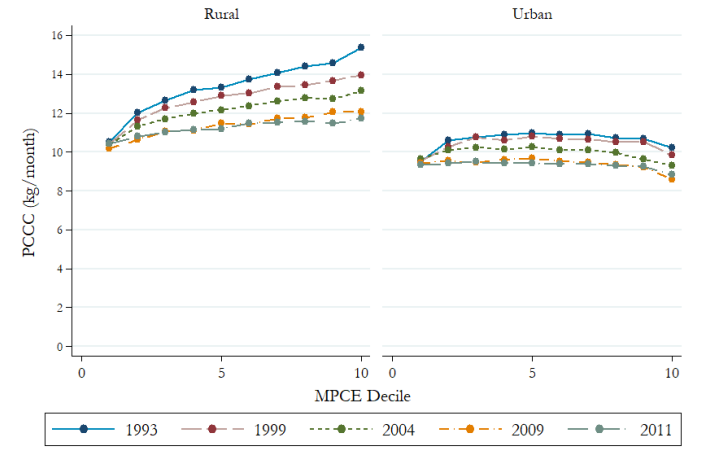
Source: Authors' calculation based on NSS Report 555, Table 18.
One of us re-examined cereal consumption patterns a few years ago based on 2004-05 data from the first India Human Development Survey (IHDS-1). This dataset, unlike NSS consumption surveys, includes data on per-capita income in addition to per-capita expenditure. It suggests that PCCC is about the same at different levels of per-capita income. In other words, the income elasticity of demand for cereals is close to zero. On the other hand, PCCC does vary substantially with education levels, occupation, and place of residence (rural or urban). For instance, it is negatively related to levels of education, possibly because more educated people have lower activity levels, or because they are more aware of the importance of diversifying food intake. These variations are consistent with the fact that PCCC has been declining over time in the last 50 years, in spite of rising per-capita incomes.
If the income elasticity of demand for cereals is close to zero (except at very low income levels), there is no reason to believe that India has a serious under-consumption problem.4 Further, cereal consumption is unlikely to rise faster than population growth (less than 1% per year) in the near future.
The IHDS-2 survey makes it possible to take another look at these consumption patterns and how they change over time. Figure 3 displays PCCC levels in different deciles of the monthly per-capita income (MPCI) scale in 2004-05 and 2011-12, separately for rural and urban areas.5 Average PCCC is much the same in both survey years (see also Table 1), and significantly higher in rural areas than in urban areas. In both years, PCCC looks roughly the same at different levels of MPCI.6
Figure 3. PCCC by MPCI decile (IHDS data)
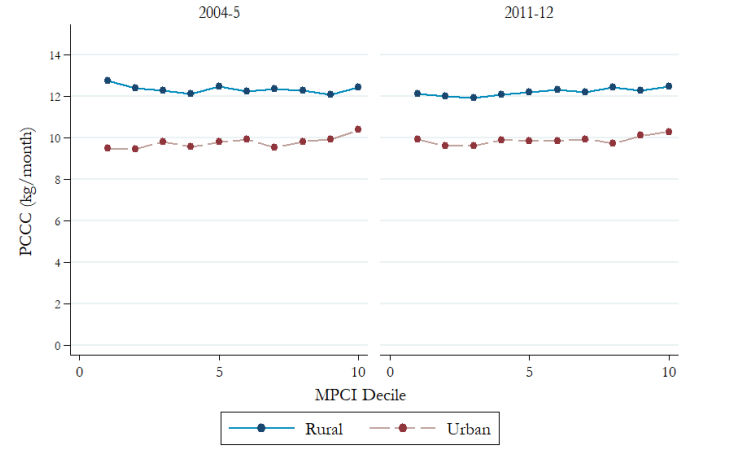
Source: Authors' calculation based on IHDS-1 and IHDS-2 data
![]()
Patterns across socioeconomic groups
A similar pattern applies when we look at specific socioeconomic groups. The point is illustrated in Figure 4, where we present the relation between PCCC and MPCI for different social categories in 2011-12. This figure pertains to rural areas, but similar patterns are observed in urban areas. For every socioeconomic group except Adivasis (tribal populations), PCCC is around the same at different levels of per-capita income.
Figure 4. PCCC by MPCI decile in different social groups (IHDS-2, rural)
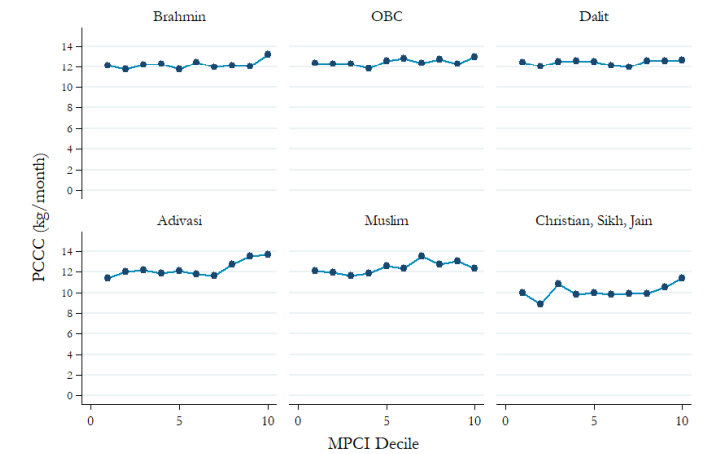
Source: Authors' calculation based on IHDS-2 data
This relation, of course, reflects the effect of MPCI and other variables (such as education levels and occupation) that may be correlated with MPCI. It helps therefore to look at it in a ‘multivariate’ framework. We do this in Table 2 based on 2011-12 data. The results are similar to those of an earlier analysis based on IHDS-1 data (Oldiges 2012): PCCC is more or less unrelated to per-capita income per se, but it does vary by education levels, occupation groups and place of residence.
Table 2. OLS regressions (dependent variable: PCCC, 2011-12)
| Rural | Urban | ||||
|---|---|---|---|---|---|
| PCCC | PCCC (log) | PCCC | PCCC (log) | ||
| MPCI (in logs) | 0.316∗∗∗ | 0.030∗∗∗ | 0.214∗∗∗ | 0.019∗∗∗ | |
| (0.048) | (0.004) | (0.058) | (0.006) | ||
| 1st Quintile × MPCI (in logs) | 0.007 | 0.001 | 0.015 | 0.002 | |
| (0.016) | (0.001) | (0.016) | (0.002) | ||
| Education dummies (Default: No education) | |||||
| Grade 1-4 | -0.466∗∗∗ | -0.019∗∗ | -0.498∗∗∗ | -0.038∗∗ | |
| (0.118) | (0.009) | (0.193) | (0.019) | ||
| Primary | -0.599∗∗∗ | -0.055∗∗∗ | -1.119∗∗∗ | -0.073∗∗∗ | |
| (0.111) | (0.009) | (0.182) | (0.018) | ||
| Grade 6-9 | -0.860∗∗∗ | -0.055∗∗∗ | -1.268∗∗∗ | -0.098∗∗∗ | |
| (0.083) | (0.007) | (0.134) | (0.013) | ||
| Secondary | -1.231∗∗∗ | -0.092∗∗∗ | -1.635∗∗∗ | -0.126∗∗∗ | |
| (0.103) | (0.008) | (0.144) | (0.014) | ||
| Higher Secondary | -1.615∗∗∗ | -0.130∗∗∗ | -1.924∗∗∗ | -0.153∗∗∗ | |
| (0.111) | (0.009) | (0.147) | (0.014) | ||
| Graduate | -1.836∗∗∗ | -0.135∗∗∗ | -2.390∗∗∗ | -0.198∗∗∗ | |
| (0.119) | (0.009) | (0.142) | (0.014) | ||
| Occupation dummies (Default: Salaried) | |||||
| Agriculture | 0.912∗∗∗ | 0.069∗∗∗ | 1.504∗∗∗ | 0.137∗∗∗ | |
| (0.109) | (0.009) | (0.188) | (0.019) | ||
| Agri. wage labour | 0.635∗∗∗ | 0.049∗∗∗ | 0.458∗∗ | 0.040∗ | |
| (0.125) | (0.010) | (0.208) | (0.021) | ||
| Non agri. wage labour | 0.275∗∗ | 0.021∗∗ | 0.302∗∗∗ | 0.025∗∗∗ | |
| (0.115) | (0.009) | (0.095) | (0.009) | ||
| Artisan | -0.031 | 0.019 | 0.141 | 0.010 | |
| (0.264) | (0.021) | (0.206) | (0.020) | ||
| Petty shop | 0.139 | 0.019∗ | 0.067 | -0.001 | |
| (0.143) | (0.011) | (0.093) | (0.009) | ||
| Organised business | 0.250 | 0.000 | -0.338∗ | -0.048∗∗ | |
| (0.460) | (0.036) | (0.204) | (0.020) | ||
| Profession | 0.566 | 0.001 | -0.275 | -0.027 | |
| (0.460) | (0.037) | (0.348) | (0.034) | ||
| Pension/rent etc. | 0.604∗∗∗ | 0.038∗∗∗ | 0.298∗∗ | 0.029∗∗ | |
| (0.175) | (0.014) | (0.139) | (0.014) | ||
| Other | 0.457∗∗ | 0.038∗∗∗ | 0.532∗∗∗ | 0.006 | |
| (0.186) | (0.015) | (0.185) | (0.018) | ||
| Household (HH) size | -0.536∗∗∗ | -0.040∗∗∗ | -0.442∗∗∗ | -0.041∗∗∗ | |
| (0.015) | (0.001) | (0.016) | (0.002) | ||
| Landholding size | 0.003∗∗∗ | 0.000∗∗∗ | |||
| (0.001) | (0.000) | ||||
| Elderly in HH (%) | -0.039 | -0.035∗∗∗ | -0.021 | -0.066∗∗∗ | |
| (0.129) | (0.010) | (0.165) | (0.016) | ||
| Children in HH (%) | -5.104∗∗∗ | -0.385∗∗∗ | -4.389∗∗∗ | -0.415∗∗∗ | |
| (0.153) | (0.012) | (0.173) | (0.017) | ||
| Dependent variable mean | 12.3 | 2.5 | 9.8 | 2.3 | |
| MPCI mean | 1524.2 | 1524.2 | 3027.5 | 3027.5 | |
| Number of households | 26,255 | 26,255 | 12,332 | 12,332 | |
Source: Authors’ calculations based on IHDS-2 data. State dummies included.
Notes: * significant at 10% level; ** significant at 5% level; *** significant at 1% level
To be more precise, in this multivariate approach, the elasticity of PCCC with respect to MPCI is positive, but very small: just 0.03 or so in rural areas7. On the other hand, PCCC declines steadily as education levels increase, for example, urban PCCC is about 20% lower among graduates than among those with no formal education. Occupation also matters, with PCCC being relatively high among farmers and labourers, as one might expect. Also worth noting in passing is the negative coefficient of household size: larger households have a lower PCCC, at a given level of per-capita income. This is a well-known pattern, discussed in Deaton and Paxson (1998).
Income versus expenditure
Figure 5 presents a counterpart of Figure 3, where MPCI is replaced with MPCE and IHDS data are juxtaposed with NSS data. Both datasets suggest that PCCC rises steadily with MPCE in rural areas. If anything, the gradient is steeper in IHDS data than in NSS data. There is a bit of a puzzle here: why would PCCC rise with per-capita expenditure, but not per-capita income?
Figure 5. PCCC by MPCE decile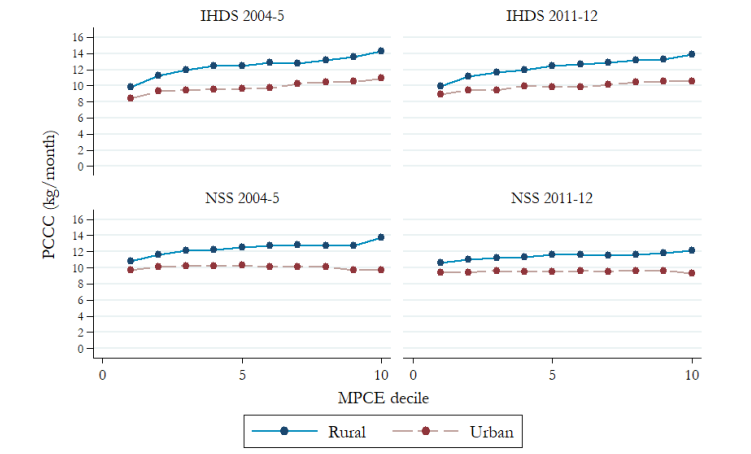
Source: Authors' calculation based on IHDS-1, IHDS-2 and NSS (61st and 68th rounds) data.
One possibility is that there is something spurious or misleading about the positive relationship between PCCC and MPCE, for instance, due to correlated measurement errors. Since MPCE is the sum of item-wise expenditure, including cereal expenditure, PCCC measurement errors would also translate into MPCE measurement errors in the same direction. That would create a spurious positive correlation between PCCC and MPCE even if there is no correlation between the two otherwise. This and related hypotheses are discussed in Subramanian and Deaton (2006), Deaton and Drèze (2009) and Oldiges (2012).
Here is another possibility. PCCC is supposed to measure consumption, but it is possible that some survey respondents confuse it from time to time with purchases. That again, would create a spurious correlation between PCCC and MPCE, much like a measurement error. Bearing in mind that PCCC and MPCE are measured on a monthly basis, while income is measured on an annual basis in IHDS data, this problem would be particularly serious if some people buy cereals in bulk from time to time, for consumption over several months. If they buy cereals in bulk in months of peak earnings, when their non-cereal expenditure also tends to be relatively high, PCCC would be positively related to MPCE on a monthly basis even if it is not related to per-capita income on an annual basis.
The puzzle is yet to be solved, but meanwhile there is a good reason for using MPCI rather than MPCE to assess the relationship between PCCC and purchasing power: MPCI is measured independently of PCCC, MPCE is not. Focusing on MPCI also makes it easier to reconcile that relationship with casual observation as well as trends over time.
Since the data from the 75th Round (2017-18) of the NSS were not released, survey data on cereal consumption are not available beyond 2011-12 at the national level. Interestingly, however, a state-specific report for Maharashtra based on the 75th Round is available and includes a useful summary table on cereal consumption from 1972-73 to 2017-18.8 According to this table, rural PCCC declined (almost monotonically) from 13.3 kg per month in 1972-73 to 9.5 kg in 2011-12, and then further to 8.25 kg per month in 2017-18, with a similar pattern in urban areas. In other words, the trend of declining PCCC continued beyond 2011-12. However, this may or may not be the case at the national level as well.
So what?
The decline of PCCC that occurred in the last few decades is unlikely to be reversed.9 It may continue for some time, say, due to rising urbanisation and education levels, or perhaps it will taper off. Hopefully, the Household Consumer Expenditure Survey, 2022-23 will soon throw some light on current trends. Meanwhile, it seems unlikely that PCCC will exceed 12 kg per month (for rural and urban areas combined) in the near future. As mentioned earlier, this means that aggregate consumption is at least 100 million tonnes below current production levels.
Where is the balance going? Cereals, of course, have other uses than household consumption. The Government of India’s annual Economic Survey traditionally deducts 12.5% for seed, feed and wastage (SFW) to infer “net production” from gross production. Then it calculates “net availability” by adding net imports and deducting changes in public stocks. In both 2004-05 and 2011-12, net availability per capita more or less matched the IHDS and NSS consumption estimates. In recent years, however, a large gap has emerged between net availability and household consumption.
To see this, let us take 12 kg as a plausible upper bound for monthly PCCC from 2011-12 onwards. If we combine this with the Economic Survey’s population estimates, we find a growing gap between net availability and household consumption during the last 12 years. The gap reached 33 million tonnes in 2021-22 and a whopping 45 million tonnes in 2022-23, despite record cereal exports (more than 30 million tonnes) in both years. The trend is illustrated in Figure 6. If we replace the 12 kg norm for monthly PCCC with the NSS estimate of 10.7 kg for 2011-12, then the ‘cereal gap’ shoots up to 66 million tonnes in 2022-23.
Figure 6. The widening cereal gap
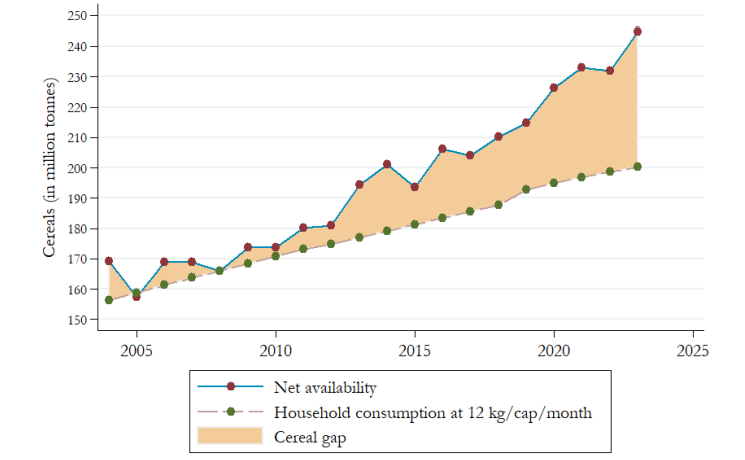
Source: Calculated from Economic Survey data on net availability and population (see text).
Quite likely, the Economic Survey’s “net availability” estimates are inflated by an insufficient SFW allowance. The traditional allowance of 12.5% consists of 5% for seed, 5% for feed and 2.5% for wastage. Independent experts have argued for some time that the 5% norm for feed is too low.10 If we double the feed allowance, from 5% to 10% of gross production, that would reduce the cereal gap by 15 million tonnes or so. A large gap would still remain.
The cereal gap is quite a mystery. Is cereal consumption actually increasing, possibly due to the expansion of the public distribution system (PDS)? Does animal feed absorb much larger quantities than previously thought? Have industrial uses of cereals, to make beer and biscuits for instance, shot up in recent years? It is hard to tell, for lack of data.11
The central government, for one, seems to be in the dark. Indeed, the Economic Survey oddly reduced the SFW allowance from 12.5% to 10% or so in the last few years, when an opposite adjustment was called for. This is yet another symptom of the confusion that seems to pervade Indian statistics today.
The cereal gap, however, is not just a statistical puzzle. It also raises important policy issues related to the rapid growth of cereal production – about 2.5% per year in the last 10 years, as mentioned earlier. Is it time to plan for a major diversification of agricultural production, away from rice and wheat? If so, what are the possibilities, and how are they to be promoted? If not, what are the proposed outlets for enhanced cereal production in the near future? For instance, would it be feasible and desirable for India to plan for a further expansion of cereal exports?
The need to address these questions arises from the fact that cereals are not traded in a competitive market that clears through price adjustment. For cereals, there is a well-defined policy of ensuring remunerative prices for Indian farmers. This commitment makes it necessary to ensure that there is adequate demand at the said prices. It is not at all clear where we are in this respect.
The views expressed in this post are solely those of the authors, and do not necessarily reflect those of the I4I Editorial Board.
Notes
- Calculated from Foodgrains Bulletin, February 2024, page 3.
- Calculated from Economic Survey 2022-23 (Statistical Appendix, Table 1.15) by semi-log regression of cereal production on time from 2013-14 onwards. The most recent production figures, for 2022-23 and 2023-24 (advance estimate), were taken from Foodgrains Bulletin, February 2024. India’s current population growth rate is below 1% per year according to the projections of the National Commission on Population (2020).
- Detailed information on cereal exports is available from the APEDA (Agricultural and Processed Food Products Export Development Authority) portal (apeda.gov.in/apedawebsite/six_head_product/cereal.htm).
- The National Institute of Nutrition’s “recommended daily allowance” for cereals is around 250 gm per person per day or less than 8 kg per month (see, for example, Indian Council of Medical Research (ICMR)-National Institute of Nutrition, 2018). That norm, however, is conditional on a balanced diet.
- The original IHDS income figures pertain to annual income; we have divided them by 12 to put them on a monthly basis.
- ‘Non-parametric regressions’ of PCCC on MPCI lead to the same conclusion.
- This is true for both specifications: log-log and semi-log.
- Government of Maharashtra (2022), Table 2.5.
- One qualification: it is possible that PCCC increased a little since 2011-12 due to the expansion of the public distribution system (PDS), especially after the National Food Security Act (NFSA), 2013 came into force.
- See, for example, Dikshit and Birthal (2010).
- According to data posted at Statista.com, the combined production of biscuits, bread, buns, cookies and croissant was below 1 million tonnes in 2020. This suggests that industrial uses of cereals are of limited help in explaining the cereal gap.
Further Reading
- Deaton, Angus and Christina Paxson (1998), “Economies of Scale, Household Size, and the Demand for Food”, Journal of Political Economy, Vol. 106, No. 5.
- Deaton, Angus and Jean Drèze (2009), “Food and Nutrition in India: Facts and Interpretations”, Economic and Political Weekly, Vol. XLIV, No. 7, 14 February.
- Dikshit, AK and PS Birthal (2010), “India’s Livestock Feed Demand: Estimates and Projections”, Agricultural Economics Research Review, Vol. 23, January-June, pp. 15-28.
- ICMR-National Institute of Nutrition (2018), ‘My Plate for the Day’, NIN, Hyderabad.
- Government of Maharashtra (2022), ‘A Report on “Consumer Expenditure” Based on State Sample Data Collected in 75th Round of National Sampe Survey (July, 2017 – June, 2018)’, Directorate of Economics and Statistics, Mumbai.
- National Commission on Population (2020), ‘Population Projections for India and States 2011-2036’, Ministry of Health & Family Welfare, New Delhi.
- National Sample Survey Office (2014), ‘Level and Pattern of Consumer Expenditure 2011-12’, NSS Report No. 555, Ministry of Statistics & Programme Implementation, New Delhi.
- Oldiges, Christian (2012), “Cereal Consumption and Per Capita Income in India”, Economic and Political Weekly, Vol. 47, Issue No. 06, 11 February.
- Subramanian, Shankar and Angus Deaton (1996), “The Demand for Food and Calories”, Journal of Political Economy, Vol. 104, No. 1.
Comments will be held for moderation. Your contact information will not be made public.