

 10 January, 2022


Two recently documented facts run counter to the conventional wisdom that economic development leads to better health: the absence of a clear link between income and nutritional status in developing countries; and the increased prevalence of metabolic disease, among normal individuals, that is, those who are not necessarily overweight, with economic development. This article provides a single explanation for these seemingly unrelated observations.
The pre-modern economy was characterised by wide short-term fluctuations in food supply across seasons and years, but had long-term growth rates close to zero for centuries. Developmental biologists, for example Bateson et al. (2014), have theorised that pre-modern populations consequently adapted (physiologically) to long-term local food supply.
With economic development, there is a substantial increase in income and, with it, (food) consumption. Researchers such as Gluckman and Hanson (2004) have argued that the resulting mismatch between current consumption and ancestral consumption to which the population is adapted – at least for a few generations – has contributed to the high rates of metabolic disease in developing countries. In recent research (Luke et al. 2021), we seek to explain the simultaneous persistence of undernutrition in these countries by tying the initial adaptation to a ‘set point’.
The set point theory was originally motivated by the observation that a typical individual’s bodyweight is remarkably stable over time. The set point is part of a homeostatic (stabilising) system that maintains the body’s energy balance against fluctuations in food intake by making metabolic and hormonal adjustments (Müller et al. 2010). A property of all homeostatic systems is that they can only self-regulate within fixed bounds, and will fail when these bounds are exceeded.
In our model, the set point for BMI (body mass index; weight conditional on height) at the initial stages of economic development is determined by ancestral income (consumption) in the pre-modern period. If current and pre-modern incomes stay sufficiently close to each other, then individuals will successfully defend their set point. Their BMI will be determined by pre-modern rather than current income, resulting in a weak association between nutritional status – which we measure by BMI – and current income. Once the gap between current and pre-modern income crosses a threshold, however, the body will no longer be able to defend the set point. BMI will now start to track current income and, in tandem, there will be an increased risk of metabolic disease because the metabolic balance that maintained the set point has been disrupted. Individuals who have escaped the ‘nutrition trap’, but are not necessarily overweight, are the primary contributors to the increased prevalence of metabolic disease that accompanies economic development. Our model, with pre-modern adaptation characterised by an underlying set point, can thus simultaneously explain both stylised facts – the weak association between BMI and income, and the increased prevalence of metabolic disease that are observed in developing countries.
Body mass index and probability of metabolic disease: Testing the hypothesis with Indian data
If data on income, BMI, and metabolic disease were available for each dynasty (household) over many generations, going back to the pre-modern period, then we could test the preceding argument directly. For a given dynasty there would be a particular generation in which the gap between current and ancestral income exceeded a threshold, with an accompanying increase in BMI and the risk of metabolic disease. In the absence of such multi-generational household-level data, we develop novel tests based on current incomes by characterising the evolution of income in the population during the process of development. By making plausible assumptions about how the distribution of income evolves across generations, our model generates the following implications at any point in time, as described in Figure 1: (i) Although BMI (the blue dashed line) is increasing in current household income at all levels, as we move along the horizontal axis, there is a kink (slope discontinuity) in this relationship at a particular income level (indicated by the black dashed vertical line); (ii) The probability of metabolic disease (the red dashed line) is constant below the same income level and increasing thereafter.
Figure 1. Implications of the model

Households to the left of the kink point (income threshold) remain at their set point and are responsible for the weak association between BMI and current income. Households to the right of the threshold, which we will see below is associated with a BMI that is well within the normal range, have escaped the set point and are at increased risk of metabolic disease.
India is an ideal setting to examine these implications because its population is simultaneously characterised by high levels of undernutrition and a high prevalence of metabolic disease (Swaminathan et al. 2019). Using 2004-2005 and 2011-2012 India Human Development Survey (IHDS) data (reported in Figure 2), we find that the BMI-income relationship (separately for children and adults) and the metabolic disease-income relationship (for adults alone) match the predictions of the model. The weak association between BMI and household income below the estimated threshold, which is located close to the median income level in the population using Hansen’s (2017) test, partly explains the persistence of undernutrition in this population, as quantified below. The steep increase in the probability of metabolic disease with income above the same threshold, which corresponds to a BMI that is at the lower end of the normal range, helps explain the second stylised fact that even normal-weight individuals are at risk in developing countries.
Figure 2. BMI-income relationship and metabolic disease-income relationship, in children (left panel) and adults (right panel)
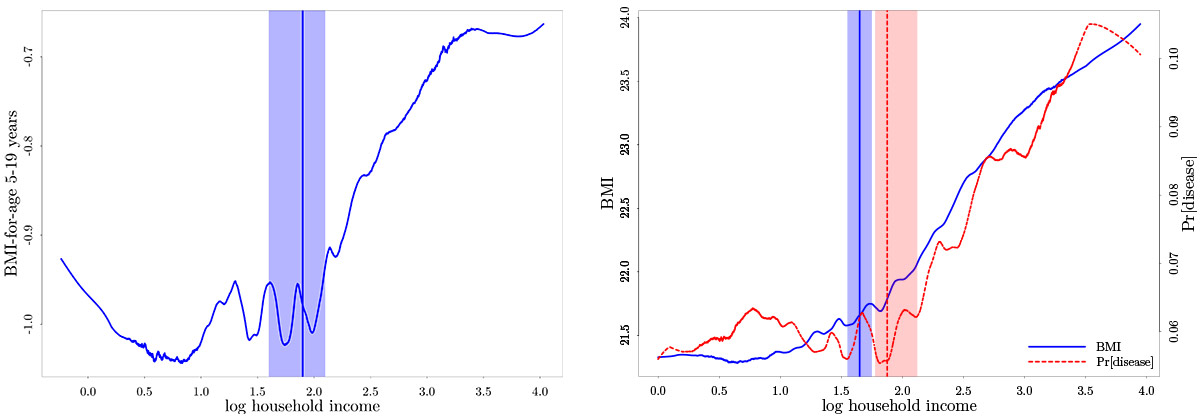
Source: India Human Development Survey (IHDS), 2004-2005 and 2011-2012.
Notes: (i) A fixed set of covariates, are partialled out prior to nonparametric estimation. For more details, see Luke et al. (2021) (ii) The vertical lines mark the estimated threshold location and the shaded areas demarcate the corresponding 95% confidence intervals1.
Other studies have proposed alternative mechanisms, based on childhood diarrhoea (Scrimshaw et al. 1968), culturally determined dietary preferences (Atkin 2013, 2016), and son preference (Jayachandran and Pande 2017), to explain the persistence of undernutrition in developing countries. Changes in diet and lifestyle with economic development are also believed to have contributed to the increased prevalence of metabolic disease (Narayan 2017). The distinguishing feature of our model is that it predicts an interconnected relationship between income and both BMI and metabolic disease, characterised by a kink, which is not implied by alternative, potentially coexisting, mechanisms.
Assessing the model’s external validity
To assess the model’s external validity, we test it with data from the Indonesia Family Life Survey (IFLS) and the Ghana Socioeconomic Panel Survey (GSPS).
While the pre-modern set point may be relevant in all developing countries, the fraction of the population that has escaped it will depend on a country’s stage in the process of development. A cross-country comparison of current income and historical income indicates that the income gap is substantially higher in Asia than in Africa. Indeed, per capita income in Ghana is essentially unchanged from 1960 to 2010, whereas per capita incomes in India and Indonesia increased substantially.
In line with the model, the results with the IFLS in Figure 3 (left panel) match what we obtain with Indian data. In contrast, there is a positive and continuous relationship, without a kink, between BMI and household income with the Ghanaian data in Figure 3 (right panel). India and Indonesia are evidently at a stage of economic development where a substantial fraction of the population lies on either side of the threshold, resulting in the co-existence of undernutrition and metabolic disease. In contrast, the Ghanaian population appears to be largely at its pre-modern set point, which is why there is no discontinuity (kink).
Figure 3. Empirical results from Indonesia (left panel) and Ghana (right panel)
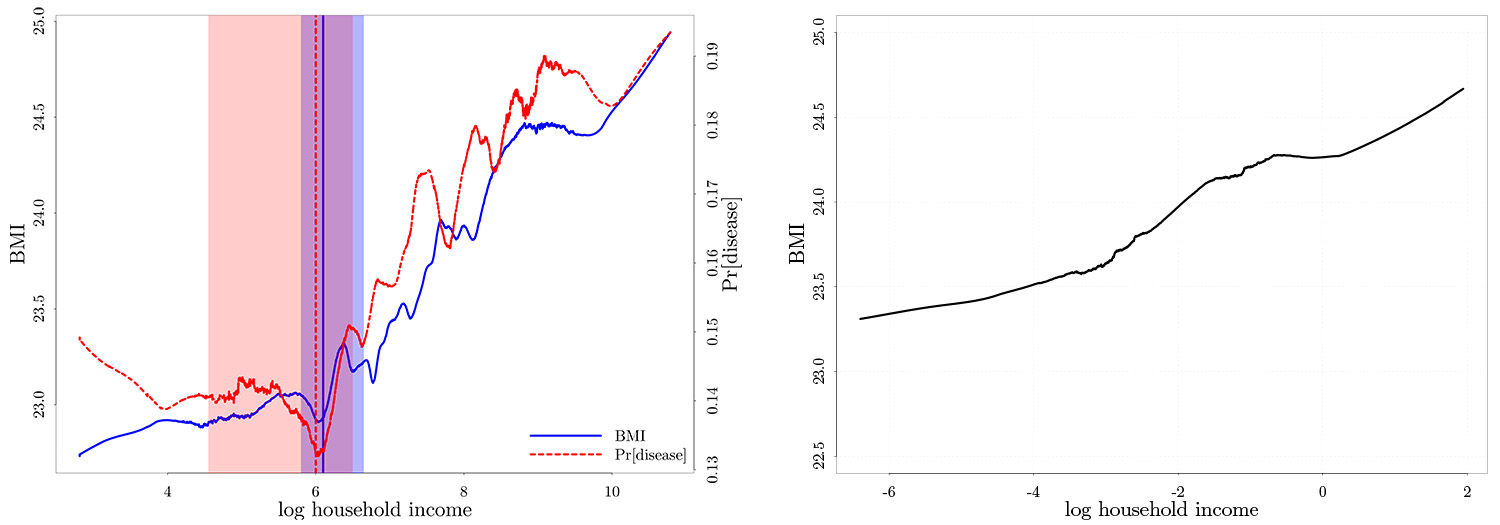
Source: Indonesia Family Life Survey (IFLS), 2007 and 2014 rounds, Ghana Socioeconomic Panel Survey (GSPS), 2009-2010 and 2013 rounds.
Notes: (i) The same set of covariates, as in Figure 2, are partialled out prior to nonparametric estimation. (ii) The vertical line marks the estimated threshold location, and the shaded areas demarcate the corresponding 95% confidence intervals. Information on metabolic disease is not available in the GSPS.
We complete the micro-analysis by constructing measures of per-capita ancestral income at the district and village levels, and then validating the biological relationships that serve as the starting point for our model: (a) BMI is determined by ancestral income, which is associated with the set point, below the estimated threshold, and by current income above the threshold; (b) The risk of metabolic disease is increasing in the difference between current and ancestral income, above but not below the same threshold.
Discussion
Having tested the predictions of the model and validated the biological relationships that it is built upon, we move from micro-data to cross-country comparisons. Deaton (2007) observes that adult nutritional status, measured by height, is lower in South Asia than what would be predicted by GDP (gross domestic product) per capita, whereas the opposite is true for Africa. We document the same cross-regional patterns in Figure 4 (left panel), using BMI instead of height to measure nutritional status. In addition, existing research has shown that there is an unusually high prevalence of diabetes and related metabolic disorders among South Asians, despite the fact that they have low BMI on average (Narayan 2017). We see in Figure 4 (right panel) that the prevalence of diabetes, conditional on BMI, is indeed higher in Asia – and not just South Asia – than in Africa. Our model can explain these seemingly unrelated findings once we take account of the cross-regional income dynamics, that is, current income is higher in Asia but historical income, which determines the set point, was higher in Africa.
Figure 4. Cross-country comparisons, by BMI (left panel) and diabetes (right panel)
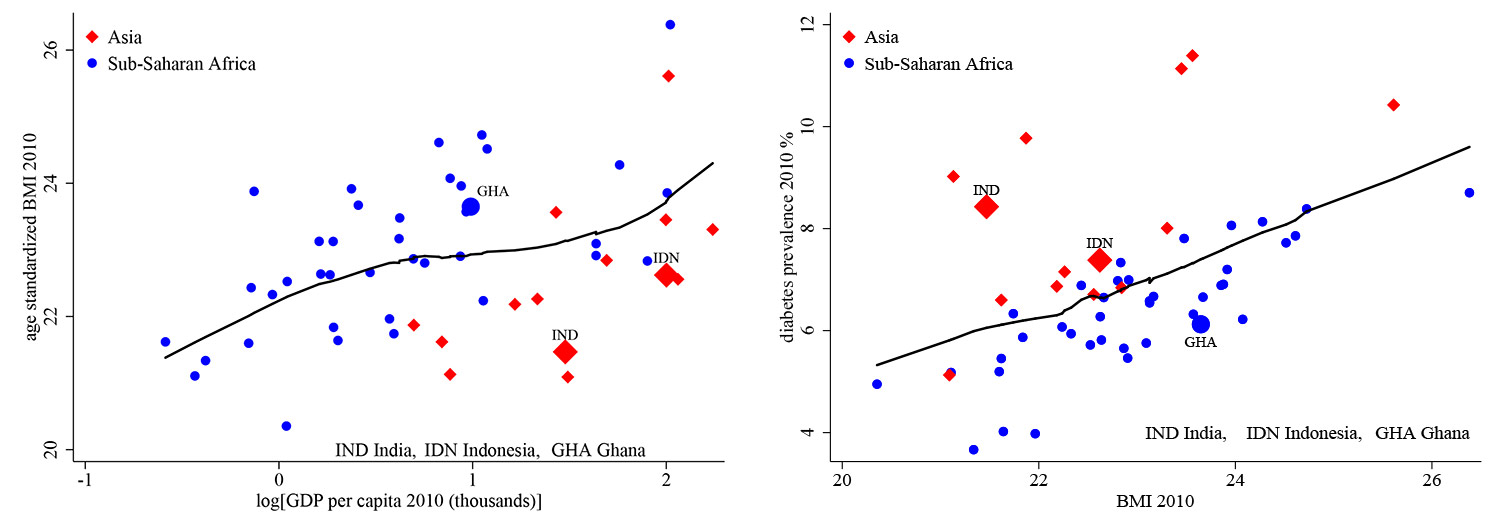
Source: NCD-RisC and Penn World Table 9.0.
While the model is informative about a variety of health outcomes, at the micro and the macro level, it is important, particularly from a policy perspective, to go further and quantify the effect of the set point on undernutrition and the prevalence of metabolic disease. A comparison of actual nutritional status and nutritional status predicted by the model, with Indian data, indicates that the fraction of underweight children aged 5-19 would decline by 10% and the fraction of underweight adults by 24% in the absence of a set point. To quantify the contribution of the set point to metabolic disease, we exploit an additional implication of the model, which is that the risk of disease will not respond to variation in BMI below a threshold, but will be increasing in BMI above the threshold. Estimates with Indian data, reported in Figure 5, locate the BMI threshold at the lower end of the normal range (18.5-25); just under 22 for the country as a whole and below 21 for South India. We might expect to observe a similar co-existence of undernutrition and metabolic disease at relatively low BMI’s, due to the set point mechanism, in other countries in the coming decades as they develop.
Figure 5. Metabolic disease-BMI relationship
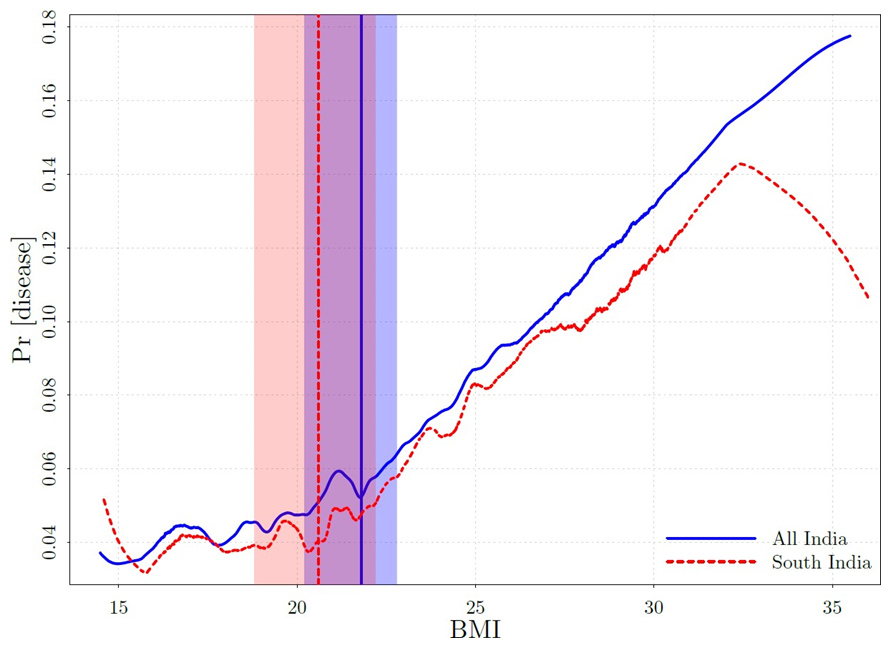
Source: 2004-2005 and 2011-2012 India Human Development Survey (IHDS).
Although the prognosis for the future may thus seem bleak, there is some hope. Recent experimental evidence indicates that intense and sustained nutrition supplementation through early childhood can permanently improve nutritional status (Ruel et al. 2008) and reduce the risk of metabolic disease in adulthood (Ford et al. 2018). These findings imply, in our framework, that the early childhood interventions shifted the set point upward. In addition, while Figure 5 indicates that a larger fraction of the adult Indian population may need to be screened for diabetes (and related disorders) than currently anticipated, there is a positive angle to this finding as well. Unlike diabetes reversal programmes in advanced economies, which typically require (obese or overweight) patients to lose large amounts of weight, lean diabetics in developing countries like India may need to reduce by relatively small amounts to cross back to the other side of their set point thresholds.
Note:
- A confidence interval is a way of expressing uncertainty about estimated effects. A 95% confidence interval, means that if you were to repeat the experiment over and over with new samples, 95% of the time the calculated confidence interval would contain the true effect.
Further Reading
- Atkin, David (2013), “Trade, Tastes, and Nutrition in India”, American Economic Review, 103(5): 1629-63.
- Atkin, David (2016), “The Caloric Costs of Culture: Evidence From Indian Migrants”, American Economic Review, 106(4): 1144-81.
- Bateson, Patrick, Peter Gluckman and Mark Hanson (2014), “The biology of developmental plasticity and the Predictive Adaptive Response hypothesis”, The Journal of Physiology, 592(11): 2357-2368.
- Deaton, Angus (2007), “Height, Health, and Development”, Proceedings of the National Academy of Sciences, 104(33): 13232-13237.
- Ford, Nicole D et al. (2018), “Exposure to improved nutrition from conception to age 2 years and adult cardiometabolic disease risk: a modelling study”, The Lancet: Global health, 6(8): e875-e884.
- Gluckman, Peter D and Mark A Hanson (2004), “Living With the Past: Evolution, Development, and Patterns of Disease”, Science, 305(5691): 1733-1736.
- Hansen, Bruce E (2017), “Regression Kink With an Unknown Threshold”, Journal of Business & Economic Statistics, 35: 228-240.
- Luke, N, K Munshi, AM Oommen and S Singh (2021), ‘Economic Development, the Nutrition Trap and Metabolic Disease’, NBER Working Paper No. 29132.
- Müller, Manfred J, Anja-Bosy Westphal and SB Heymsfield (2010), “Is There Evidence for a Set Point That Regulates Human Body Weight?”, F1000 Medicine Reports, 2(59).
- Narayan, KM Venkat (2017), “Public Health Challenges for the 21st Century: Convergence of Demography, Economics, Environment and Biology: Nalanda Distinguished Lecture”, The National Medical Journal of India, 30(4): 219.
- Jayachandran, Seema and Rohini Pande (2017), “Why are Indian Children so Short? The Role of Birth Order and Son Preference”, American Economic Review, 107(9): 2600-2629.
- Ruel, Marie T et al. (2008), “Age-based preventive targeting of food assistance and behaviour change and communication for reduction of childhood undernutrition in Haiti: a cluster randomised trial”, The Lancet, 371(9612): 588-95.
- Scrimshaw, NS, CE Taylor, JE Gordon and World Health Organization (1968), ‘Interactions of nutrition and infection’, World Health Organization Report.
- Swaminathan, Sowmya et al. (2019), “The burden of child and maternal malnutrition and trends in its indicators in the states of India: the Global Burden of Disease Study 1990–2017”, The Lancet: Child and Adolescent Health, 3(12): 855-870.

Comments will be held for moderation. Your contact information will not be made public.