

 18 January, 2021


While spatial segregation based on caste or religion is a constitutive feature of social life in India, there have been very few systematic studies of it. This article presents central findings from the first ever, large-scale quantitative measurement of intra-village spatial segregation in India, based on micro-data from a 2015 Government of Karnataka survey.
Even a new student of rural India, with only a passing familiarity with its complex social organisation, can wax eloquent about one stylised fact – the near-perfect segregation of residential space by caste and religion. Introductory textbooks have immortalised spatial segregation as a constitutive feature of social life in agrarian India (for example, Desai 2016). When B.R. Ambedkar famously characterised the Indian village as a “sink of localism”, and a “den [of] narrow-mindedness”, he was partly railing against such spatial segregation in the Indian countryside (Ambedkar 1948).
Background
Generations of detailed ethnographic research has documented how residential space in rural India is not only segregated, but actually mirrors the hierarchical ordering of caste groups (Ahmad 1952, Srinivas 1959, Singh and Khan 1999). Figure 1 below depicts residential segregation in Amminabhavi, situated on the outskirts of the city of Dharwad in Karnataka, and made famous by Spate and Learmonth (1954) as the quintessential example of spatial organisation in village India. This large village shows how Dalits (the formerly ‘untouchable’ caste groups shown as ‘Harijans’ in the original figure) are consigned to the periphery of the village. The dominant landholding castes occupy the centre of the village. Other worker castes (for example, Talwars and shepherds, as shown in the figure) are also relegated to the spatial margins. The village headman and his kin occupy the best land parcel and live in a palatial ‘manor house’ (Spate and Learmonth 1954).
Figure 1. Residential segregation in Amminabhavi (Dharwad district), Karnataka in 1950
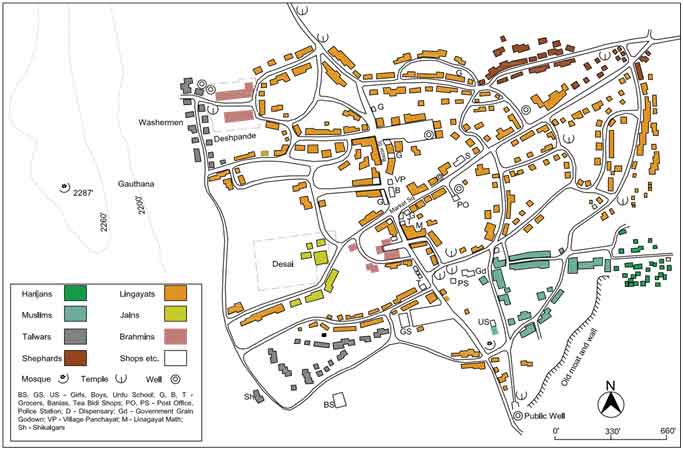
Source: Digitised and remastered by authors using original sketch from Spate and Learmonth, 1954.
Even as cartographic accounts detailing Amminabhavis around India have proliferated (see, for example, Schwartzberg 1978), systematic quantitative studies of rural political economy have been limited. Are the usual demographic-diversity channels in political economy such as diversity, polarisation, ethnic inequality, etc., potentially biased on account of this neglect of intra-village segregation?
We summarise central findings from a new study that presents the first ever large-scale quantitative measurement of intra-village spatial segregation in India (Bharathi et al. 2020b).
Studying intra-village segregation
While the actual extent of intra-village segregation remains unknown, the Indian national Census records the presence of multiple hamlet clusters in select districts across the country. As seen in the case of Amminabhavi, many villages in India are spatially organised as jati-based homogenous hamlets. Figure 2 shows the number of hamlet clusters where such data were reported (approximately 20% of all villages) by the 2011 Census. Our analysis, however, shows that the number of hamlets in a village is not correlated with the actual extent of intra-village segregation but somewhat tenuously tracks social divisions (Esteban and Ray 1994).
Figure 2. Number of residential clusters in rural India

Notes: (i) Data from 2011 Census of India. (ii) Sub-national boundaries (states and villages) are from Survey of India data used by the 2011 Census of India. (iii) Missing data and urban areas are shown as white spaces.
We use micro-data from a survey conducted by the Government of Karnataka in 2015 (GOKS) to measure intra-village segregation. GOKS represents the first Census-scale enumeration and coding of detailed caste (jati) and religion data since 1931, and the first-ever micro dataset that allows for a quantitative characterisation of intra-village spatial segregation. The data include demographic information for all rural residents in Karnataka (approximately 36.5 million residents) from over 26,000 villages.
We measure intra-village segregation by comparing the actual spatial arrangement of households in a village with the hypothetical case where the households are randomly distributed in the village. Figure 3 describes how we measure intra-village spatial segregation. Panel a of the Figure 3 depicts an actual village hamlet in the GOKS dataset. The 40 households in this village are drawn from four different jatis. Panel b of Figure 3 shows these households arranged in a random order. To compute intra-village segregation, we simply compare the ‘runs’, or unbroken sequence of households that share a social identity in the actual village with the hypothetical random ordering.1 The actual village has nine ‘runs’, while a random arrangement of the same 40 households corresponds to 21 expected runs. Panel c of Figure 3 shows the 2015 spatial distribution of households in Amminabhavi as recorded by GOKS (we have shown the eight-fold administrative mapping of jatis). Even as Amminabhavi sits at the cusp of being designated urban, its spatial demography has remained remarkably stable – 70 years after it was first immortalised as the exemplar of spatial organisation in village India.
Figure 3. Measurement of intra-village spatial segregation
Panel a. An actual village hamlet (in Ramanagaram district that we call ‘halli’) with 40 households, from GOKS (Four unique jatis, 9 actual ‘runs’)

Panel b. Random distribution of halli households.(21 expected ‘runs’)

Panel c. Actual ‘runs’ versus expected ‘runs’ in Amminabhavi
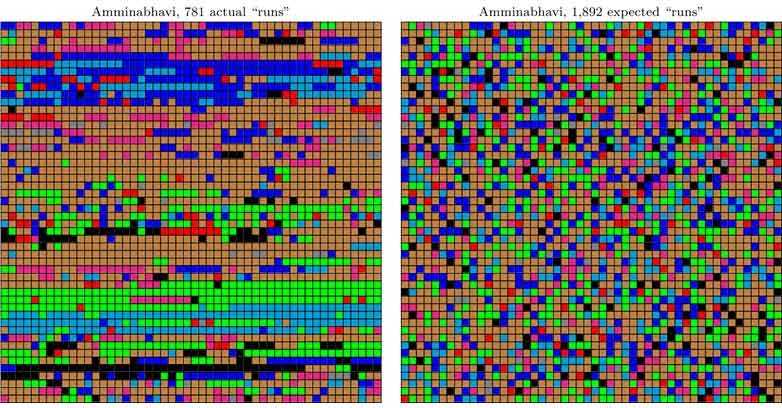
Notes: (i) Amminabhavi representation in Panel c of Figure 3 uses the eight-fold administrative mapping of endogamous jati and religious groups. (ii) Halli in Panels A, B use endogamous jati and religious groups. Each square represents an individual household in all three panels. (iii) The 2,500 houses in the Amminabhavi grid are represented row-wise. (iv) Based on authors’ calculations (data from GOKS).
Our intra-village segregation metric is measured on a 0-1 scale with a 0 indicating perfect integration, and 1, perfect segregation. Figure 4 shows the distribution of this intra-village (micro) segregation metric across all villages in Karnataka for jatis, Census groups, as well as religion. The boundary between the untouchables and other groups is especially stark as seen by high degree of segregation between Scheduled Castes, Scheduled Tribes, and others (Census groups). As a point of reference, Amminabhavi in Figure 3 has an intra-village micro segregation score of approximately 0.55. Figure 5 presents the spatial variation of intra-village segregation, indicating high levels of segregation across the state.
Figure 4. Micro-segregation in rural Karnataka
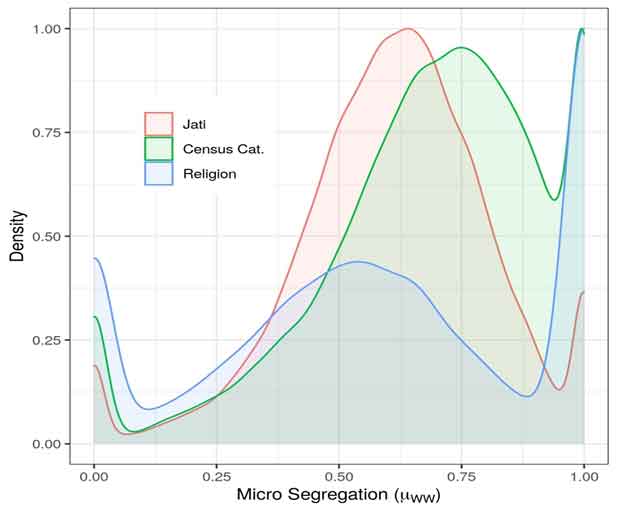
Figure 5. Micro segregation in rural Karnataka: Spatial distribution
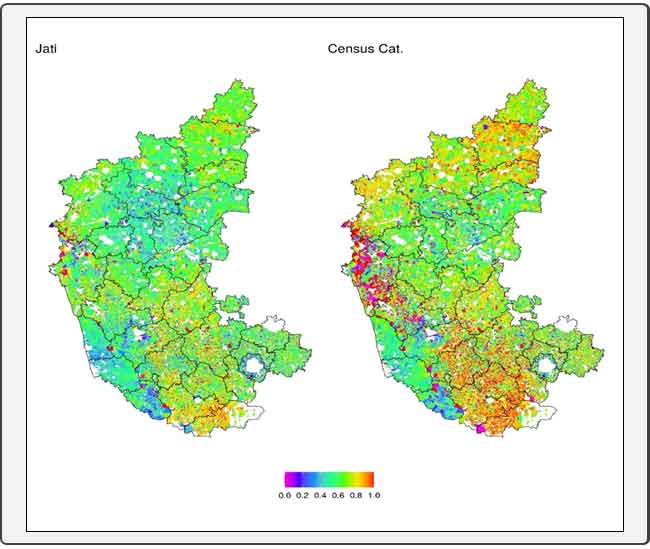
Notes: i) Authors’ calculations from GOKS data (n = 26,577 villages). (ii) Urban areas and missing data (<0.2% of villages) are not represented. (iii) District and village spatial boundaries are from Survey of India as used by the 2011 Census of India.
Figure 6 shows how intra-village segregation is uncorrelated with traditional demographic diversity metrics. Panel A of the Figure shows that spatial segregation within a village is independent of how large the village is. Panels B and C shows how intra-village segregation is uncorrelated with fractionalisation and polarisation respectively – the two most commonly used indicators of demographic diversity.2 Finally, Panel D shows that there is no discernible relationship between ethnic inequality (measured as between-group landholding inequality) and intra-village segregation. All panels also show the number of jati groups in a village. Limited available evidence suggests that accounting for intra-village segregation is important for characterising India’s rural political economy. Local public goods placement (Munshi and Rosenzweig 2016), or even hydro-geological distribution of groundwater resources within a village (Blakeslee et al. 2020) intersect with intra-village segregation.
Figure 6. Micro segregation, diversity, and inequality
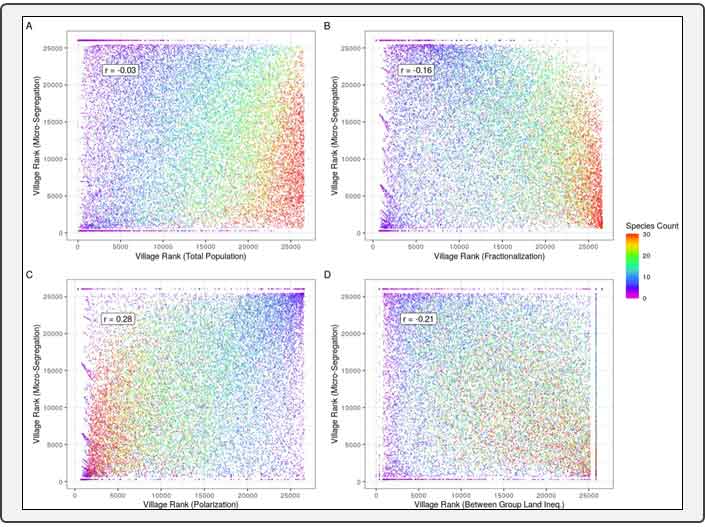
Notes: (i) The four panels show how micro segregation is independent of other diversity measurements (jati categories are used in all panels). ii) All panels plot ranking of villages by micro segregation against ranking of villages by the respective variables.
Source: Data from GOKS.
Concluding remarks
Beyond the political economy of rural India, the spatial distance between social groups has been one of the central founts of modern social sciences. For example, Georg Simmel argued that the stranger is above all a product of prevailing spatial distance between social groups that are explicitly spatial – the ‘geometry’ is a constitutive feature of spatial distance between social groups (Simmel 1908). In ranked societies (Horowitz 1985) like India, the classical relationship between contact and prejudice (Allport et al. 1954) is shaped by Simmel’s ‘geometry’. Ambedkar’s hope that a large-scale urban migration of Dalits will ameliorate the segregation problem has unfortunately not borne out empirically (Bharathi et al. 2020a). Our analysis shows how between the Scylla of the city and the Charybdis of the country,3 the underling is trapped in a permanent cordon sanitaire.
An abridged version of this article was published in 'India in Transition' of CASI.
I4I is now on Telegram. Please click here (@Ideas4India) to subscribe to our channel for quick updates on our content
Notes:
- We adapt the well-established ‘runs test’ metric (Wald and Wolfowitz 1940), which has previously been used to measure street-level micro-segregation (Agresti 1980) to more than two categories to account for the multitude of jati and religious groups in a village. The runs test analyses the occurrence of similar events in a sequence to decide if a sequence is from a random process.
- Fractionalisation and polarisation are the two most commonly used measures of group diversity in the literature. While fractionalisation signifies the number of groups, polarisation measures how likely are to groups be in conflict. While fractionalisation increases linearly with number of groups, polarisation is highest when there are only two groups with substantial size.
- Between Scylla and Charybdis is an idiom derived from the Greek mythology, which implies choosing between the lesser of two evils.
Further Reading
- Agresti, Barbara F (1980), “Measuring Residential Segregation: In Nineteenth-Century American Cities”, Sociological Methods & Research, 8(4): 389-399.
- Ahmad, Enayat (1952), “Rural Settlement Types in the Uttar Pradesh (United Provinces of Agra and Oudh)”, Annals of the Association of American Geographers, 42(3): 223-246.
- Allport, GW, K Clark and T Pettigrew (1954), The Nature of Prejudice. Addison-Wesley.
- Ambedkar, B (1948), ‘Draft Constitution – Discussion’, In V Moon (ed.), Dr. Babasaheb Ambedkar’s Writings and Speeches (Vol. 13), Government of Maharashtra Education Department.
- Bharathi, Naveen, Deepak Malghan, Sumit Mishra and Andaleeb Rahman (2020a), “Fractal Urbanism: City Size and Residential Segregation in Urban India”, SocArXiv, 3ycrb:1-41.
- Bharathi, Naveen, Deepak Malghan and Andaleeb Rahman (2020b), “A Permanent Cordon Sanitaire: Intra-Village Spatial Segregation and Social Distance in India”, Contemporary South Asia.
- Blakeslee, David, Ram Fishman and Veena Srinivasan (2020), “Way down in the hole: Adaptation to long-term water loss in rural India”, American Economic Review, 110(1): 200–224.
- Desai, AR (2016), Rural Sociology in India, Sage Publications.
- Esteban, Joan-Maria and Debraj Ray (1994), “On the Measurement of Polarization”, Econometrica, 62(4): 819-851.
- Horowitz, DL (1985), Ethnic Groups in Conflict, University of California Press.
- Munshi, K and M Rosenzweig (2016), ‘Insiders and Outsiders: Local Ethnic Politics and Public Goods Provision’, NBER Working Paper No. 21720.
- Schwartzberg, JE (1978), A Historical Atlas of South Asia, University of Chicago Press.
- Simmel, G (1908), Sociology: Inquiries into the Construction of Social Forms, Brill.
- Singh, Jai Pal and Mumtaz Khan (1999), “Hindu Cosmology and the Orientation and Segregation of Social Groups in Villages in Northwestern India”, GeografiskaAnnaler: Series B, Human Geography, 81(1):19-39.
- Spate, OHK and ATA Learmonth (1954), India and Pakistan: A General and Regional Geography, Routledge.
- Srinivas, MN (1959), “The Dominant Caste in Rampura”, American anthropologist, 61(1): 1-16.
- Wald, Abraham and J Wolfowitz (1940), “On a Test Whether Two Samples are From the Same Population”, The Annals of Mathematical Statistics, 11(2): 147-162.

Comments will be held for moderation. Your contact information will not be made public.