

 24 February, 2023


In the face of trade disruptions, firms can reorient their trade to minimise risk. This article documents a fall in inter-state trade in India during the Covid-19 lockdown, that continued until December 2020. This is explained by ‘reshoring’, as plants more dependent on inter-state sales (and input-sourcing) shifted to intra-state sales (and input-sourcing). The extent of reshoring is determined by a new measure – Scope for Home Expansion – that captures excess home production which can be diverted within the state.
Delays in input sourcing and sales caused by transport disruptions arising from natural disasters, labour disputes, conflicts and other factors are foreseen to be one of the five biggest challenges affecting timely sales and inputs procurement by firms (Business Continuity Institute, 2019, 2021). Although existing literature examines output losses for firms with linkages to regions affected by such disruptions (see Barrot and Sauvagnat 2016, Boehm et al. 2019, Carvalho et al. 2021), there is little research on whether firms change where they sell and source from, to mitigate similar losses in the future.
In a recent study (Chakrabarti et al. 2021), we examine this question, exploiting the national lockdown in India during the Covid-19 pandemic which led to a strict closure of all inter-state borders in March 2020. The lockdown brought truck movement to a complete halt, and consequently there was a sharp reduction in inter-state trade during this period. These border closures provide a unique setting for two reasons. First, India is a large country with 35 states and union territories, and an average state population comparable to countries like Spain. Second, administrative Electronic-Way (e-Way) bills data from the Goods and Services Tax Network (GSTN) tracks inter- and intra-state sales for plants at a monthly frequency, and allows us to study the changes in domestic trade at a granular level.
We find that reshoring1 by plants, whereby inter-state sales are diverted to intra-state, explains the observed collapse in trade up to six months after the border closures were lifted. To the best of our knowledge, such evidence on reshoring is non-existent in previous literature. In the aftermath of the pandemic, Antràs (2020) and Bonadio et al. (2020) warned of reshoring in international trade. Our results show how temporary disruptions can lead to reshoring even in a domestic trade context, through plants engaged in inter-state trade shifting to intra-state trade. In fact, a within-country setting provides a cleaner identification, since confounding factors such as changes in protectionism or exchange rates can be ruled out.
The timeline of restrictions
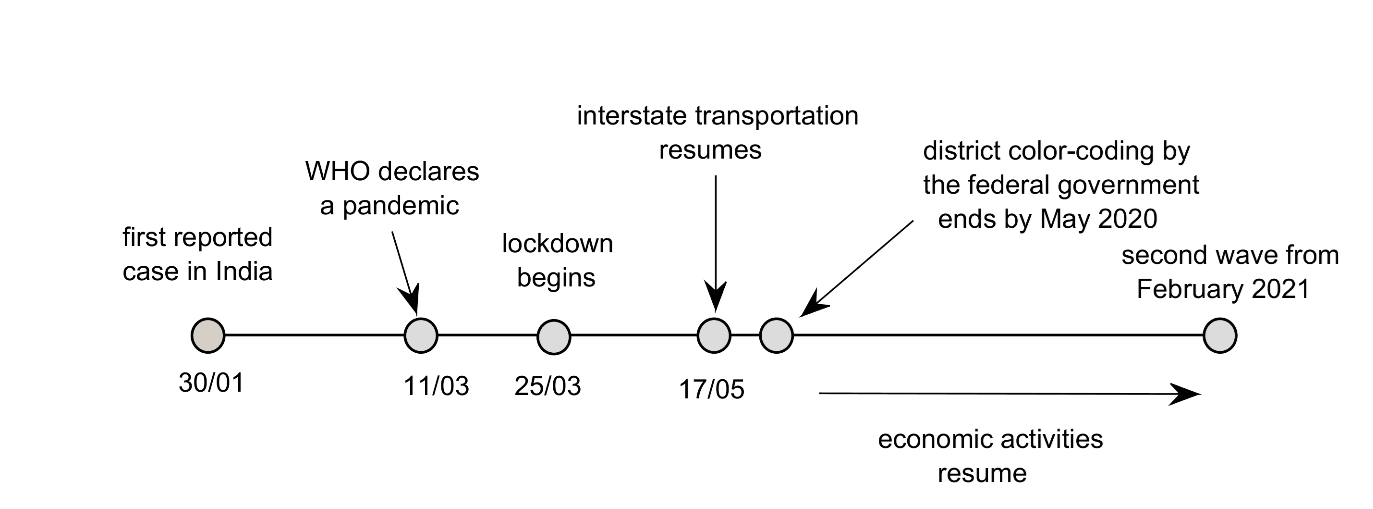
The Indian government imposed the first and the most stringent national lockdown on 25 March, 2020, which included a ban on inter-state transportation.2 The strict closure of inter-state borders to truck movement for non-essential goods continued until 14 April, 2020, with gradual easing thereafter and its complete removal only by 17 May, 2020. After 14 April, the federal government issued colour-coded district-level restrictions, wherein the extent of restrictions across districts were imposed based on reported district-level Covid-19 cases for a month. However, these restrictions also ended by 15 May, 2020. Economic activity in India followed the above timeline closely – GDP contracted by 23.9% during April-June 2020 and 7.5% during July-September 2020, in comparison to 4.2% growth in the previous financial year (that is, April 2019 to March 2020). The economic recovery picked up in the October-December 2020 quarter, with GDP registering a 0.4% growth.
Figure 1. Timeline of Covid-19 restrictions in India
E-Way bills data
We use data on e-Way bills collected by the GSTN in India which tracks real-time information on the sales of goods in the manufacturing sector. First, we look at plant-level monthly sales by two destination types: intra-state and inter-state. The input-sourcing datasets are similar and provide monthly information at the plant level. Second, we observe product sales – inter-state sales, intra-state sales, and inter-state receivables in a given state and month at HSN-4 digit3. Here, inter-state sales and intra-state sales refer to the outside and within-home state sales of a product produced in each state. Inter-state receivables refer to the value of a product received by a state from other states. We observe these datasets from January 2019 to December 2020.
Reshoring and trade collapse in India
Figure 2 shows a sharp and prominent decline of more than 10% in inter- to intra-state sales growth at the aggregate level immediately after the lockdown. This ratio remains 4% lower relative to the pre-lockdown levels even towards the end of 2020, signifying that inter-state sales recovery was slower than intra-state sales – a phenomenon referred to as ‘trade collapse’ in the literature (see Levchenko et al. 2010, Amiti and Weinstein 2011).
Figure 2. Domestic trade collapse: Year-on-year growth in inter- to intra-state sales ratio, by quarter
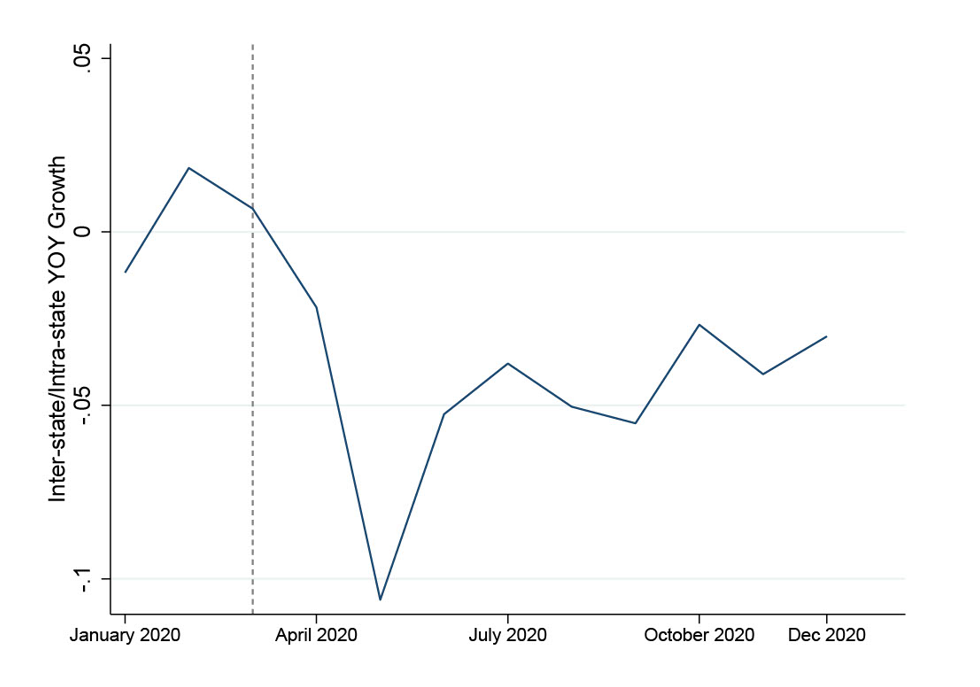
Note: The inter- and intra-state sales are the sum of inter- and intra-state sales of all states and union territories respectively.
We examine multiple channels which can explain the observed trade collapse. The reshoring channel emerges as the most prominent one, where plants that were more dependent on outside state sales and input sourcing in 2019 reorient their sales and input sourcing from inter- to intra-state respectively. We estimate the percentage change in inter-state and intra-state sales for each month in 2020 against January 2020 while considering a plant’s inter-state sales dependence. This estimation accounts for any monthly seasonality in sales in 2019, as well as changes in sectoral demand.
The left panel in Figure 3 shows an immediate decline (that is, in April 2020) in the inter-state sales of plants that sell more outside their home state. This is an expected outcome due to the border closures. However, inter-state sales remain lower for these plants even in the later months of 2020, as most coefficients remain negative and significant until the end of the year. For a one standard deviation4 increase in inter-state sales dependence, inter-state sales are lower by 6% until December 2020. In contrast, intra-state sales (right panel) for the same set of plants increases if they were more dependent on inter-state sales in 2019. The estimates show that intra-state sales in December 2020 are higher by 8% for a one standard deviation increase in inter-state sales dependence. We find similar results for input sourcing where plants buying more inter-state inputs in 2019, shift from inter-state to intra-state input sourcing (reported in Chakrabarti et al. 2021).
Figure 3. Reshoring in inter-state (left panel) and intra-state plant sales (right panel)
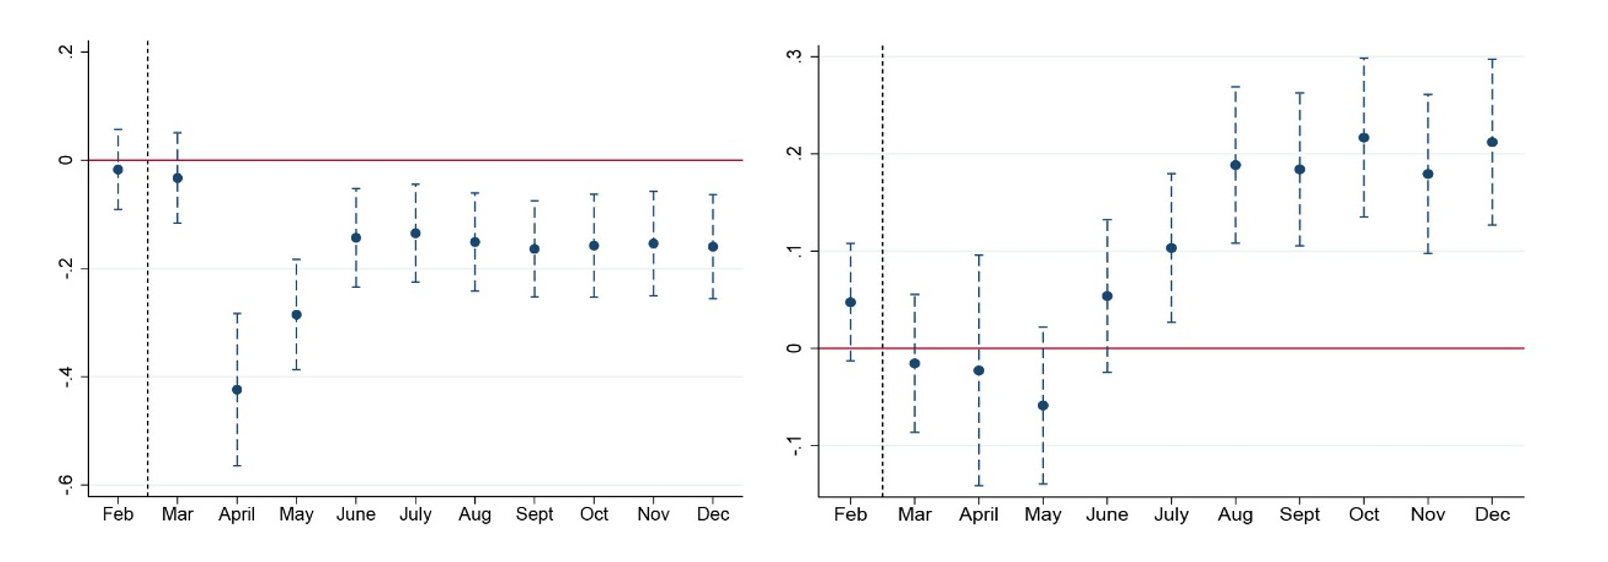
Notes: i) The figure plots the coefficient estimates for the heterogeneous impact on the log of inter-state sales and intra-state sales as a function of their dependence on outside states prior to the pandemic for each month in 2020, using January 2020 as the base month, after accounting for seasonality for the same months using 2019 data. ii) The vertical line corresponds to the last period which was unimpacted by the national lockdown in India. Months after the vertical line are either partially or completely impacted by the lockdown.
Border effect and scope for home expansion
Next, we show that our results are not explained by a simple distance effect (that is, an increase in plants’ preference to buy and sell near their geographic location after the disruption). In fact, we find that the observed reshoring is largely determined by the presence of state borders. We compare outcomes for plants located in border districts of each state with those located inland. If the distance effect was the key channel, then plants located inland would reshore to a greater extent than those on the border. This is because for the plants located on the state border, selling across the border could be geographically closer than selling to far-away areas within their state. However, we find no difference between these two sets of plants, as all plants within a state are equally likely to reshore.
Finally, we investigate which products are more likely to undergo reshoring. The outside state dependence is a plant-level supply side measure, and an insufficient demand in the home state may limit the extent of reshoring. Hence, we define a novel measure using the product data, called Scope for Home Expansion (SHE), as the minimum of inter-state sales dependence and inter-state receivables dependence of a product in a given state in 2019. This measure captures the excess home production that can be diverted towards within-state consumption, to capture both demand and supply side constraints for reshoring.5
The left and right panels of Figure 4 plot the effects of SHE for inter- and intra-state sales respectively in each month of 2020.6 We find that a higher SHE leads to a relatively larger decline in inter-state and an increase in intra-state product sales. Even during August-December 2020, six months after the border restrictions were lifted, intra-state product sales are higher by 6.5% for every standard deviation increase in the SHE. We find that other product attributes like product differentiation do not matter for the observed reshoring.
Figure 4. Impact of Scope for Home Expansion on inter-state (left panel) and intra-state (right panel) sales
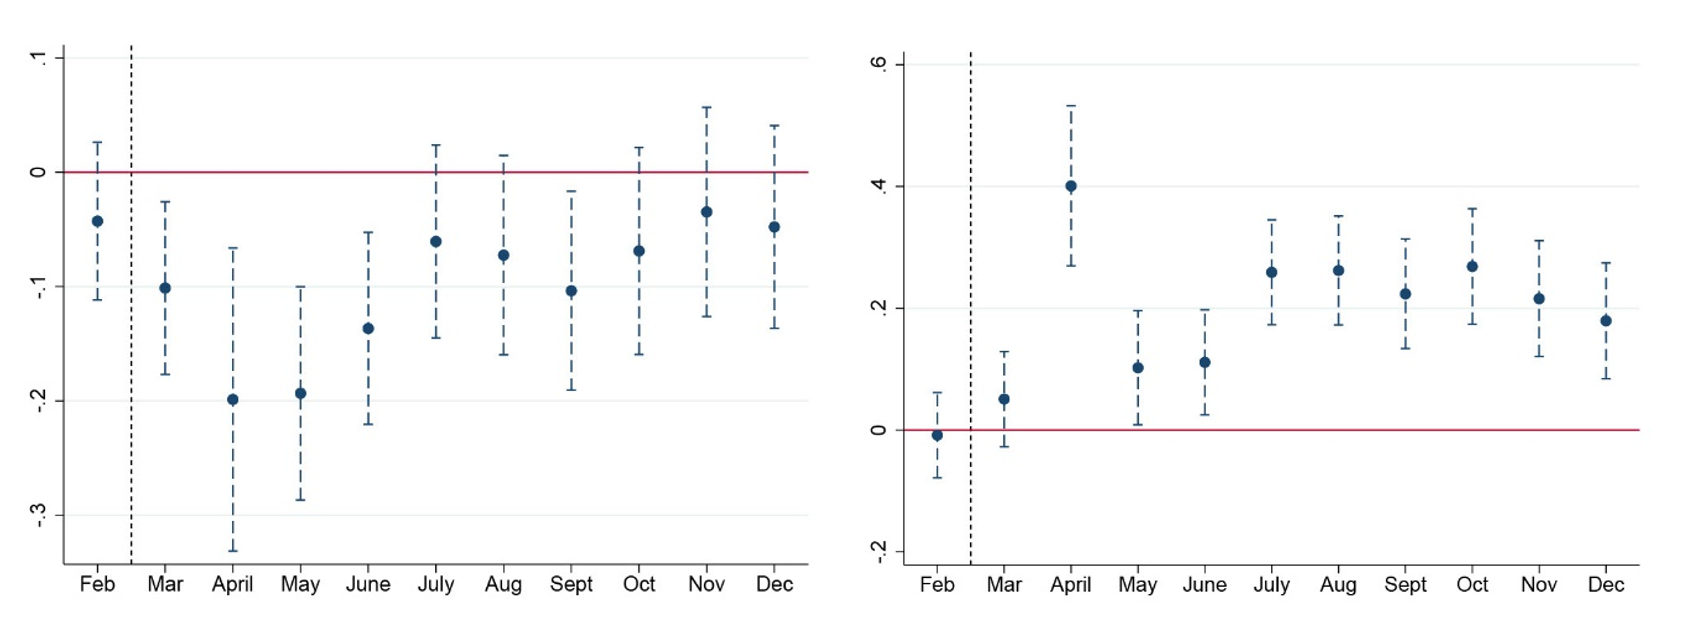
Notes: i) The figure plots the coefficient estimates for the heterogeneous impact on the log of a product sales originating in a state by product and state-level SHE for each month in 2020, using January 2020 as the base month, after accounting for seasonality using 2019 data for the same months. ii) The vertical line corresponds to the last period which was unimpacted by the national lockdown in India. Months after the vertical line are either partially or completely impacted by the lockdown.
Conclusion
To summarise, we document a within-country trade collapse after a temporary trade disruption caused by border closures. Using monthly plant- and product-level data on sales and inputs from states in India, we find that this trade collapse can be explained through reshoring by plants. Further, we find that the reshoring is more likely for products with a higher SHE, a measure that accounts for both demand and supply constraints for reshoring.
Our findings can have a few implications for adjustment by firms to international trade disruptions. First, the uncertainty created by border disruptions is likely to be higher in the international context than for domestic trade. This can lead to a larger reorientation in international trade after firms face trade disruptions across country borders. Second, since countries differ in their production-import-export baskets, our proposed measure can potentially explain the heterogeneous recovery based on the flexibility of firms to switch trading partners or reshore after trade disruptions.
Notes:
- In international trade, reshoring is the process of firms bringing production and manufacturing back to the country in which they were originally established. In this article, reshoring is used to refer to plants diverting inter-state sales (and input sourcing) to intra-state sales (and input sourcing).
- With just 500 reported Covid cases at the time of the lockdown announcement, India imposed one of the world’s strictest shutdowns, restricting all economic activities except those deemed essential like food and medicine – all within 24 hours (Balajee et al. 2020).
- Harmonised System of Nomenclature (HSN) is commonly used to classify goods.
- Standard deviation is a measure that is used to quantify the amount of variation or dispersion of a set of values from the mean value of that set.
- Apparel, fabrics, and shoes have high SHE on average, while mineral and chemical-based products and fur skins have the least SHE. Processed food items also have low SHE, reflecting state-level supply catering to local tastes.
- We control for the changes in product demand over time, as well as monthly seasonality in product sales in a state using the data from 2019.
Further Reading
- Amiti, Mary, and David E Weinstein (2011), “Exports and financial shocks”, The Quarterly Journal of Economics, 126(4): 1841-1877.
- Antràs, P (2020), ‘De-globalisation? Global value chains in the post-COVID-19 age’, Working Paper 28115, National Bureau of Economic Research.
- Barrot, Jean-Noël and Julien Sauvagnat (2016), “Input specificity and the propagation of idiosyncratic shocks in production networks”, The Quarterly Journal of Economics, 131(3): 1543-1592.
- Boehm, Christoph E, Aaron Flaaen and Nitya Pandalai-Nayar (2019), “Input linkages and the transmission of shocks: Firm-level evidence from the 2011 Tōhoku earthquake”, Review of Economics and Statistics, 101(1): 60-75.
- Bonadio, Barthélémy, Zhen Huo, Andrei A Levchenko and Nitya Pandalai-Nayar (2021), “Global supply chains in the pandemic”, Journal of International Economics, 133.
- Carvalho, Vasco M, Makoto Nirei, Yukiko U Saito and Alireza Tahbaz-Salehi (2021), “Supply Chain Disruptions: Evidence from the Great East Japan Earthquake”, The Quarterly Journal of Economics, 136(2): 1255-1321.
- Chakrabarti, AS, K Mahajan and S Tomar, S (2021), ‘Trade Disruptions and Reshoring’, SSRN Paper No. 3869005.
- Levchenko, Andrei A, Logan T Lewis and Linda L Tesar (2010), “The collapse of international trade during the 2008–09 crisis: In search of the smoking gun”, IMF Economic Review, 58(2): 214-253.

Comments will be held for moderation. Your contact information will not be made public.