

 21 February, 2018


At the time of independence, India was among the poorest countries in the world. This column argues that the main reason for India falling behind during the colonial rule was inadequate investment in agriculture and the consequent decline in agricultural productivity. While traditional industries declined faced with competition from British goods, modern industries emerged and grew relatively fast.
In 1947, India was among the poorest countries in the world (Figure 1). Did colonial rule lower the living standards? Evidence on wages (Broadberry and Gupta 2006) and estimates of per capita GDP (gross domestic product) from 1600 (Broadberry, Custodis and Gupta 2015) show that living standards declined absolutely and relatively from the 17th century (Figure 2). In 1600, Indian GDP per capita was 60% of British GDP per capita and well above Maddison’s (1995) subsistence annual income of US$400. The decline coincided with increased integration with international markets with the arrival of the European trading companies and the booming textile trade of the 17th and 18th centuries. The high point of prosperity before modern economic growth in India was under Akbar in the late 16th century.
Figure 1. Per capita GDP in 1950 in 1990 Geary-Khamis $
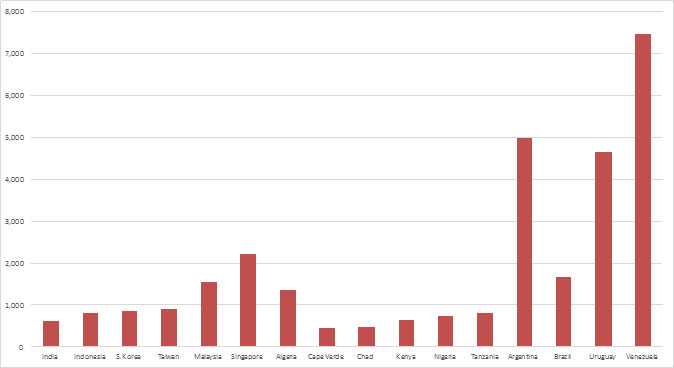 Note: The Geary–Khamis $, commonly known as the international dollar, is a hypothetical unit of currency that has the same purchasing power parity that the US$ had in the US at a given point in time.
 Exports of Indian cotton textiles rose rapidly with the arrival of the European trading companies. The competitive advantage of Indian textiles lay in the skills of weavers, quality of cotton cloth, and low wages of textile workers. The technology was simple and had changed little over time. The English East India Company was a main player in this market. The company paid for exports with bullion. This changed with the conquest of Bengal in 1757 by the East India Company and the beginning of British rule in India. The land revenue in Bengal was used to pay for the purchase of textiles. As a trading company, it continued efforts to increase the volume of trade, but at the same time, became a fiscal State.
Figure 2. The great divergence (1600-1871): Per capita GDP in 1990 Geary- Khamis $
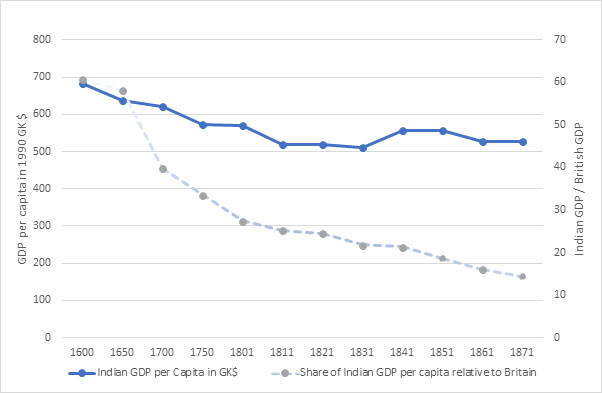 Source: Constructed using data from Broadberry et al. (2015)
 Deindustrialisation
The textile industry faced a major shock from outside that destroyed its position in the international market. This was the British industrial revolution. British wages were five times the Indian wage. The traditional technology of textile production had not been profitable in Britain. The new machines of the industrial revolution changed this. The rising productivity of British workers took away India’s wage advantage. As prices of British goods tumbled, Indian products began to disappear, first in the British markets, next in third markets where Indian goods competed with British goods, and finally faced competition in the home market from 1830 (Broadberry and Gupta 2009).
One of the most dramatic technological change was in spinning. It took 10,000 operative hours to spin 100 lbs of cotton in India. Crompton’s mule, one of the first machines of the industrial revolution in 1780, did this in 2,000 operative hours. By 1825, the number was down to 125 with Robert’s automatic mule (Catling 1970). Indian yarn had lost its competitive edge well before cotton cloth, where technological change was slower. Indian weavers substituted home produced yarn with cheaper imported yarn well before the Indian weaving industry took its first hit from imports.
Between 1830 and 1880, the Indian economy deindustrialised. As the political control of India passed from the East India Company to the British Crown in 1858, India integrated into the division of labour of the British Empire as an exporter of agricultural products. Raw cotton exports expanded rapidly during the American civil war as Britain switched from US plantations to others sources of supply of raw cotton for the textile industry. Opium played a vital role in Britain’s trade with China. Tea cultivated in India in large British-owned plantations made India the largest tea exporter to the British market.
Specialising in exports of primary products did not have an adverse effect on Indian GDP per capita. Figure 3 shows that the rise and fall of the textile trade was not the driver of growth in the 18th century. At the peak, industrial exports were less than 5% of GDP. The thriving world of Indian trade and commerce barely touched the vast majority of people. Deindustrialisation caused unemployment among textile weavers and drove many back to agricultural occupations. But it did not have a big impact on living standards. The share of agricultural output in GDP in 1800 was over 60%. Changes in agricultural output per head tracked changes in GDP per capita until 1861.
Figure 3a. Trends in GDP per capita and its export components, 1600-1871 (1871=100)

Figure 3b. Trends in GDP per head and per capita agricultural and industrial output, 1600-1871 (1871=100)
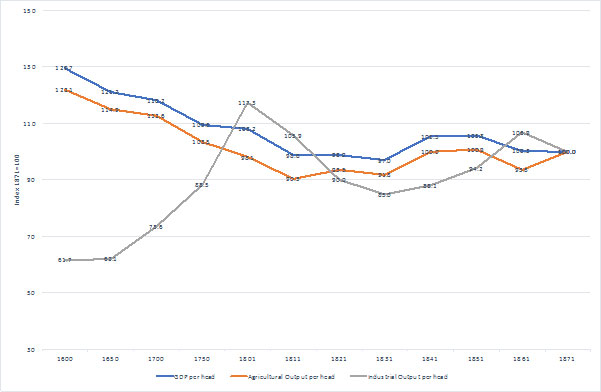 Source: Calculated from Broadberry et al. (2015).
 Agricultural stagnation
Indian GDP per capita grew slowly until the end of the 19th century (Table 1). Agricultural growth was at the extensive margin; the intensive margin mattered only on irrigated land. The colonial government built a network of irrigation canals in northwestern India. Yield per acre rose on irrigated land but stagnated in the rest of the country. Irrigation covered only 20% of land under cultivation in 1935. Yield per acre in foodgrain declined, especially in the rice-growing regions of the east. Public investment in irrigation was low at a time when the return on investment in irrigation infrastructure was similar to that in railways. Between 3-5% of the budget was spent on irrigation compared to 15-25% on railways from 1895 to 1935 (Chaudhary et al. 2015).
At the same time, the contribution of railways cannot be underestimated. The literature shows unequivocally that railways integrated markets. But railways had little impact on agricultural productivity. Agricultural stagnation had far more serious consequences for the economy in the early 20th century than deindustrialisation did in the 19th century.
Rise of modern industries
The decline of old industries was followed by the emergence of new ones. Tea and jute industries in eastern India were set up with British capital. Indian trading groups from various communities, who had been involved in opium and cotton trade, moved into the cotton textile industry from the 1860s. Despite the absence of protective tariffs, the industry began to gain domestic market share from British imports. By early 20th century, the cotton textile industry was the second largest industrial sector in India.
Critics point to the absence of a machinery industry at the time of independence due to reliance on imports. This is one part of the story. The other is that an economy, scarce in both physical and human capital, did not have the capability to exploit backward linkages from railways. India lacked the kind of ‘useful knowledge’ that had fostered the industrial revolution in Britain. Most of the workers came from agriculture and were first-generation industrial workers. For technical skills, industries such as cotton and jute textiles relied heavily on European technicians or members of the small community of Parsis, who had unusually high literacy levels and had been in urban occupations for generations.
Industry in colonial India was the fastest-growing sector. Productivity rose faster in industry than in other sectors (Table 1). Despite failure to develop a machinery industry, India did not look that different from another comparable Asian country. About 13% of GDP in India and Korea originated in manufacturing in 1945.
Table 1. Annual growth rate in per capita GDP and sectoral output per worker, 1872-1947 (% per year)
| Year | GDP per capita* | Output per worker Agriculture | Output per worker Industry | Output per Services |
|---|---|---|---|---|
| 1872-1900 | 0.7 | 0.4 | 1.1 | 0 |
| 1900-1946 | 0.1 | 0 | 1.4 | 1 |
Source: * Heston (1983); the figure refers to 1870-1900, Sivasubramonian (2000) table 6.11. Broadberry and Gupta (2010).
Human capital
A failure of colonial policy was to expand primary school enrolment, which was one of the lowest in the world. Public investment in education was also among the lowest in the world. At the time of independence, only 17% of the Indian population was literate. India followed a different path from the rest of the world in developing human capital. Rather than expanding primary education, the focus was on secondary and tertiary education. Expenditure on secondary education was disproportionately high, and secondary school enrolment was high relative to the primary school enrolment and comparable to countries in Europe. In the middle of the 19th century, universities were set up in the large metropolitan cities: Calcutta, Bombay, Madras, and Delhi.
To summarise, GDP growth in colonial India did not keep pace with population growth. Though output per worker rose in industry and services in the first half of the 20th century, both land and labour productivity in agriculture stagnated. Large-scale modern industry grew faster than any other sector from a small base. The elite bias of colonial education policy had long-term consequences for growth and development. Industrial workers did not benefit from the expansion of education, but many service sector workers did.
This article is based on the Tawney lecture delivered to the Economic History Society Meeting of 2017, to be published in the Economic History Review.
The next part of the column discusses how the decline and stagnation of the Indian economy was reversed after independence.
Further Reading
- Broadberry, Stephen N and Bishnupriya Gupta (2009), “Lancashire, India, and shifting competitive advantage in cotton textiles, 1700–1850: the neglected role of factor prices”, The Economic History Review, 62(2):279-305.
- Broadberry, Stephen N and Bishnupriya Gupta (2010), “The Historical Roots of India’s Service-Led development: A Sectoral Analysis of Anglo-Indian Productivity Differences, 1870-2000”, Explorations in Economic History, 47(3):264-278.
- Broadberry, Stephen, Johann Custodis and Bishnupriya Gupta (2015), “India and the great divergence: An Anglo-Indian comparison of GDP per capita, 1600–1871”, Explorations in Economic History, 55(1):58-75. Available here.
- Catling, H (1970), The spinning mule¸ David and Charles, Newton Abbot.
- Chaudhary, L, B Gupta, T Roy and AV Swamy (eds.) (2015), A new economic history of colonial India, Routledge, London.
- Gupta, B (2018), ‘Falling Behind and Catching up: India’s Transition from a Colonial Economy’, Centre for Competitive Advantage in the Global Economy (CAGE), University of Warwick Working Paper No. 355.
- Heston, A (1983), ‘National Income’, in D Kumar and M Desai (eds.), The Cambridge Economic History of India, Volume 2: c.1757-c.1970, Cambridge University Press, Cambridge, 463-532.
- Maddison, A (1995), Monitoring the World Economy, 1820-1992, Organisation for Economic Co-operation and Development, Paris.
- Sivasubramonian, S (2000), The National Income of India in the Twentieth Century, Oxford University Press, New Delhi.

Comments will be held for moderation. Your contact information will not be made public.