
.svg)
.svg)
.svg)

.svg)

A non-ending debate on the GDP growth numbers brought out by the Central Statistics Office has been doing the rounds. In light of the mismatch between recent trends in the growth rate and an array of high-frequency macroeconomic growth indicators, this column discusses the shortcomings of the deflation methodology used to calculate growth rates.
Growth rates of GDP (gross domestic product) and GVA (gross value added)1 are considered ‘magical’ numbers in the sense that they are the key measures of growth of an economy and, to a great extent, determinants of economic development in an economy. Hence, the scheme of their computation is rather important since only a rational methodology can produce reliable numbers. The System of National Accounts (SNA), 2008 is the internationally agreed, standard set of recommendations on how to compile measures of economic activity. According to the United Nations Statistics Division, SNA provides an overview of economic processes, recording how production is distributed among consumers, businesses, government, and foreign nations. It is designed to accommodate the needs of countries at different stages of economic development. India, in 2014-15, updated the methodology of calculating various macroeconomic parameters produced in the National Accounts Statistics (NAS), in sync with the SNA (2008).
In this context, this column has two purposes: first, to discuss the shortcomings of the methodology (a mix of the two methods: single deflation and double deflation) adopted by India’s CSO to calculate growth rate; and second, to discuss the two mainstream deflation methods and their application.
Data, methodology, and terminology
Single deflation method
This method uses one time-series2 proxy deflator3 for both input and output for obtaining values of output and GVA at constant prices. The price index used for deflating the current prices is chosen so as to better reflect the effect of price change on the constant GVA or GDP. Agriculture, forestry, and fishing sectors comprise the food basket at the commercial level as well as for domestic consumption, therefore the choice of Consumer Price Index – CPI (food) – as a deflator is well-suited. Likewise, for the manufacturing and mining and quarrying sectors, Wholesale Price Index (WPI) has been chosen as deflator since production is mainly of intermediate goods. Electricity, gas, other utilities; construction; financial, real estate and professional services; public administration, defence and other services are priced at a suitable CPI component. Trade, hotels, transport, communication, and services related to broadcasting fall in the category of intermediate services in the production of final output and are therefore deflated by WPI (all commodities). Remaining sectors are deflated at the average CPI.
Considering CPI in place of WPI as a potential deflator seems viable since the weights used in WPI are a decade old and there have been substantial structural changes in the economy over the last decade.
Table 1 gives an illustration of the results for real GVA and the respective growth rates for the sectoral composition of the GVA (2015-16) using the single deflation method.
Table 1. Illustration of single deflation method
Source: NAS, 2015 and author’s calculations
Notes: RE: Revised estimates; PE: Provisional estimates
Double deflation method
The double deflation method involves measuring GVA at constant prices by subtracting intermediate consumption at constant prices from output at constant prices. This is feasible only for constant price estimates which are additive, using a different and suitable deflator proxy to deflate the output and the input values.
As a first step, I derive a relationship between the value added at current price and total output at current price by taking intermediate consumption for each sector as a fraction of the total output. Because of unavailability of data for the present year, is taken at the same rate as the previous year. The fraction of intermediate consumption to total output has remained the same since past three years and is therefore not expected to change substantially. This exercise gives us:
Yi = VAi/(1-α)
VAi, vai is the value added at current prices and constant prices, respectively, for sector 'i'; and
Yi, yi is the output in sector 'i' at current prices and constant prices respectively.
Table 2. Alpha factor
Having established this relationship we calculate value added, total output and intermediate consumption at constant price by deflating at prices other than those used by CSO. The suitable price deflator for each sector is identified from the components of CPI and WPI based on their proximity and degree to which these explain the sectors:
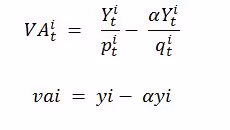
pit and qit are the price deflators for time period ‘t’ for output and input respectively, for the ith sector.
Table 3. Illustration of deflated output, input, and GVA values using double deflation method
Methodological issues
Inconsistency of deflating method for the eight component sectors of GVA
CSO uses single deflation method for all sectors − other than agricultural and mining and quarrying sectors − with a mix of CPI (Industrial Workers), CPI (Agricultural Labourers), Quantum indices4, and WPI, to convert the nominal values at current prices into their constant price equivalents. This treatment of numbers, by CSO, is debatable since the eight key components of GVA and hence their sub-components are not treated in a like fashion and thus prevent the comparison of progress across sectors. Using a different method for each sector is prone to bias, thus affecting the ultimate numbers.
Choice of deflator
The movements of CPI (reflecting output prices) and WPI (reflecting input prices) are not in sync. Given that CSO widely uses WPI as a deflator to blow up the nominal values of GVA to their real value equivalents, there is a big margin in the estimation of the growth numbers. Further, having known that price deflation is derived suitably from CPI and WPI, it is worth noting that logically GDP deflator should fall in the range {min. (CPI, WPI), max. (CPI, WPI)}5. However, what we see is that GDP deflator used by CSO is far below the min. (CPI, WPI), which is contradictory to the estimation process itself.
Potential overstating of the current numbers
The shift from ASI (Annual Survey of Industries) to MCA (Ministry of Corporate Affairs) for the collection of production activity data of the corporate sector, wherein the MCA enables companies to e-register, puts the nominal data at risk of being overstated. Before the change in GDP methodology, an annual RBI (Reserve Bank of India) study on company finances based on a sample of 2,500 companies was used to calculate manufacturing output. These numbers are is likely to be biased since the sample included some non-operating companies and some new companies that were registered but had not yet begun operations. CSO (2015c) points out: "No uniform methodology for industries due to the absence of uniform data on the private corporate non-financial sector. Companies selected in RBI sample study not following any sampling scheme and results highly varying in nature" (Nagaraj and Srinivasan 2016). It is unlikely that the MCA-21 data set used in the new GDP series is uniform, and the record of compliance with the mandated requirement to file annual returns is by no means exemplary. Likewise, there is uncertainty regarding authenticity of data on the services sector, mostly relating to the household component of the financial sector.
Data gaps
NAS publishes data on various elements, such as intermediate consumption, with a lag of at least one year. The unavailability of data leads one to use a proxy statistic or to estimate the statistic based on the previous year values, for instance, the construction sector. As a result, a number of rates and ratios are used while estimating the GVA numbers through the indirect approach (NAS, 2012).
Comparison of results under the two approaches
There is wide variation in the results obtained from the two alternate approaches. The agricultural sector shows a growth rate of 5.03% as per the double deflation method, as against 1.25% estimated by CSO. The constant price values for mining and quarrying show a growth rate of 10.76% as against 7.44% estimated by CSO. Similar differences in growth rates are seen for trade, hotels, transport, communication, and services related to broadcasting; public administration, defense and other services sectors.
The manufacturing sector shows a growth rate of 3.18% in contrast to 9.29% issued by CSO. The 9% growth rate issued by CSO poses a credibility challenge because of the Index of Industrial Production (IIP) which has shown a downward trend in 2015-16 (Figure 2). The manufacturing sector has a share of 30% in the total GVA.
The construction sector growth numbers turn negative with the use of double deflation. The key indicators of the sector such as cement and finished steel consumption, of which a substantial proportion goes into the housing sector, are claimed by CSO, to be showing a positive growth. However, the downturn in physical savings exhibited by households doesn’t support the claim.
This analytical exercise becomes critical when we focus on the financial services sector given the gloomy scenario in recent years. The financial sector has plunged with financial savings exhibiting a downward trend. There was a rise in bank deposits in 2013-14 followed by a fall in 2014-15. Financial liabilities (loan advances) and financial asset (deposits) of households have been plunging in recent years. Although there has been an increase in deposits against life insurance and shares and debentures, these constitute a small proportion of financial savings. A growth rate of above 10% is obtained using double deflation. These results are in sync with those issued by CSO. However, given the trends in the financial sector, these results hint at the lack of credibility of the nominal numbers.
Concluding remarks
CSO’s practice of using a mix of the two methods prevents the comparison of progress across sectors. A layman may not understand that when CSO uses double deflation for primary sector and single deflation for secondary and tertiary sectors it is putting the primary sector to a more aggressive test. This gives an impression that India is evolving with a manufacturing- and service-led growth, but that may not be the case − as suggested by the other indicators of macroeconomic health.
The mismatch between the GDP numbers and an array of high-frequency macroeconomic growth indicators such as the ones discussed above gives a clear idea of something going wrong somewhere. In an effort to overcome the issues associated with the generation of growth numbers of various sectors and hence the GDP/GVA, following are my key suggestions: Using the same method for deflation for every sector; updating of IIP to 2011-12, which is presently generated at 2004-05; releasing the disaggregated back series of GDP numbers for recent years, which are currently available only until 2011-12, for analysing and arriving at a clear picture; bridging the data gap in the estimation of the final GVA instead of extrapolating the samples; introduction of PPI (Producer Price Index)6 and RPI (Retail Price Index)7 as more intuitive substitutes of WPI and CPI for deflating nominal values. This may help in getting closer to optimal calculations and credible results, which are of substantial importance in the policy space.
Notes:
- Gross value added (GVA) is broadly defined as the value of output less the value of intermediate consumption. It measures the contribution to an economy of an individual producer, industry, sector, or region.
- Time series refers to a sequence of values for a variable over time at consistent time intervals.
- GDP deflator, also called implicit price deflator, is a measure of inflation. Simply put, it is the ratio of the value of goods and services an economy produces in a particular year at current prices to that at prices prevailing during any other reference (base) year. This ratio basically shows to what extent an increase in GDP or GVA in an economy has happened on account of higher prices, rather than increased output.
- Quantum indices are the indices based on the quantity or units of goods and services independent of the monetary values.
- Given that the GDP deflators estimated by the CSO are based largely on CPI and WPI, this deflator must lie between the range defined by minimum of CPI and WPI and maximum of CPI and WPI for the sector. The deflators used in the analysis are directly based on CPI and WPI and their components. Consistency would require that GDP deflators by CSO must lie within this limit.
- PPI is a price index based on the selling price of domestic producers of goods and services over time.
- RPI is a price index based on the cost of a representative basket of retail goods and services.
Further Reading
- Ministry of Finance (2016), ‘Economic Survey 2015-16’, Government of India, New Delhi.
- Ministry of Statistics and Programme Implementation (2016), ‘National Account statistics – 2016’, Government of India, New Delhi.
- Ministry of Statistics and Programme Implementation (2012), ‘National Account Statistics: Sources and Methods’, Government of India, New Delhi.
- Nagaraj, R and TN Srinivasan (2016), ‘Measuring India’s GDP Growth: Unpacking the Analytics & Data Issues behind a Controversy that Refuses to Go Away’, NCAER (National Council of Applied Economic Research), India Policy Forum, 12-13 July 2016.


.svg)

.svg)
%201.svg)
.svg)
.svg)