

 03 April, 2018


Recent data released by the Central Statistics Office (CSO) on 30 November 2017 highlight that India’s GDP (gross domestic product) growth rate at the end of the second quarter of 2017-18 is 6.3%, which has been the slowest second quarter growth rate in GDP since 2012-13, as recorded in the new series of National Accounts Statistics (NAS) with base year 2011-12. This slowing growth trend in the national income of the Indian economy has been spotlighted by various assessments including the Economic Survey (Vol. 2, 2016-17), the Monetary Policy Report of the RBI (Reserve Bank of India) (October 2017) and the most-recent first advance estimates of the CSO released on 5 January 2018. These reports draw attention to the slackening of aggregate demand in recent quarters owing to languishing investment and a distinct slowdown in exports. There is growing anxiety due to near-term deflationary impulses on account of transitional frictions from implementation of the Goods and Services Tax (GST) and declining profitability in the power and telecommunication sectors that are further exacerbating the twin balance sheet problem1. Had it not been for the front-loading of public spending that boosted government consumption, the deceleration in economic growth would have been even more pronounced. Furthermore, private consumption demand, which had been the fulcrum of overall demand in the economy, started to lose momentum during the first half of 2017, and gross fixed capital formation (GFCF) does not show any signs of warranted reversal, considering the first quarter results of 2017-18. These issues have been weighing on the Indian economy that is still away from its potential and yet to gain full momentum.
Analysis of aggregate demand components
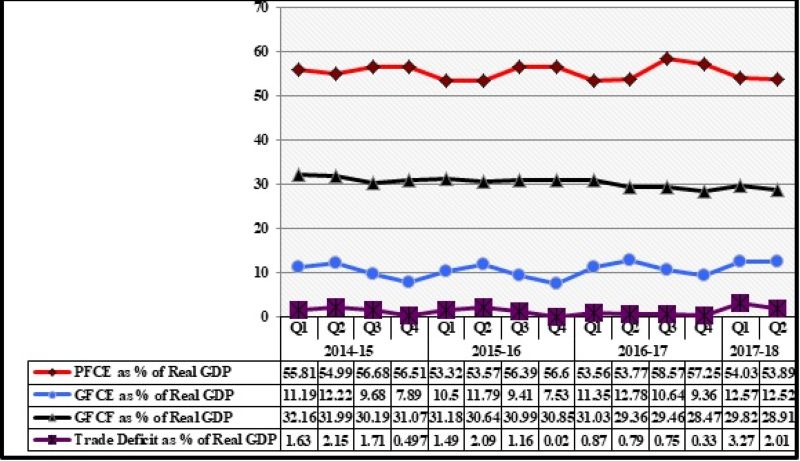
Considering the quarterly changes in real GDP at market prices, it is observed that aggregate demand has been consistently decelerating since the last quarter of 2015-16, which is indicative of the protracted slowdown that has spanned the Indian economy over the last year and a half. This continual decline in real GDP can be analysed by considering the breakup of aggregate demand into its four major components, namely, private final consumption expenditure (PFCE), GFCF, government final consumption expenditure (GFCE), and net exports. Table 1 represents the quarter-on-quarter percentage changes in each of these components, while Figure 1 provides their broad summary by looking at their quarterly values as a percentage of real GDP (at market prices).
Table 1. Growth rate of real GDP and its components
|
Item |
Weighted Contribution to growth (2015-16) |
Weighted Contribution to growth (2016-17) |
2015-16 |
2016-17 |
2017-18 |
|||||||
|---|---|---|---|---|---|---|---|---|---|---|---|---|
|
Q1 |
Q2 |
Q3 |
Q4 |
Q1 |
Q2 |
Q3 |
Q4 |
Q1 |
Q2 |
|||
|
PFCE |
3.4 |
4.8 |
2.78 |
5.22 |
6.69 |
9.31 |
8.41 |
7.93 |
11.10 |
7.33 |
6.65 |
6.50 |
|
GFCF |
2.1 |
0.7 |
4.29 |
3.43 |
10.11 |
8.34 |
7.39 |
3.02 |
1.66 |
-2.07 |
1.61 |
4.66 |
|
GFCE |
0.3 |
2.0 |
0.89 |
4.27 |
4.22 |
4.12 |
16.57 |
16.47 |
20.96 |
31.88 |
17.17 |
4.13 |
|
Exports |
-1.3 |
0.9 |
-6.15 |
-4.13 |
-8.65 |
-2.29 |
1.97 |
1.54 |
3.99 |
10.30 |
1.21 |
1.22 |
|
Imports |
1.5 |
-0.5 |
-5.86 |
-3.36 |
-9.90 |
-4.29 |
-0.53 |
-3.82 |
2.13 |
11.91 |
13.40 |
7.49 |
|
Change in stock |
-0.1 |
0.1 |
-1.00 |
0.03 |
3.59 |
3.11 |
8.87 |
5.94 |
6.35 |
3.52 |
1.17 |
6.69 |
|
GDP at market prices |
7.9 |
7.0 |
7.58 |
8.01 |
7.25 |
9.13 |
7.92 |
7.53 |
6.97 |
6.12 |
5.72 |
6.27 |
Source: CSO, and RBI Handbook of Statistics on the Indian Economy.
PFCE has remained the key driver of aggregate demand since it has contributed nearly 55-58% to real GDP over the last several quarters. However, the contribution has now declined to 54%. The quarterly growth rate of PFCE has also fallen from 8% to 6.5%. So although PFCE supported the growth process during the last few years, it has started to lose momentum – particularly in the past nine months – due to stagnant demand for consumer durables in urban areas and a sharp deceleration in the demand for cash-intensive fast moving consumer goods (FMCGs) in rural areas. High frequency indicators for consumption show that while demonetisation could be a major factor adversely affecting the rural demand, the pattern of urban consumption paints a mixed picture with sales of passenger cars and international air passenger traffic remaining robust, but consumer durables demand having contracted.
Considering the GFCF figures, it is evident that the overall investment climate remains bleak since the investment share in real GDP has fallen below 29% in the second quarter of 2017-18. Collapse in GFCF began in the first quarter of 2016-17 and continues to debilitate the demand conditions within the economy. According to the Monetary Policy Report of the RBI, subdued levels of investment activity are reflected in the contraction of capital goods production and excess capacity within the manufacturing sector, which is also seen in the declining capacity utilisation rate. Moreover, the Centre for Monitoring Indian Economy (CMIE) has reported that 2017-18 is likely to be the worst possible year for investments in India. It is stated that not only have the new investment proposals in 2017-18 reached the lowest level since 2004-05, even the ratio of stalled projects to that of new ones is likely to have risen sharply during 2017-18.
 Source: RBI Handbook of Statistics on the Indian Economy.
 With the massive frontloading of expenditure by the Centre, the share of GFCE in real GDP has increased to around 12.5%, which is mainly due to sharp increase in disbursement of subsidies and higher capital expenditure. The Economic Survey (Vol.2, 2016-17) underlines that if the robust growth of GFCE is excluded, then the real GDP growth would plunge to a mere 4-4.3% during this year. A feature worth mentioning here is that it is the public sector that has not only spearheaded the new investment proposals, but has also drastically reduced its value of stalled projects when compared with the corresponding figures for the private sector. This form of public sector investment is expected to generate some multiplier and crowding-in effects since a durable turnaround in the investment cycle largely hinges on the revival in private investment appetite.
Besides, the share of net external demand in GDP has sharply declined in the first two quarters of 2017-18 with import growth far outpacing that of exports. This can be seen from the increase in the share of trade deficit from below 1% to 2-3% of real GDP, at present. While the slowdown in exports has been broad-based – encompassing oil and non-oil segments – it is the merchandise import growth that accelerated during the middle of the year and pushed the trade deficit to its highest level since 2013-14. As a result, net exports have further imparted a deflationary bias to economic activity.
Additionally, in order to gauge the demand conditions within the economy, the output gap measure provides a useful summary of the cyclical component of aggregate demand. It is the deviation of actual output from its potential level and expressed as a percentage of potential output, where the potential output is that level of output that an economy can produce sustainably over the medium-term consistent with low and stable inflation. A new concept of finance-adjusted measure of the output gap has been introduced by the RBI, which controls for the imbalances emanating from the financial sector by incorporating the role of financial sector variables in the evolution of economic cycles. It is observed that this measure of the output gap for the Indian economy has been consistently negative since the third quarter of 2016-17.
Conclusion
With the introduction of structural reforms such as the GST, the macroeconomic context needs to be dynamic and healthy, to lubricate and minimise the unavoidable disruptions resulting from these reforms. Thus, it is all the more important to overcome these demand shortfalls. Some crucial policy choices may include the timing and magnitude of monetary easing, the magnitude and composition of fiscal consolidation, actions to deal with the issues of rural infrastructure, public investment in agriculture, rural non-farm employment, particularly employment generation in manufacturing, and public services like health and education. These would not only raise incomes, but would also generate the necessary multiplier effects in the economy.
Notes:
- India has been suffering from the phenomenon of “twin balance sheet problem” since the year 2016, as noted by the Economic Survey (Vol.1, 2016-17) where both the banking and corporate sectors have been under stress, which is also one of the highest degrees in the world. With over-leveraged companies and bad-loan-encumbered banks, India’s NPA ratio is higher than many other emerging markets, including the peak levels seen in Korea during the East Asian crisis.
Further Reading
- Central Statistics Office (2017), ‘Press Note on Estimates of Gross Domestic Product for the Second Quarter (July-September) of 2017-18’, Ministry of Statistics and Programme Implementation, Government of India, 30 November 2017.
- Editorial Board (2017), “State of Wilful Denial”, Economic and Political Weekly, Vol. 52, Issue No. 49, 9 December 2017.
- Ministry of Finance (2017), ‘State of the Economy: An Analytical Overview and Outlook for Policy’, in Economic Survey 2016-17 (Volume-2), Economic Division, Department of Economic Affairs, Government of India.
- Ministry of Statistics and Programme Implementation (2017), ‘National Accounts Statistics 2017’, Highlights, Government of India.
- Reserve Bank of India (2017), ‘Monetary Policy Report – October 2017’, 4 October 2017.
Comments will be held for moderation. Your contact information will not be made public.