The ‘Status of Adivasi Livelihoods’ Report has once again brought attention to the dire situation of tribes in central India. Based on a survey of tribal households in Madhya Pradesh and Chattisgarh, Chaudhuri and Ghosh discuss challenges such as loss of biodiversity and landlessness, poor food security and malnutrition, and illiteracy. They highlight the relief provided by food subsidies, and suggest improving governance systems and preserving tribal values to uplift these communities.
The ‘Status of Adivasi Livelihoods’ (SAL) Report (2022) reveals that Adivasi1 households in the states of Madhya Pradesh (MP) and Chattisgarh in central India, have substantially lower income than other communities. Adivasi households in MP have an average annual income of Rs. 73,900, while the figure is Rs. 53,610 for those in Chhattisgarh (PRADAN, 2024). This is much lower than the national average annual income of agricultural households2, which stood at Rs. 122,616 during the agricultural year 2018-19 (National Statistical Office, 2021).
The role of food subsidy
The Public Distribution System (PDS) has played a crucial role in minimising the stress of low income and food insecurity among Adivasi households in the two states. Chhattisgarh in particular is known as a pioneer state in effectively implementing PDS throughout the state following the enactment of the National Food Security Act, 2013 (Drèze and Sen 2013).
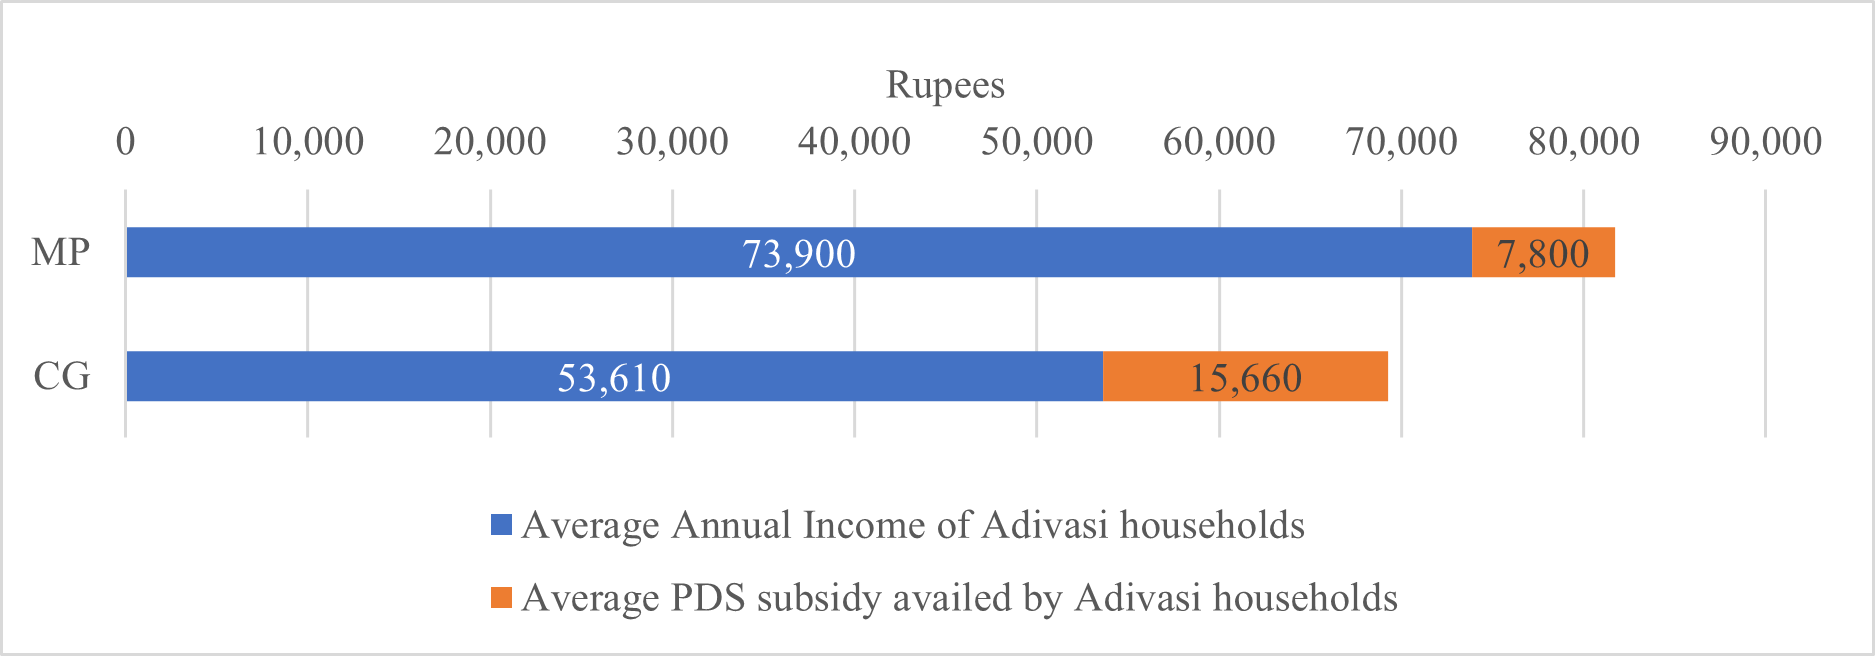
The food subsidy provided through PDS is helping Adivasi households to get some relief amid their low incomes. In Chhattisgarh, where Adivasi households, on average, consume goods worth nearly Rs. 18,000 annually from PDS, only 13% is spent by the households, with the government's subsidy of Rs 15,660 significantly contributing to lower income stress. Similarly, in MP, Adivasi households, on average, procure goods worth Rs. 10,000, while bearing only 22% of the cost, with government subsidy of Rs 7,800 making up the remaining 78% (see Figure 1).
Figure 1. Average household income and subsidy availed from PDS
Our study
The study was designed to cover six facets of Adivasi livelihoods – cultural ethos, resource conditions, external interventions, household characteristics such as literacy and landholding, activities undertaken, and outcomes such as income, food security and nutrition. We conducted a household-level questionnaire survey to get a sense of household perspectives; used a village factsheet and administered semi-structured focus group discussions (FGDs) to capture the village-level perspective; and semi-structured personal interviews to understand the views of scholars, activists and community leaders. This data collection was done from May to August 2022. The overall sample composition is given in Table 1.
Table 1. Sample composition
|
|
MP |
CG |
Total |
|
Total households |
2,967 |
3,052 |
6,019 |
|
Adivasi households |
2,405 |
2,340 |
4,745 |
|
PVTG households |
201 |
192 |
393 |
|
Non-Adivasi households |
361 |
520 |
881 |
|
Total villages |
148 |
153 |
301 |
|
Adivasi villages |
117 |
117 |
234 |
|
PVTG villages |
10 |
10 |
20 |
|
Non-Adivasi villages |
21 |
26 |
47 |
|
Sampled blocks |
27 |
28 |
55 |
|
Sampled districts |
11 |
11 |
22 |
|
Total FGDs |
24 |
26 |
50 |
|
Total interviews |
11 |
17 |
28 |
There are 46 recognised Scheduled Tribes in MP, with Bhils being the majority, followed by Gonds. Three groups – namely Baiga, Sahariya, and Bhariya – are recognised as Particularly Vulnerable Tribal Groups (PVTG). In Chhattisgarh, there are 42 tribal groups with Gonds being the majority. Of these 42 groups, seven belong to PVTG (Kamar, Baiga, Pahadi Korba, Abujhmadiya, Birhor, Pando and Bhujia).
The sampling strategy was drawn to ensure that the tribal groups, generally concentrated in specific areas, are represented in the study as far as possible (Table 1). Accordingly, the Adivasi regions in MP were divided into three regions – Bhil, Gond, and ‘other’. Chhattisgarh was divided into north, central and south regions. There are disparities in household incomes even across regions within a state. The Bhil region in MP is notably ahead on account of its proximity to the industrial belt – even though it is prone to drought and has low forest cover. In fact, the average income here is at least 1.5 times that of other regions (Rs. 24,571 versus a range of Rs. 12,000-15,000).
The sample was drawn from tribal-dominated administrative blocks under the Intensive Tribal Development Programme (ITDP). In both Madhya Pradesh and Chhattisgarh, the sample was distributed over nine districts, proportionally to the population. Additionally, the PVTG population was given an 8% sample allocation, despite being 4% of the population. One thousand non-tribal households were also surveyed from ITDP blocks to draw comparisons between Adivasi and non-Adivasi households within the same regions.
Human development indicators among Adivasi households
Livelihoods and income: More than 60% of the Adivasi households in MP, 90% in Chhattisgarh and almost all PVTG households in both states report depending on forest products. The majority collect fuelwood, with 98% of households in both states utilising it for personal consumption.
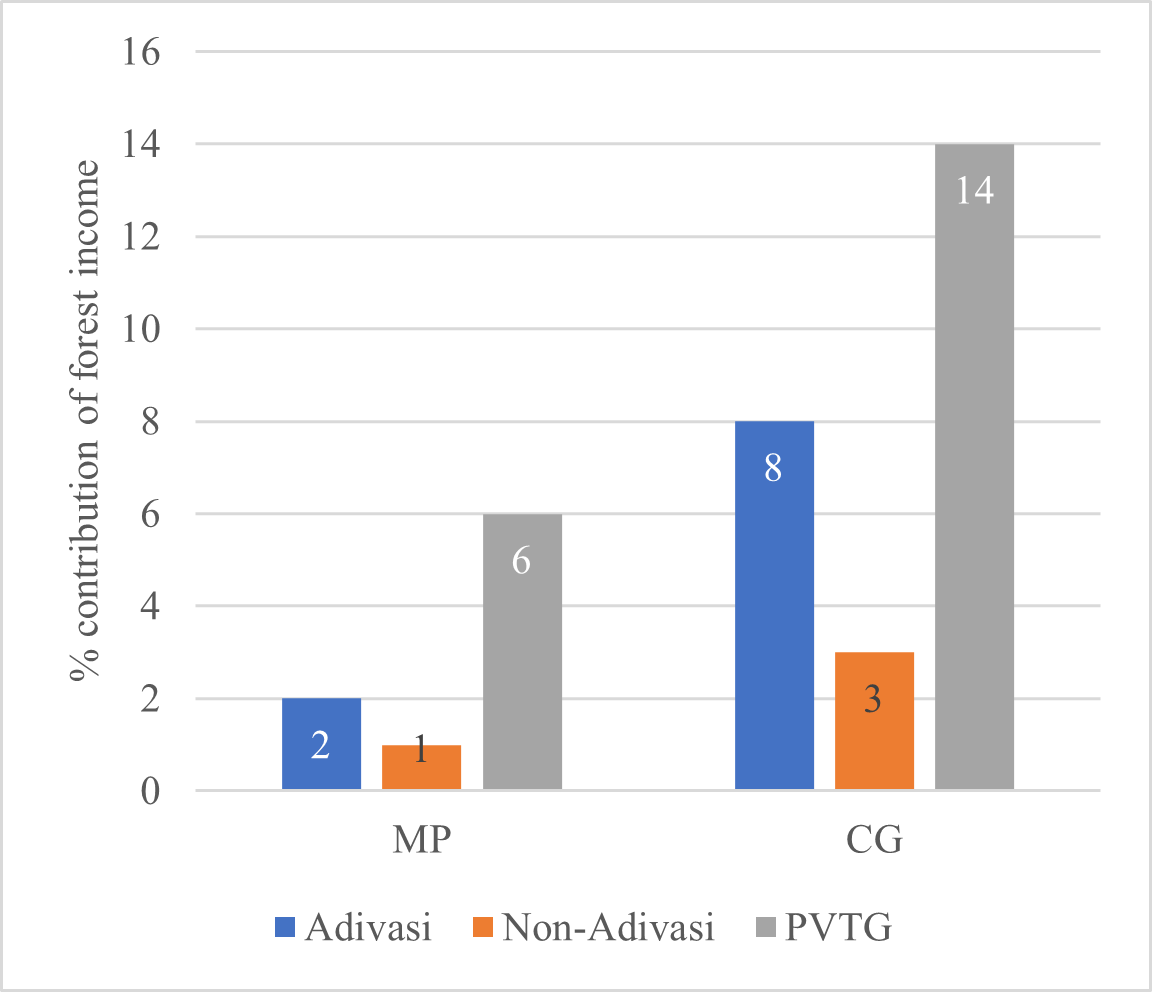
However, contrary to popular belief, the contribution of income from forest gathering to the total income is almost insignificant in both states (Figure 2). As we do not have the imputed value of self-consumption for forest gathering, this may have led to some underestimation.
Figure 2. Contribution of forest gathering to household income
During the village-level focus group discussions, villagers report that the availability of forest products such as mahua, tendu leaves, char, and chironjee is declining every year. According to them, because of the Forest Department’s exclusive focus on timbers, these plants are disappearing fast from the forest. Even from the viewpoint of biodiversity loss and climate change, this phenomenon needs deeper exploration.
Food security and dietary diversity: Improved performance of PDS has possibly resulted in better food security in Chhattisgarh. However, excessive reliance on rice from PDS may have affected dietary diversity negatively.
Figure 3 shows the percentage of households that have the resources to access adequate food that they generally prefer to eat. This includes food from own farming, PDS, and purchased food.
Figure 3. Share of households reporting no issues in accessing their preferred food
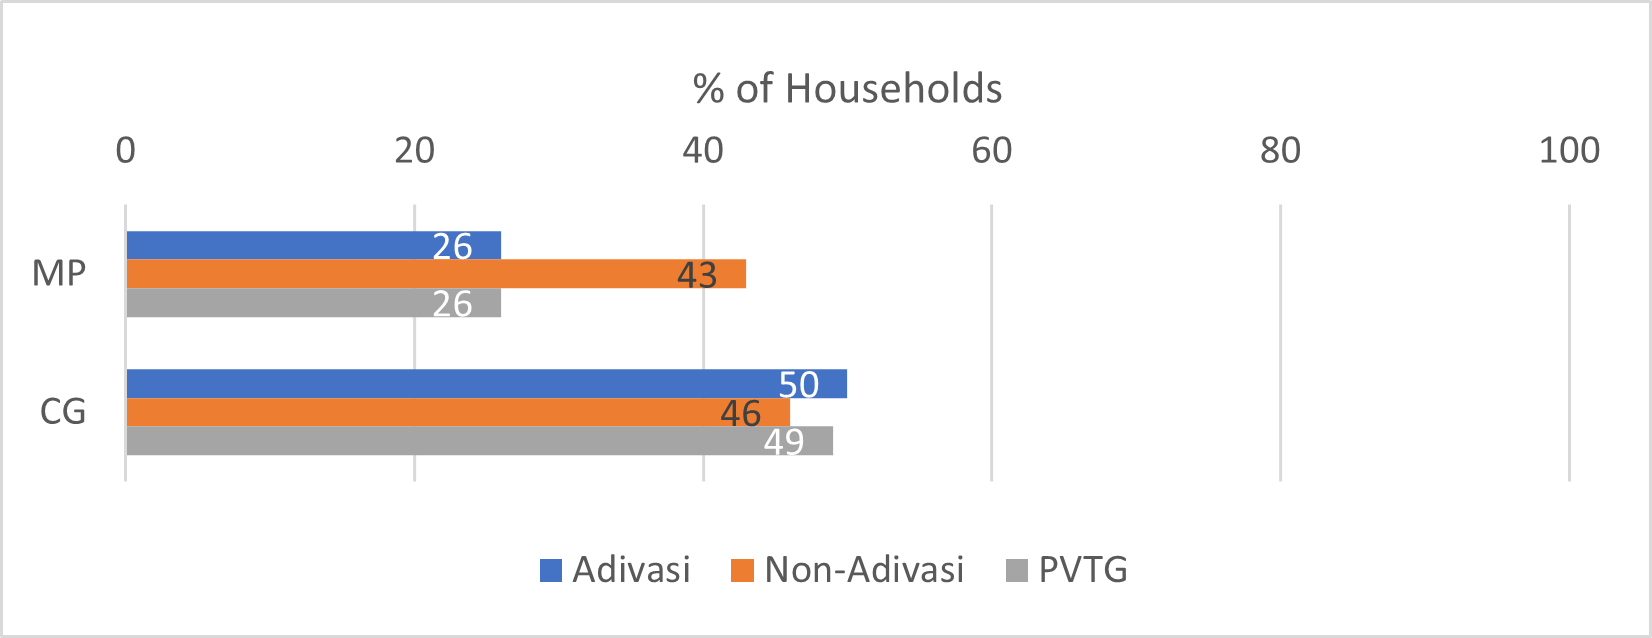
Data on dietary diversity was collected using the Food Consumption Score (FCS) developed by the United Nations World Food Programme. FCS is a composite score based on dietary diversity, food frequency, and relative nutritional importance of different food groups. Figure 4 shows the percentage of households that had taken a combination of foods from diverse food groups necessary for nutrition.
Figure 4. Share of households with acceptable dietary diversity
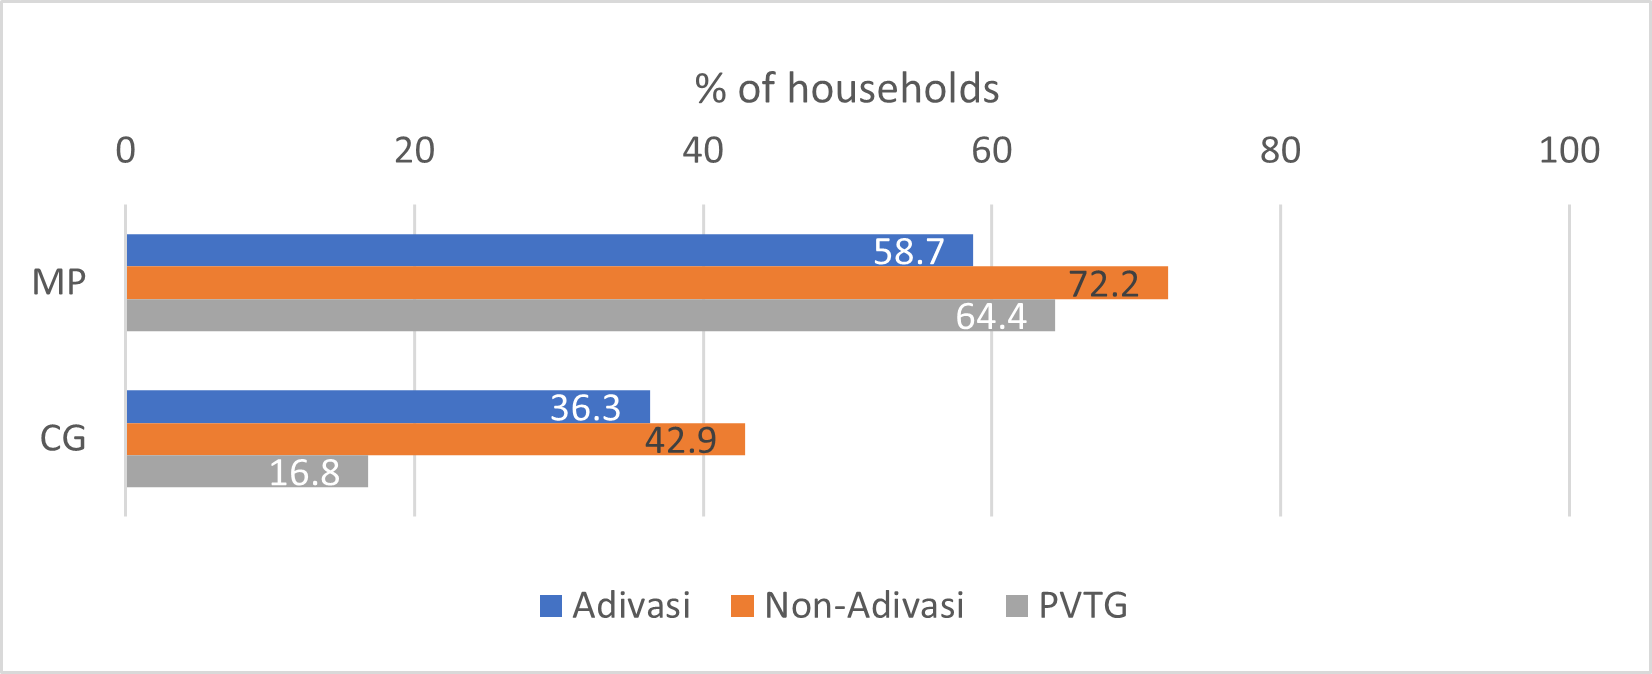
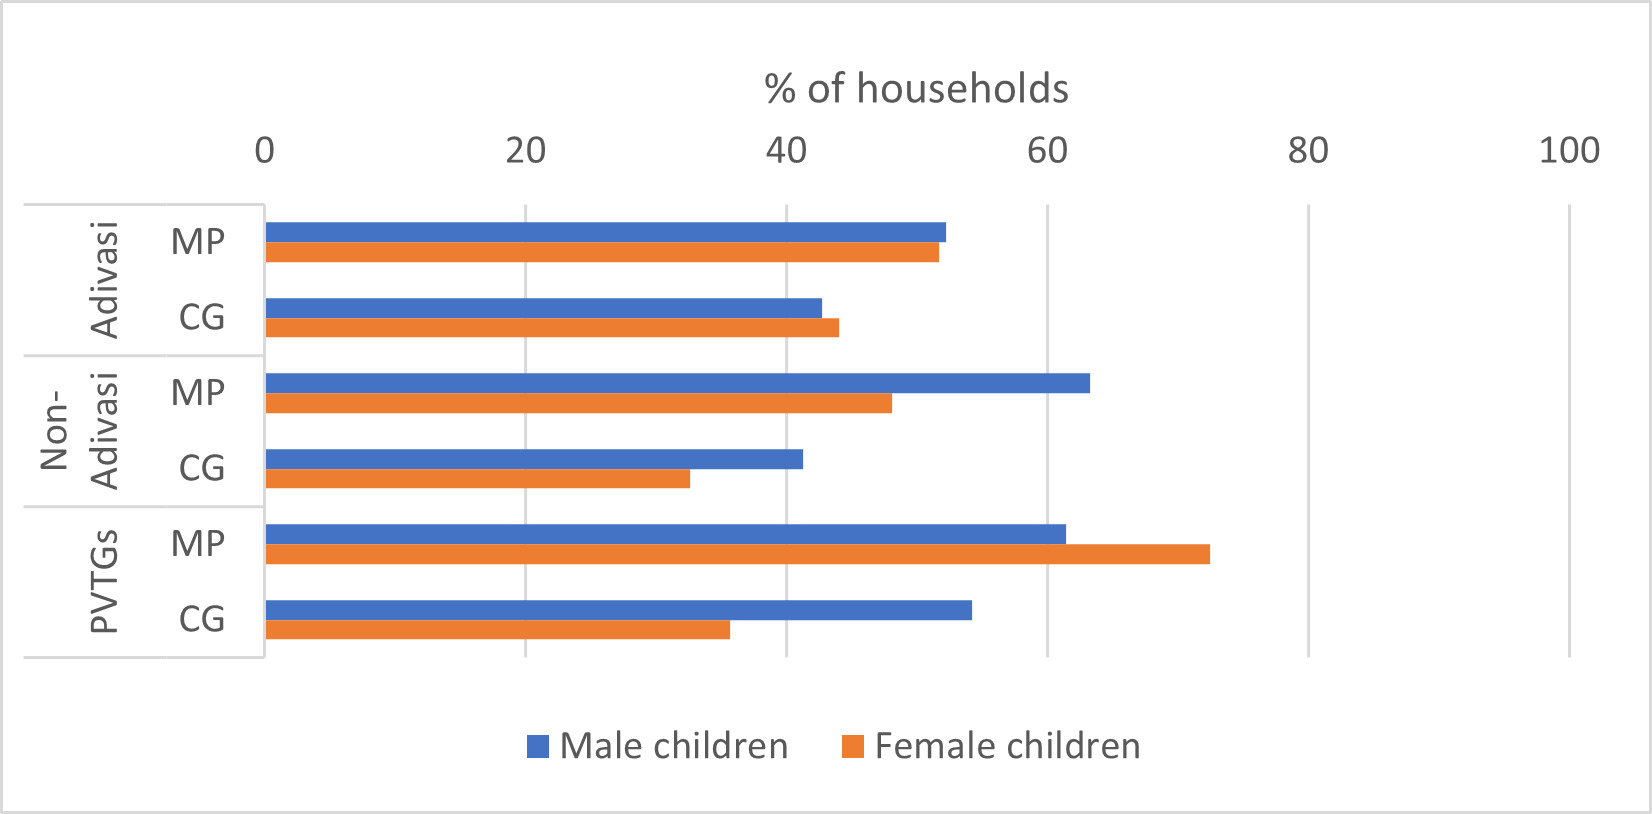
Malnutrition among children: Within the sampled households in MP there were 506 children (276 male and 240 female) and in Chhattisgarh there were 455 children (239 male and 216 female) below the age of 60 months. Head circumference is one of the indicators of malnutrition among children below five years.3 Trained enumerators measured their head circumference with a measuring tape, and found that children from MP showed higher malnutrition as compared to children from Chhattisgarh. The non-Adivasi households in MP fared most poorly. Separate studies are needed to probe into this issue further and to understand the underlying reasons.
Figure 5: Share of children under five with malnutrition
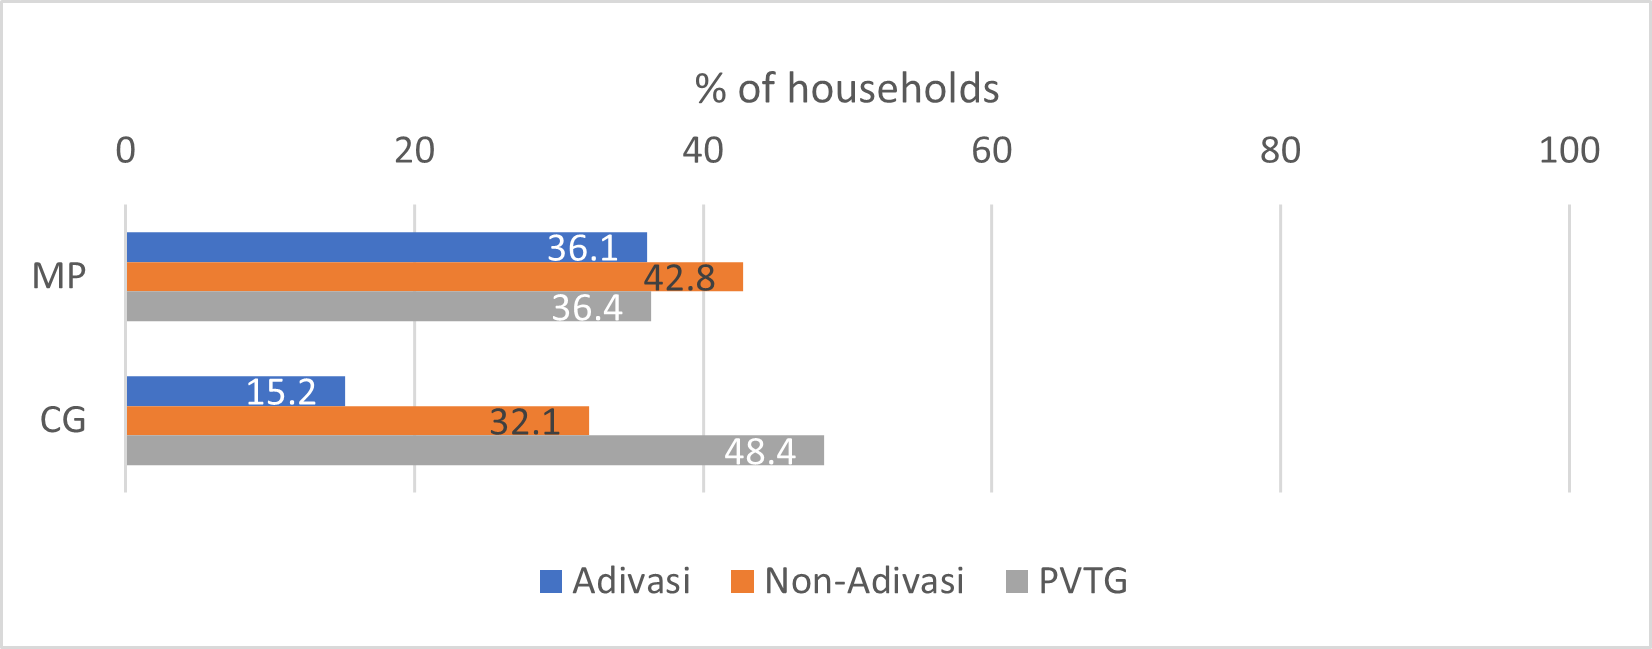
Increasing landlessness: The rate of landlessness among rural households in both states significantly surpasses the national average of 8.2%. It is important to understand what is contributing to this high level of landlessness among Adivasis in these two states, since access to land and forests has been an integral part of Adivasi identity. Displacement and dispossession from land for development projects is commonly cited as the reason for Adivasis’ loss of land, but this may not be the sole contributor. Further study is needed to explore the contributing factors and potential changes over the past decade.
Figure 6: Share of landless households
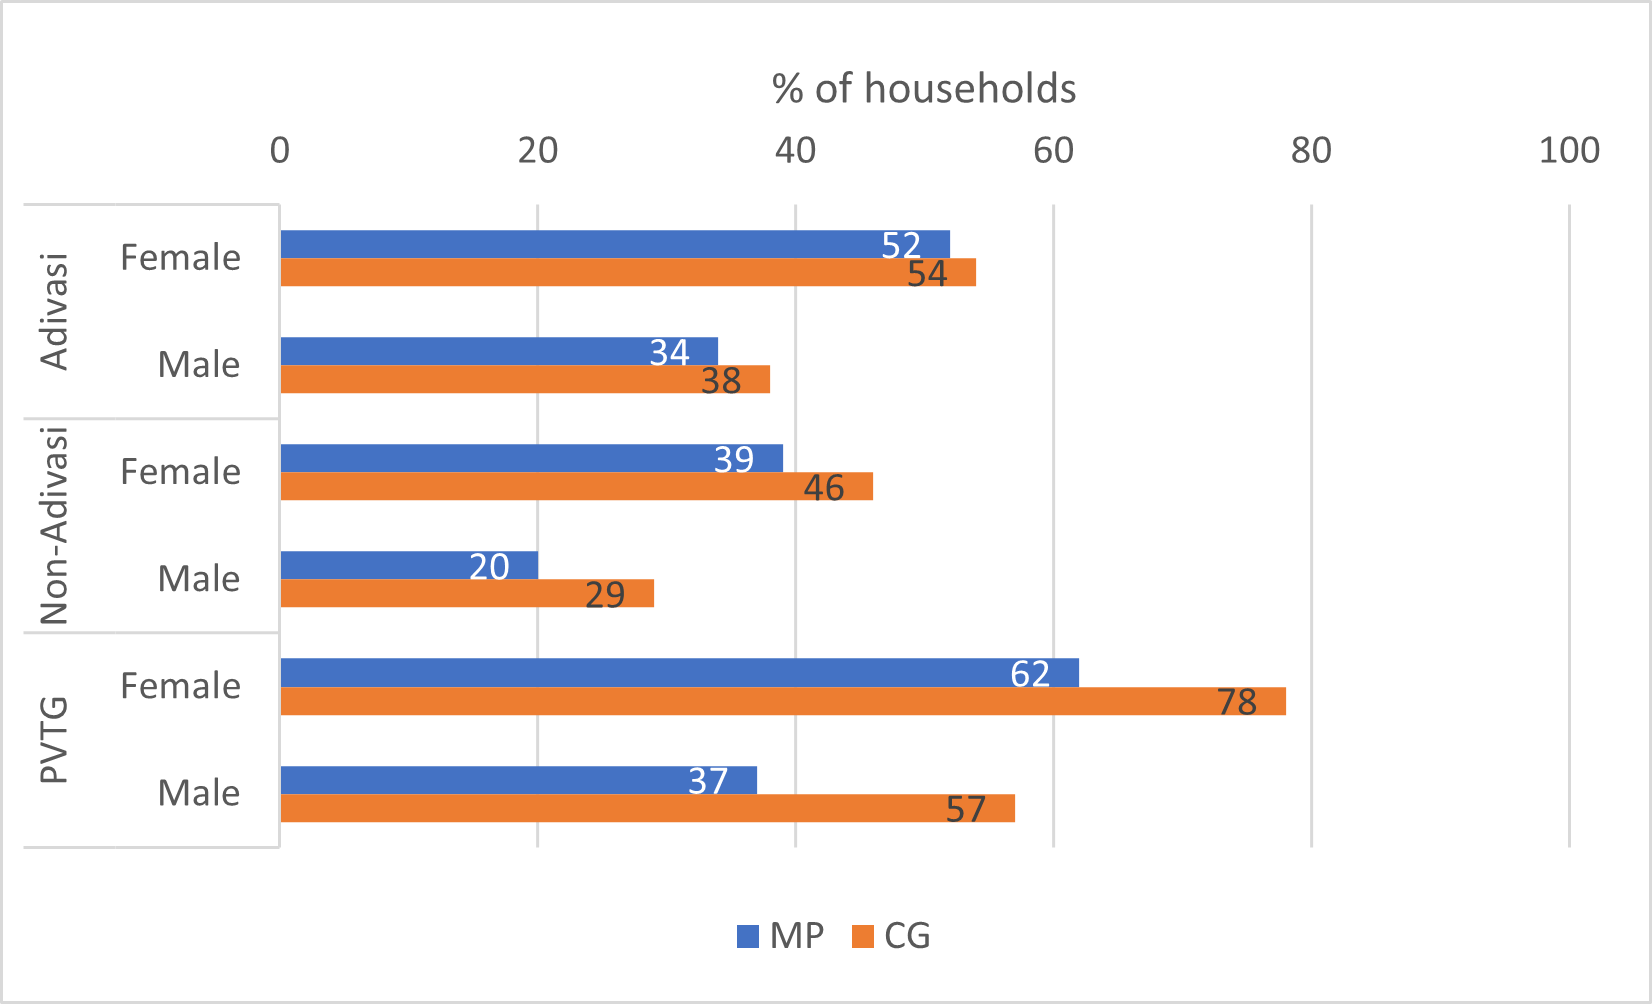
Functional literacy: In surveyed villages, functional literacy tests were administered to heads of households and their spouses. Most of these individuals are within the age range of mid-30s to mid-40s, and were supposed to complete their primary education around 25 to 35 years ago. However, the results reveals that a majority of them did not even attend schools during their childhood.
Figure 7. Share of respondents who cannot read and write
Access to road connectivity and Anganwadis: Despite the above inadequacies, Adivasi villages in both Madhya Pradesh and Chhattisgarh exhibit improved road connectivity, with almost 80% of these villages having access to all-weather roads. However, only 42% of Adivasi villages in MP and 30% in Chhattisgarh are connected by public transport. Anganwadis, or childcare centres, are also present in almost 100% of Adivasi villages in both states.
Way forward
While the SAL report primarily focuses on presenting the current state of Adivasi livelihoods without offering specific recommendations, personal interviews yield valuable suggestions for potential improvements. The quality of education in Adivasi areas has been identified by the communities as a crucial factor where government and non-government agencies should focus. Many of them said that the kind of education Adivasi children and youth get does not help them compete with non-Adivasi students. The necessity of vocational education to help acquire employable skills is also highlighted.
Almost all interviewees believe that the local governance system has to be strengthened in Adivasi areas, giving the local bodies the right to plan and execute what they need. According to them, this plan ought to be based on the values and worldviews of Adivasis. In contrast, most plans by the government and other agencies seem to reflect mainstream values of individualism, wealth accumulation and exploitation of resources.
A majority of interviewees put forth the view that the effective implementation of the Forest Rights Act, 2006 – especially in terms of community rights – can help rejuvenate forest biodiversity.
All the interviewees emphasise the importance of preserving Adivasi identity, tradition, culture, and customs so that their alternative values such as collectivism, living in harmony with nature, non-accumulation of wealth, do not get lost. Adhering to those values is the only way to save not only Adivasis, but also the entire human race.
Notes:
- Adivasis are people generally belonging to the administrative category of ‘Scheduled Tribes’, primarily living in the central Indian belt.
- In the 77th Round of the National Sample Survey (NSS) (2019), an agricultural household is defined as one receiving over Rs. 4,000 annually from the sale of agriculture produce (crops, horticultural crops, fodder crops, plantation, animal husbandry, poultry, fishery, piggery, bee-keeping, vermiculture, sericulture, etc.) and having at least one member self-employed in agriculture, either in the principal or subsidiary status, during the last 365 days.
- The head circumference of a child should ideally fall within the 3-97 percentiles of the recommended population scores.
Further Reading
- Coates, J, A Swindale and P Bilinsky (2007), ‘Household Food Insecurity Access Scale (HFIAS) for Measurement of Household Food Access: Indicator Guide’, Food and Nutrition Technical Assistance Project.
- Drèze, J and A Sen (2013), An Uncertain Glory: India and its Contradictions, Princeton University Press.
- National Statistical Office (2021), ‘Situation Assessment of Agricultural Households and Land and Livestock Holdings of Households in Rural India, 2019’, NSS Report No. 587, Government of India, New Delhi.
- PRADAN (2022), ‘Status of Adivasi Livelihoods (SAL) 2021’.
- PRADAN (2024), ‘Status of Adivasi Livelihoods (SAL) 2022’.


 16 February, 2024


Comments will be held for moderation. Your contact information will not be made public.