

 16 August, 2018


Indian agriculture remains vulnerable to the vagaries of weather, and the looming threat of climate change may expose this vulnerability further. This article presents findings from a study that uses new data to analyse the impact of weather shocks on agricultural productivity in the short run, and that of climate change in the long run. It shows that climate change could reduce farm incomes by 15-18%, and by 20-25% in unirrigated areas.
Agriculture is important in India for the obvious reason of its centrality, given that it accounts for a large share in GDP (gross domestic product) (16%), and an even larger share in employment (49%). Perhaps it is even more important because, as the experience of the last few years illustrates, it has the potential to hold back Indian development: poor agricultural performance can lead to high inflation, rural distress, and political restiveness.
Agriculture in India continues to be vulnerable to the vagaries of weather, and the looming threat of climate change has the potential to expose this vulnerability further. A small but growing literature has focused on estimating the impact of weather and climate on economic performance. However, most of these are either cross-country studies, or focus on developed countries, primarily for data reasons, and therefore may not be applicable to a large, climatically diverse country such as India (Deschênes and Greenstone 2012, Dell et al. 2012, 2014, International Monetary Fund (IMF), 2017, Burke et al. 2015).
There are a couple of important exceptions. Guiteras (2009) finds that crop yields will decline by 4.5-9% in the short-run (2010-2039) and by a whopping 25% in the long-run (2070-2099) in the absence of adaptation by farmers. Further, Burgess et al. (2014) find that a one standard deviation1 increase in high temperature days in a year decreases agricultural yields and real wages by 12.6 % and 9.8%, respectively, and increases annual mortality among rural populations by 7.3 % in India. By contrast, in urban areas, they find virtually no evidence of an effect on incomes and a substantially smaller increase in the mortality rate.
Our study brings to bear new data (covering a longer and more recent period, larger geographical area, and more spatially disaggregated) to analyse the impact of weather shocks on agricultural productivity in the short run, and that of climate change in the long run. We also consider possible policy options to reduce vulnerability in Indian agriculture.
The study
To understand the long-run impact of climate change in India, we examined the impact of rainfall, temperature, and extreme events associated with them, featured in Chapter 6 of the Economic Survey 2017-18 (Government of India, 2018). We use a district-level panel of agricultural production in India, and a new dataset on rainfall and temperature, covering the period 1970-2015, to answer a number of important questions:
- What have been the trends in rainfall and temperature over the past four and a half decades?
- What are the average effects of rainfall and temperature on agricultural productivity?
- To what extent can irrigation mitigate these effects?
- How significantly will climate change affect agricultural productivity?
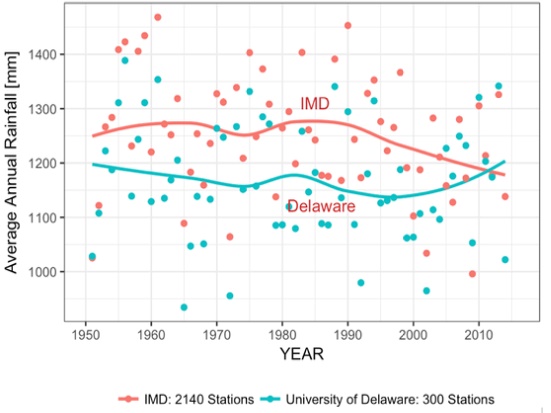
Another reason to undertake the analysis relates to data quality. Raw data on temperature and rainfall are recorded by ground weather stations, which are spatially interpolated into standardised grids. The Indian Meteorological Department (IMD) maintains data for more than 6,000 rainfall stations and around 300 temperature stations. Existing studies on India involving rainfall or temperature data primarily use one of the following datasets: the Global Human Climate Network (GHCN) maintained by the National Oceanographic Association of America (NOAA) at NASA (National Aeronautics and Space Administration) or University of Delaware Precipitation Climatology. The raw data for all these datasets are sourced from the IMD but rely on far fewer weather stations; for instance, NOAA procures data for only 45 temperature stations across India. India is a climatically diverse country with the third highest number of climate zones (16 Köppen classification) globally. Fewer weather stations limit the accurate understanding of local weather variations. Our analysis uses the universe of weather stations available to the IMD and is therefore more representative of actual weather patterns. This distinction turns out to have crucial implications. As shown in Figure 1, IMD data report significantly higher average temperatures (by 1 degree Celsius) and higher average rainfall (by about 100 mm per year) compared to the University of Delaware dataset. Any analysis of climate change and its consequences are therefore likely to be very different across these datasets.
Figure 1. Temperature and rainfall: Comparison of Indian and international data
a) Average annual temperature
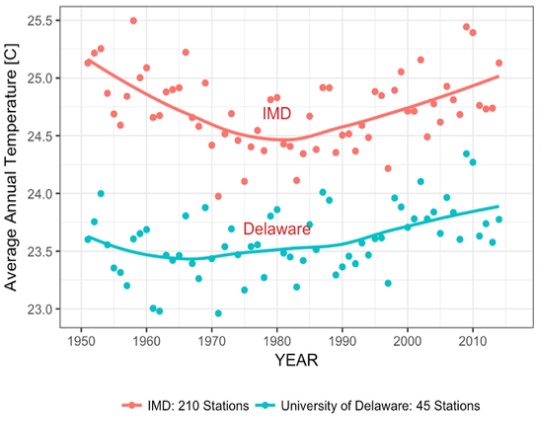
b) Average annual rainfall
What have been the trends in rainfall and temperature over the past four and a half decades?
Average annual temperatures have risen by around 0.48 degrees (between 1970 and 2016), and average monsoon rainfall has declined by 26 mm (between 1970 and 2016). We also find that there has been a steady increase in temperature extremities. The number of ‘very hot’ days as well as the number of dry days has increased, consistent with models of climate change which predict increased variability in weather.
The productivity effects of weather
Next, we turn our attention to the effects of these changes in temperature on agricultural output and yields. A simple correlation at the district level, say between average temperature and average agricultural productivity, will not yield the causal effects of interest. For example, if we find that hotter districts have lower average productivity, it could be because of temperature, but it could also be because of several other factors correlated with temperature – soil quality, availability of water, and so on.
Our approach, instead, is to use year-on-year fluctuations in a district’s rainfall and temperature to identify the effects of weather on agricultural productivity. Such an empirical strategy does not compare hot districts with cold ones, or dry ones with wet ones. Instead, it looks at how agricultural production in the same district changes when rainfall and temperature in that district change. We then combine these estimates with projections of temperature and rainfall from climate models to predict the impact of climate change on agriculture.
For this analysis, we combine the ICRISAT (International Crops Research Institute for the Semi-Arid Tropics) district-level database with data from the Ministry of Agriculture, Government of India, to construct a district-level panel on crop production, land use, yields and irrigation, covering the period 1970-2015.
Short-run impact
We conduct the analysis for each cropping season separately, and our key findings are illustrated in Figures 2 and 3. In these figures, the x-axis plots deciles of rainfall and temperature with the 5th decile being the omitted category against which all comparisons are made. So, if a district’s temperature were in the 10th decile (that is, the hottest possible), Kharif yields (from July to October) in irrigated areas would be 3% lower than if the temperature was normal. This number rises to 10% for unirrigated areas. Similarly, if rainfall was in the 1st decile (that is, the driest possible), Kharif yields in irrigated areas would be 13% lower than if rainfall was normal, and this number rises to 18% for unirrigated areas.
Figure 2. Effects of temperature on yields in irrigated (green) and unirrigated (red) areas
a) Kharif
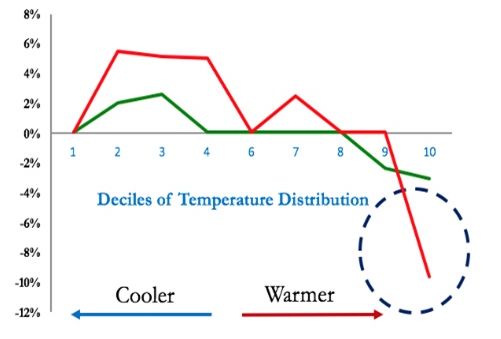
b) Rabi
Source: Survey calculations from IMD and ICRISAT data.
Notes: (i) The x-axis plots the deciles of rainfall with the 5th decile being the omitted category against which all comparisons are made.
(ii) Kharif season is from July to October.
(iii) Rabi season is from October to March.
![]()
These graphs illustrate two crucial findings:
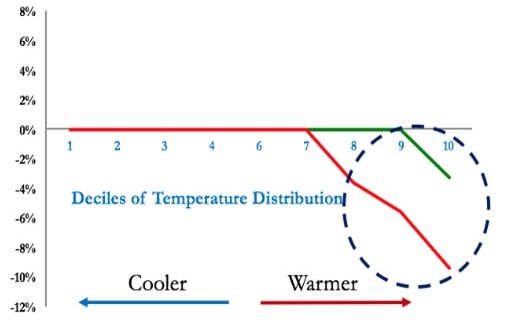
- The effects of temperature and rainfall on crop yields are highly non-linear, and felt almost exclusively in the extremes. ‘Moderate’ shocks such as temperature in the 7th decile or rainfall in the 3rd decile have little or no effect on crop yields.
- There is large variation (heterogeneity) between irrigated and unirrigated areas – irrigated areas are far less susceptible to weather shocks. This is illustrated by the fact that for a majority of instances the red line in Figures 2 and 3 lies below the green line, especially at the extremes of the temperature and rainfall distribution.
Figure 3. Effects of rainfall on yields in irrigated (green) and unirrigated (red) areas
a) Kharif
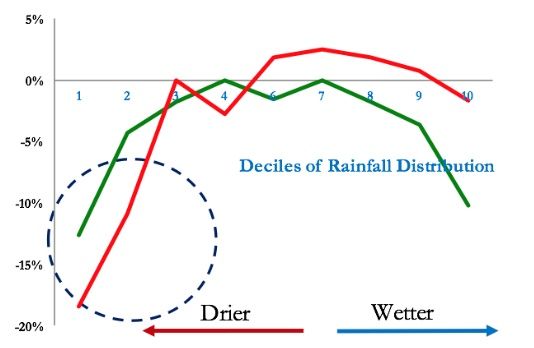
b) Rabi
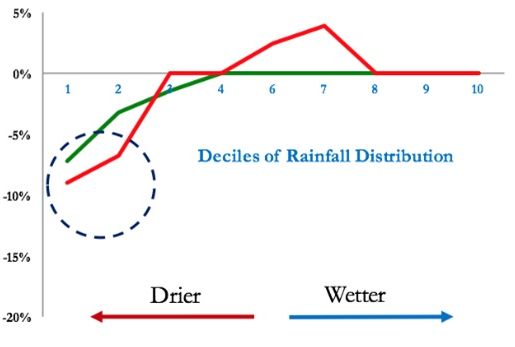 Source: Survey calculations from IMD and ICRISAT data.
 Beyond level of temperature and rainfall
The relationship between weather and agricultural production is governed by factors other than just the level of temperature and rainfall. For example, the timing of rainfall can have significant effects on productivity. The availability of daily rainfall data allows us to explore this question quantitatively. Even after controlling for the levels of temperature and rainfall, each additional ‘dry day’ during the monsoon (that is, days with less than 0.1 mm rainfall) reduces yields by 0.2% on average, and by 0.3% in unirrigated areas.
What do these estimates mean for farmer incomes?
An extreme rainfall shock (defined as rainfall in the bottom two deciles) reduces farm revenues during the kharif by 7% in irrigated areas and by 14.3% in unirrigated areas. Similarly, an extreme temperature shock (defined as temperature in the top two deciles) reduces rabi yields by 3.2% in irrigated areas and by 5.9% in unirrigated areas.
Long-run impact
There are three central channels through which climate change will affect agricultural productivity in the long run:
- a change in average temperature levels,
- a change in average rainfall levels, and
- a change in the number of dry days.
The Inter-Governmental Panel on Climate Change (IPCC) predicts that temperatures in India are likely to rise by 3-4 degrees Celsius by the end of the 21st century (Pathak et al. 2012). Combining these predictions with our estimates imply that in the absence of any adaptation by farmers, such as change in cropping techniques or expansion in irrigation, agricultural incomes will fall by 12% on average, and by as much as 18% in unirrigated areas by the end of the century.
Climate models do not have clear-cut predictions for changes in average levels of rainfall. However, if we extrapolate from the observed decline in rainfall over the past three decades, farm incomes could decline by as much as 12% for kharif crops and 5.4% for rabi crops in unirrigated areas.
Most models of climate change predict an increase in the variability of rainfall, in particular, an increase in the number of dry days as well as days with extremely high levels of rainfall. Once again, extrapolating from the observed increase in the number of dry days over the past three decades, this channel alone could account for a 1.2% decline in farm incomes.
Of course, it is likely that increases in temperature, decreases in rainfall levels, and increases in rainfall variability are correlated with each other. Back-of-the-envelope calculations suggest that after taking these correlations into account, climate change could reduce farm incomes by 15-18% on average, and by as much as 20-25% in unirrigated areas.
Policy implications
Given these stark findings in a context of already low farm income levels, it is crucial to develop policies to make agriculture more resilient to changes in climate. At least three policy tools will help in meeting this challenge:
- First, there is an urgent to need to spread irrigation. While significant progress has been made over the past few decades, the proportion of cultivated land under irrigation is less than 50% today – a lot remains to be done. The central challenge here is that this spread of irrigation needs to take place against the backdrop of diminishing ground water reserves, particularly in parts of north India.
- Second, research in agriculture technology needs to be stepped up in order to develop crop varieties and cropping techniques which are more resilient to the vagaries of weather.
- Finally, subsidies (power and fertiliser) that favour the indiscriminate use of water need to be rationalised and reduced, and support should instead be extended through non-distortionary forms such as direct transfers (as Telangana is attempting today). More generally though, the cereal- and sugarcane-centricity of agricultural policy must be reviewed and overhauled (Subramanian 2017).
This article first appeared on VoxDev: https://voxdev.org/topic/agriculture/climate-change-and-indian-agriculture
Note:
- Standard deviation is a measure that is used to quantify the amount of variation or dispersion of a set of values from the mean value (average) of that set.
Further Reading
- Burgess R, O Deschenes, D Donaldson and M Greenstone (2017), “Weather, climate change and death in India”, working paper, London School of Economics.
- Burgess R, O Deschene, D Donaldson, and M Greenstone (2014), ‘The Unequal Effects of Weather and Climate Change: Evidence from Mortality in India’, Working Paper, MIT. Available at: http://econ.lse.ac.uk/staff/rburgess/wp/WD_master_140516_v3.pdf
- Dell, Melissa, Benjamin F Jones, and Benjamin A Olken (2014), “What do we learn from the weather? The new climate–economy literature”, Journal of Economic Literature52(3): 740-798. Available at: https://economics.mit.edu/files/9138
- Dell, Melissa, Benjamin F Jones, and Benjamin A Olken (2012), “Temperature shocks and economic growth: Evidence from the last half century”, American Economic Journal: Macroeconomics4(3): 66-95. Available at: https://scholar.harvard.edu/files/dell/files/aej_temperature.pdf
- Deschênes, Olivier and Michael Greenstone (2012), “The economic impacts of climate change: Evidence from agricultural output and random fluctuations in weather: reply”, The American Economic Review 102(7): 3761-3773. Available at: https://pdfs.semanticscholar.org/0022/f77f7e26f71e73c96fbfdccbfc6e4df05868.pdf
- Government of India (2018), ‘Economic Survey of India, 2017-18’.
- Guiteras R (2009), ‘The impact of climate change on Indian agriculture’, Mimeo, Department of Economics, University of Maryland. Available at: http://econdse.org/wp-content/uploads/2014/04/guiteras_climate_change_indian_agriculture_sep_2009.pdf
- IMF (2017), ‘World Economic Outlook: Seeking Sustainable Growth – Short-Term Recovery, Long-Term Challenges’.
- Pathak H, PK Aggarwal, and SD Singh (2009), ‘Climate change impact, adaptation and mitigation in agriculture: methodology for assessment and applications’, Indian Agricultural Research Institute, New Delhi.
- Subramanian A, (2017), ‘Transforming Indian agriculture: By loving some agriculture less and the rest more’, Lecture at National Academy of Agricultural Sciences.

By: Sanjay Singh Rathore 02 July, 2021
I think instead of spreading the irrigation network in the country, we need to look deeper into efficient water use techniques. India is one the leading country in irrigation infrastructure, even more than the US. But inefficient use of irrigation water is the major problem.