

 06 October, 2021


The imposition of a nationwide lockdown in March 2020 to check the spread of Covid-19, sparked debates on the necessity and effectiveness of such measures keeping in view to resulting economic hardships. In this post, Chadha and Naik examine the correlation between Covid-19 spread and mobility in the district of Pune in Maharashtra state, between January and July 2021.
Rarely are trade-offs inherent in policymaking as stark as they have been during the current pandemic. In the absence of any pharmacological interventions1, decision-makers have relied on social distancing measures and mobility restrictions to reduce the spread of the pandemic. This has sparked debates on the necessity and effectiveness of such measures due to the economic hardships caused by ‘lockdowns’ (or containment and other forms of restrictions). On the other hand, there are concerns about the mass spread of the disease, overburdening of the healthcare system, and loss of lives, if restrictions are not imposed. Against this backdrop, we seek to examine the link between the spread of Covid-19 and mobility over time.
Restrictions on mobility and rational choices
Most of these debates and – to the best of our knowledge – the majority of epidemiological models consider individual mobility as ‘exogenous’ (see for example, Agrawal et al. 2021), that is, individuals do not actively make the decision to move around outside their homes. Their mobility is pre-determined and any change in that is simply a response to external restrictions rather than the result of their own decision-making process. In this post, we ask: how should rational individuals respond to the spread of the Virus, and an increased risk of infection?
To think through this, we consider a ‘trip’ to be the unit of mobility. A trip is a combination of origin, destination, and mode of transport. Individuals decide to undertake a trip if the benefits of the trip are higher than the costs. Thus, the purpose of the trip, distance, and mode of transport, characteristics of the origin and destination, are all important parameters in the decision of undertaking a trip. What if we factor in the risk of infection from the Virus? If an individual is aware of how the Virus spreads, then an increase in the number of cases – either at the origin or destination – will increase the chances of getting infected and in turn increase the cost of undertaking the trip. Thus, the willingness to take the trip will reduce (for any level of risk aversion), given the benefits of taking the trip remain the same.
This is a rational response at an individual level. However, this response can generate externalities at an aggregate level since everyone in society will behave in the same way – they undertake a trip if the benefits to them exceed costs. Thus, to the extent that the benefits of an individual taking a trip depend on the presence of other people at the destination, if the other people choose not to be mobile, then the benefit from the trip for the individual will also go down. For example, if my business associates do not have physical meetings, my benefit from taking the trip is significantly reduced. Hence, this effect is a form of externality. Note that both of these effects – the individual response and the externality – work in the same direction: they reduce the number of trips taken and consequently reduce aggregate mobility.
This, of course, does not mean mobility will fall to zero (or close to it). Sometimes the cost of not making the trip could simply be too high, as it may be imperative to engage in work that requires mobility – to earn a livelihood, seek medical care, or to buy essentials, and so on. However, we argue that there should be an observed negative correlation between increase in the number of cases and individual mobility – even in the absence of external restrictions.
Measuring mobility during the pandemic
While we do not have access to individual-level mobility data, we do have real-time aggregate mobility data from Facebook’s movement maps2 , to test this hypothesis. We compare the period between 1 January 2021 and 30 June 2021, to baseline data from 45 days prior to 20 March 2020 (the national lockdown was imposed on 24 March 2020).
Facebook’s movement map information is provided three times a day – 8 am, 4 pm, and midnight UTC (Coordinated Universal Time). Hence, we divide the day into three periods and measure mobility as any change in modal location3 between two successive time periods, as reported at the end of that period4. We use data on mobility at the district level. We sum mobility across the three time periods of the day, and obtain aggregate daily estimates for the number of people moving between two districts (between-district mobility) as well as within the boundaries of a district (within-district mobility).
To understand changes in mobility over time we construct three metrics for each district: inflow (from all districts into that district), outflow (from the particular district to all others), and within-district mobility5. All these metrics measure change over the baseline period.
The case of Pune
We find it most instructive to develop the idea through the example of one district. We focus on the district of Pune during the second wave of Covid-19 in India (roughly between February 2021 and June 2021). As one of the most-affected districts, in the most-affected state in the country (Maharashtra), Pune offers a good test case for our hypothesis.
We plot the number of active cases per 1,000 individuals, and the percentage change in mobility over the study period (Figure 1).
Figure 1. Active Covid-19 cases (per 1,000) and inflow/outflow of people in Pune
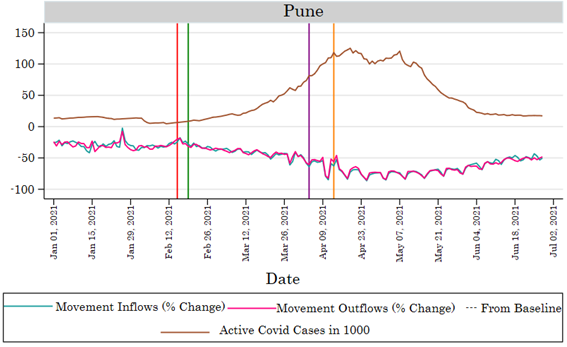
Compared to the baseline period, between-district mobility has been very low, on average, during the second wave. Even in January 2021, a period of relative normalcy following the first wave, average mobility was lower than the baseline.
As soon as the active cases start increasing, mobility starts declining. We mark some important dates on the graph – the imposition of the night curfew on 4 April, and the full lockdown in the state on 13 April. As indicated in the graph, mobility starts declining much before any announcements by the state government. The other crucial finding, is the lack of discontinuity in mobility before and after the announcement of the lockdown: had it been external restrictions causing a reduction in mobility, we would have likely observed a sudden fall in mobility post the lockdown.
A concern here could be that the data come from specific groups within the population, that is, the data refer to those who own a smartphone and use Facebook, and as stated earlier, have the location feature switched on.
As of January 2021, 28.1% of the Indian population was on Facebook. So the data do not refer to a very exclusive population, but we do see an overrepresentation of males 7, likely from an urban and educated background in this data8. We do not have any additional information to precisely pin down the population of Facebook users. This is a limitation of this study and data, if available, from other sources like cell phone providers could offer better coverage. But it is worth asking: how serious a limitation is this for the study? What we argue is that conceptually there should be a negative impact of Virus spread on mobility. This is based on a rational model of decision-making about mobility. We do not expect this response to differ across Facebook and non-Facebook users. The degree of response may of course vary.
Figure 2 below presents similar data for within-district mobility.
Figure 2. Within-district mobility for Pune district
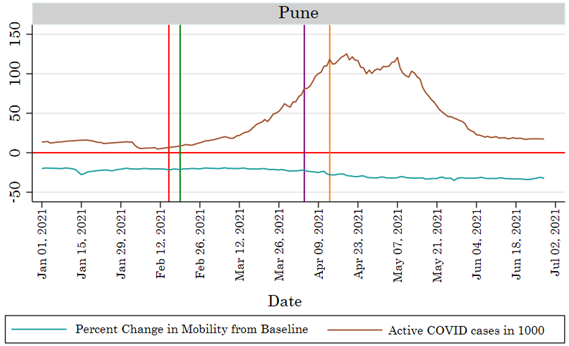
Note: The red line corresponds to 15 February 2021 when mobility starts to decline; the green line corresponds to 19 February when the Chief Minister of Maharashtra announced the possibility of restrictions if COVID appropriate behaviour was not followed (but the announcement related only to certain districts, which did not include Pune); the purple line corresponds to 4 April when Section 144 and night curfews were put in place; and the orange line indicates 13 April when lockdown was imposed across Maharashtra.
The graphs are stark: the active cases and mobility are negatively correlated and, in fact, are near mirror images of each other. We observe a similar qualitative relationship between active cases and mobility as we did in Figure 1 – the difference being that within-district mobility is closer to the baseline than is mobility between districts (inflows/outflows).
It is possible that between-district mobility for Pune fell not because of the Covid-19 cases in Pune, but because of a rise in cases in the other districts from which people travel to Pune (or to which people travel to, from Pune). To check this, we removed the three districts of Akola, Amravati, and Yavatmal, which were seeing an upsurge of cases at the time. However, we find that the relationship between Covid-19 cases and mobility does not change.
Finally, it may be that timely local government response in the form of containment zones lowered mobility even before the announcement of a state-wide lockdown, rather than rational individual response. We discount this explanation for two reasons. First, the containment zones declared in the second wave follow the new micro-containment policy announced by the Ministry of Health. These containment zones have a small geographical spread, often limited to floors within an apartment building, or one or two houses on a street. Thus, they only restrict the mobility of those actually infected and their families/neighbours.
Figure 3. Cumulative number of micro-containment zones in Pune
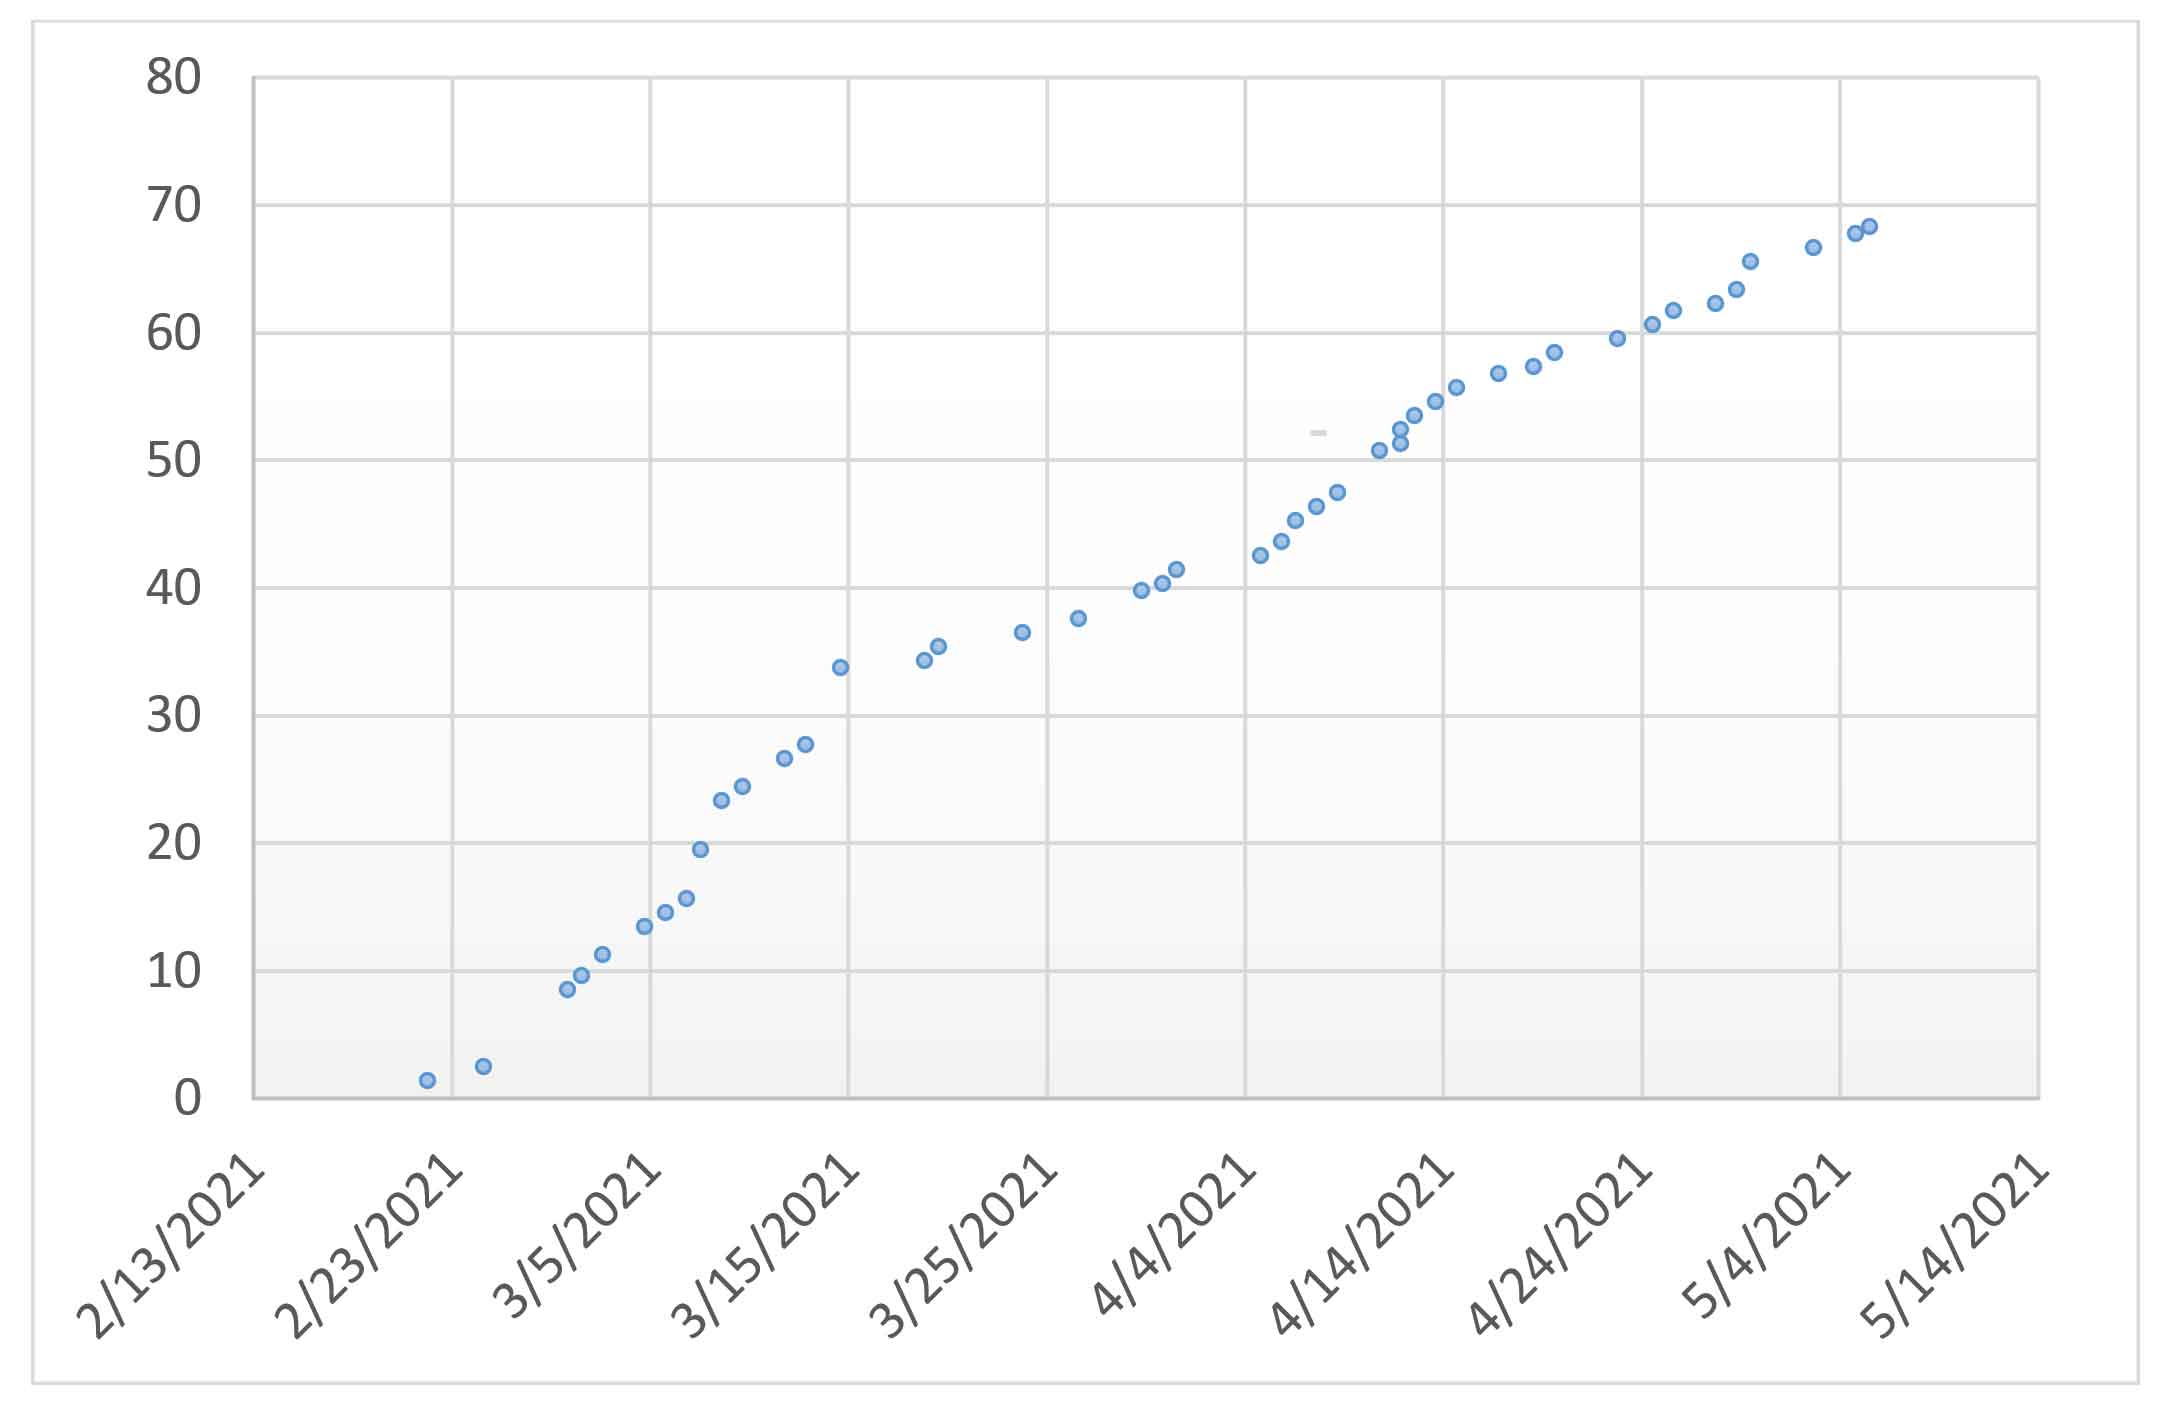
As is clear in Figure 3, a significant reduction in mobility had already taken place by the time the number of containment zones increased to any significant level.
Hence, there appears to be a negative relationship between the spread of Covid-19 and reduction in mobility.
To statistically establish a causal relationship, we use econometric methods to ascertain the relationship between mobility and active Covid-19 cases in all districts of Maharashtra during the period between 1 January 2021 and 30 June 2021 using a dynamic panel9 10.
Our estimates show that an increase of 1,000 Covid-19 cases in the district, reduces inflows into that district by 11-14 percentage points relative to the baseline. Similar results are also obtained for the other measures (within district mobility and outflows from districts).
Conclusion
We find that there is a negative relationship between the spread of the Virus and mobility. Individuals respond rationally to the increased risk of contracting the Virus by reducing their mobility. This is the rational response at the individual level, and is also the result of an externality at the aggregate or society level. This has important implications for current epidemiological models of Virus spread as well as policy decisions – such as containment and other mobility restrictions – made on the basis of such models. Mobility restrictions in these models are ‘exogenous’ – imposed on agents in the model. We show that this is not behaviourally sound since even without restrictions being imposed by an external authority, mobility reduces. This will slow down the spread of the Virus even without the restrictions.
While acknowledging the limitations of the data in terms of its coverage, we show that mobility does not fall discontinuously with the imposition of the lockdown. If people were only restricting their mobility because of the lockdown then there should be a sharp fall in mobility immediately after the lockdown. We do not observe this in our analysis. This raises doubts about the need and the efficacy of state or nationwide lockdowns.
However, this does not mean that there is no scope for government intervention. It is possible that in some places, individual responses to the disease spread are not large enough and so localised restrictions may be needed. Our analysis shows a way to implement these. Governments can track aggregate mobility data as the disease spreads. If the response to the Virus spread is not adequate then restrictions may need to be imposed. These data can help decide the timing and location of the restrictions more accurately.
I4I is now on Telegram. Please click here (@Ideas4India) to subscribe to our channel for quick updates on our content
Notes:
- While the availability of vaccines has provided another instrument to policymakers, once the Virus spreads, measures of social distancing are still the only available way to slow the spread as there is no particular curative treatment.
- These datasets use location data from those customers’ devices who have this feature switched on. Location data allow companies to provide customised services to their customers. For more information on these and other similar data, see https://dataforgood.fb.com/approach/.
- Location in this data refers to ‘tiles’ on a map.
- It should be noted that this method of defining mobility misses short duration trips.
- For instance:

- Section 144 of the Code of Criminal Procedure usually imposes restrictions on movement and unlawful assembly – generally believed to be an assembly of three or more persons.
- https://napoleoncat.com/stats/facebook-users-in-india/2020/01/
- The expectation that Facebook users in India are more likely to be urban and educated is based on mobile phone ownership patterns in India. See, for example, Paul and Murti (2016).
- Panel data measure the same set of observations (individuals in this case) repeatedly across time. Dynamic panel data models contain one or more lags (previous time periods) of the dependent variable. Such models are useful if there is a possibility of serial correlation.
- We also include seven lags of the mobility variable as independent variables. In some specifications we also include district dummies to only study the relationship within the same district over time.
Further Reading
- Agrawal, M, M Kanitkar and M Vidyasagar (2021), ‘ SUTRA: A Novel Approach to Modelling Pandemics with Asymptomatic and Undetected Patients, and Applications to COVID-19 ’, arXiv Working Paper.
- Paul, GD Bino and Ashutosh Bishnu Murti (2016), ‘Socio-economy of mobile phone ownership in India’, in N Siddharthan and K Narayanan (eds.), Technology . (pp. 157-168). Springer, Singapore .

Comments will be held for moderation. Your contact information will not be made public.