

 27 May, 2019


Recent statistics have drawn attention to the turning of India’s investment cycle since the second half of 2017-18. In this piece, Isha Gupta examines the different components of investment demand and critically evaluates the industrial growth rate in the past few years. She contends that quoting near-term data undermines industry-specific instability and overlooks the structural shift of the economy to a lower investment rate and real output growth, which is yet to gain momentum.
In its report ‘Global Economic Prospects: Darkening Skies’, released in January, the World Bank forecasts India's Gross Domestic Product (GDP) growth at 7.3% for the current financial year, thereby making it the fastest-growing major economy in the world. It states that this growth is underpinned by the strengthening of domestic demand in the midst of an uncertain global environment, with investment growth continuing to consolidate amid GST (goods and services tax) harmonisation and credit rebounds1. Besides, the recent national income data of the Central Statistics Office (CSO) and the Monetary Policy Report (October 2018) of the Reserve Bank of India (RBI) emphasise on the speeding up of industrial activity and firming up of private investment since the year 2017-18. They highlight that the durable rise in real investment activity that is assumed to sustain the growth momentum, has resulted in a sharp acceleration in manufacturing sector growth and consequently expanded the aggregate supply-side of the economy. Figure 1 displays the real growth rate for industry and its sub-sectors.
Figure 1.Real growth in industry and its sub-sectors
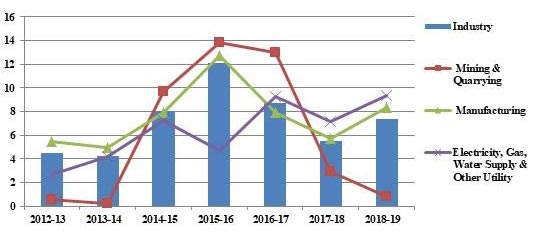
Source: RBI Handbook of Statistics on the Indian Economy.
As observed, the short period of above-trend industrial growth in recent times fails to capture the prolonged period of low, unstable, below-trend growth rates of the previous years. Moreover, these recent growth numbers come on a low base of several quarters of poor growth, where the growth rates of high-frequency indicators is notably lower than those during the high-growth period. This implies that when we analyse the extended statistics, they paint a dismal picture of the investment climate and corroborate the decelerating investment trend for the Indian economy since the preceding years.
Investment components of real GDP
If we look at the investment share of real GDP, it has fallen from 39% in 2011-12 to 31% in 2017-18; gross capital formation (GCF) as a percentage of total output has been on the decline, trend not only for the aggregate output but also for the various sub-sectors of industry and services since 2011-12 (Figures 2, 3 and 4). But when we consider quarterly growth rates since the second half of 2017-18, it is seen that GCF has accelerated to double-digit growth in recent months due to robust investment activity reflected in steel and cement production, import of capital goods, and rising investment in the construction sector. However, this quarterly growth has been feeble that is primarily caused by favourable base effects and does not warrant any pickup in the investment cycle. Despite major policy reforms such as the introduction of GST and resolution of problems associated with non-performing assets of the banks, GCF does not show any definite signs of warranted reversal.
Figure 2.Gross Capital Formation for aggregate output and across sectors
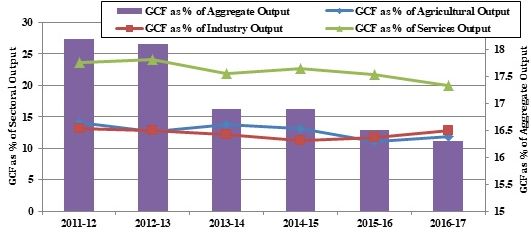
Source: CSO.
Figure 3.Gross Capital Formation for industrial sector
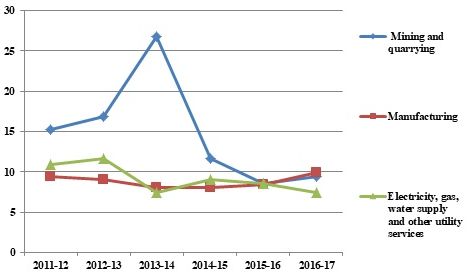
Source: CSO.
Figure 4.Gross Capital Formation for services sector
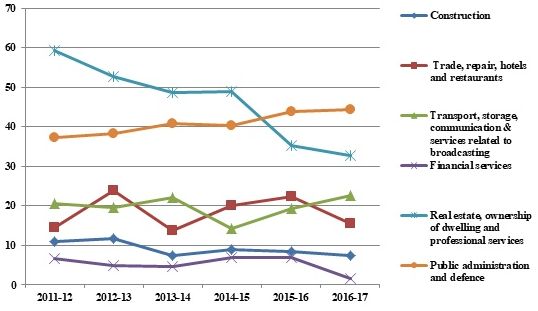
Source: CSO.
This year’s Economic Survey has spotlighted India’s growing macroeconomic stability owing to its enhanced business climate, higher ranking in the Ease of Doing Business index, and upgraded sovereign ratings. However, the investment rate, mainly the fixed investment component, has been decelerating since 2013-14, which has not only debilitated the domestic demand conditions within the economy, but also depressed the capacity utilisation rate to a value lower than its long-term average of 75% for most of the quarters in the last few years (Figure 5). Therefore, it is imperative that this trend of declining fixed investment rate is upturned in order to realise the potential growth of around 8% in the years to come.
Figure 5. Capacity utilisation rate in manufacturing
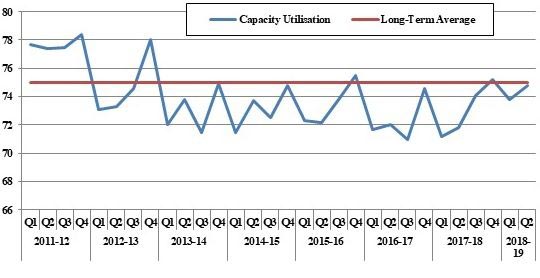
Source: Order Books, Inventories and Capacity Utilisation Survey (OBICUS) on the Manufacturing sector, RBI.
Although difficulties related to land acquisition, power situation, and infrastructure bottlenecks have been addressed to some degree, it is the twin-balance sheet stress for banks and corporations that has continued to act as a drag on investment activity over the last few years. Empirical analysis suggests that investment declines flowing from balance sheet problems are much more difficult to reverse because higher leverage constrains firms’ ability to invest, resulting in slowdown in fresh investment.
If we consider the year-on-year growth in average backlog and pending orders (Figure 6), they exhibit a sharp rise since the beginning of 2017-18, accompanied by the shrinkage of new order books in the previous four quarters. The number of stalled projects has also not shown any improvement in both the private and government sectors. This is supplemented by the following findings of the Centre for Monitoring Indian Economy (CMIE):
- Fiscal year (FY) 2017-18 witnessed new investments worth Rs. 6.6 trillion that are lower by 52% in value terms when compared with investments worth Rs.13.8 trillion announced in FY2016-17.
- Shelving, stalling, and abandoning of projects were at an all-time high during FY2017-18, when commissioning of new capacities declined by 42% and investments worth Rs.7.6 trillion were scrapped.
- This is the third consecutive year of a fall in new investments since they spiked momentarily in FY2014-15; the fall in 2017-18 is sharper than in earlier years.
- Even though new orders received by companies shot up in the quarter ending 30 September 2017 due to upgraded machinery orders and double-digit growth in cement and steel production, new investment proposals continued to remain very low at around Rs.1.5 trillion during this period as well.
Furthermore, it is the public sector that has spearheaded the new investment proposals and drastically reduced its value of stalled projects when compared with the corresponding figures for the private sector investment, which also accounts for the recent momentum in investment activity in sectors such as steel, electricity transmission, roads and renewable power. This indicates that the deceleration in investment cycle would have been much more pronounced had public investment not provided a cushion, which is expected to also generate some multiplier and crowding-in effects since a durable turnaround in the investment cycle largely hinges on the revival in private investment appetite.
Figure 6.Analysis of order books (year-on-year growth)
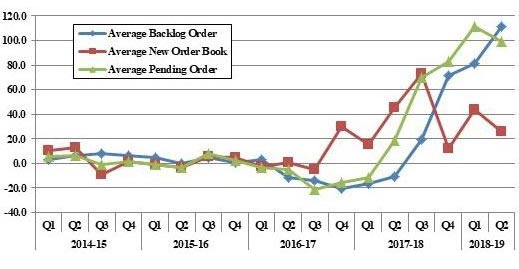
Source: OBICUS Survey on the Manufacturing sector, RBI.
Contribution of industry to real GVA growth
Table 1 below shows that the contribution of industry to real GVA (Gross Value Added)2 growth has declined to just about 20% in 2017-18, two services sub-sectors, namely, ‘public administration, defence and other services’ (PADO) and ‘trade, hotels, transport and communications’, have emerged as significant contributors.
If we look at the sectoral breakdown of real growth rate for industry since the 2012-13, the growth rates of both ‘manufacturing’ and ‘mining &quarrying’ have plunged since 2015-16. Although industrial GVA growth has jumped to 8-10% in recent quarters as industrial production turned broad-based, seasonally adjusted data suggest that favourable base effects were primarily at work so that this growth is still weak when compared with the previous financial years.
Table 1.Contribution of different sectors to growth in real GVA (%)
| 2011-12 | 2012-13 | 2013-14 | 2014-15 | 2015-16 | 2016-17 | 2017-18 | |
|---|---|---|---|---|---|---|---|
| Agriculture, Forestry and Fishing | 22.44 | 5.09 | 16.41 | -0.54 | 1.2 | 13.64 | 7.94 |
| Industry | 0.48 | 18.99 | 15.91 | 25.17 | 33.46 | 28.65 | 20.04 |
| Mining & Quarrying | -13.79 | 0.36 | 0.1 | 3.94 | 5.03 | 5.73 | 1.5 |
| Manufacturing | 10.62 | 17.5 | 14.27 | 19.0 | 27.15 | 20.14 | 16.14 |
| Electricity, Gas, Water Supply & Other Utility | 3.66 | 1.13 | 1.54 | 2.23 | 1.28 | 2.79 | 2.41 |
| Services | 77.07 | 75.92 | 67.68 | 75.36 | 65.34 | 57.7 | 72.02 |
| Construction | 22.43 | 0.62 | 4.0 | 5.31 | 3.94 | 1.57 | 6.91 |
| Trade, Hotels, Transport, Communication & Services related to Broadcasting | 17.43 | 31.42 | 19.51 | 24.0 | 23.5 | 19.28 | 23.41 |
| Financial, Insurance, Real Estate and Professional Services | 16.35 | 33.95 | 36.22 | 31.81 | 28.59 | 18.53 | 22.25 |
| Public Administration, Defence and Other Services | 17.29 | 9.94 | 7.95 | 14.24 | 9.3 | 18.33 | 19.44 |
Source: RBI Handbook of Statistics on the Indian Economy.
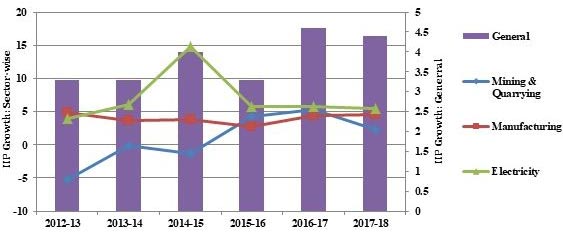
The underlying factor for robust performance of most of the manufacturing industry groups is the increase in public investment in infrastructure such as roads, power generation, civil aviation, telecom, and steel production, to support India’s long-term growth. The augmented production of steel and cement is reinforced by public sector infrastructure projects that include affordable housing and new launches of residential units, which also explain the rise in Index for Industrial Production (IIP) for infrastructure, construction, and capital goods. However, if we observe IIP growth since 2012-13, it has broadly remained stagnant for the manufacturing sector, while it has plummeted for ‘electricity, gas, water supply and other utility’ (Figure 7).
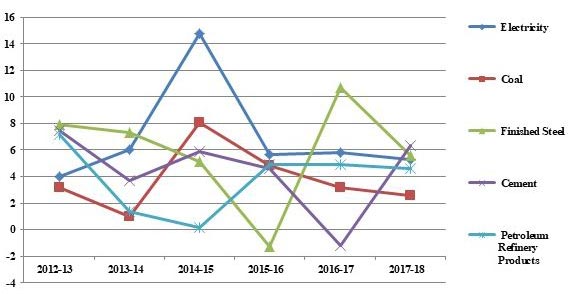
Despite the fact that the frontloading of government expenditure has cushioned the deceleration of GVA during the past few years, it is still inadequate to revive the expansion of output in core infrastructure industries – IIP growth for key infrastructure sectors such as steel, electricity, coal, cement, and petroleum products has mostly remained sluggish since 2014-15 (Figure 8).
This also makes it evident that the subdued performance of the industrial sector is triggered by the weak investment appetite in the private sector and slowing consumption demand, which has not only stifled fresh investments but also created room for excess capacity. It is, therefore, all the more critical to stimulate private sector investment in new and stalled projects to pull industrial growth out of the low-equilibrium trap, which would also facilitate addressing of unavoidable disruptions arising from structural reforms such as the GST. Moreover, in order to realise the medium-term growth outlook of 8%, it is essential that industrial growth rises robustly, which depends not only on the stabilisation of the ongoing macroeconomic reform process, but also on bolstering the domestic demand conditions of the economy. This is particularly because domestic demand constitutes India’s primary engine of growth that is unique amongst the major emerging economies.
Figure 7.IIP growth
Source: RBI Handbook of Statistics on the Indian Economy.
Figure 8.IIP growth of core infrastructure industries
Source: RBI Handbook of Statistics on the Indian Economy.
Notes:
- This refers to an increase in loanable funds to industry.
- GDP provides a demand-side perspective of the economy by looking at the sum of private consumption, gross investment, government expenditure, and net foreign trade, whereas GVA gives a picture of the state of economic activity from the supply side by considering the total output produced in the economy. In accounting terms, the difference between the two is given by net indirect taxes.
Further Reading
- Gupta, Isha (2019), “India’s Faltering Demand Conditions”, Economic & Political Weekly, Vol. LIV, No. 5, 2 February.
- Government of India (2018), ‘State of the Economy: An Analytical Overview and Outlook for Policy’, in Economic Survey 2017-18, Volume 1, Ministry of Finance.
- Government of India (2018), ‘Investment and Saving Slowdowns and Recoveries: Cross-Country Insights for India’, in Economic Survey 2017-18, Volume 1, Ministry of Finance.
- Government of India (2018), ‘An Overview of India’s Economic Performance in 2017-18’, in Economic Survey 2017-18, Volume-2, Ministry of Finance.
- Government of India (2018), ‘Industry and Infrastructure’, In Economic Survey 2017-18, Volume-2, Ministry of Finance.
- Reserve Bank of India (2019), ‘OBICUS Survey on the Manufacturing sector – Q2:2018-19’, 7 February 2019.
- Reserve Bank of India (2018), ‘Monetary Policy Report – October 2018’, 5 October.

Comments will be held for moderation. Your contact information will not be made public.