

 16 June, 2017


This column develops a livelihood resilience index including three key components – bio-physical, economic, and social resources – and estimates the index for districts in the state of Bihar.
Contrary to global experience (Barro and Sala-i-Martin 1991), regional imbalances in well-being in India have risen in the past two decades - a somewhat puzzling phenomenon as market-oriented reforms are expected to facilitate resource flows that tend to equalise returns to factors of production (inputs) across regions. For example, the per capita income of the state of Bihar is only about 40% of the all-India average (Economic Survey 2015-16). The state, struggling with the double whammy of lowest per capita income and land availability among Indian states, offers a compelling case to understanding the well-being of the citizens residing there. This is particularly interesting to study as Bihar is blessed with diversified resource endowment, good topography, and historically sound institutional and socioeconomic conditions; however, it has been steeped into a vicious cycle of low incomes, poverty, and poor human development (Mukherji and Mukherji 2015). As per the latest Census (2011), the urbanisation level in Bihar (11.3%) matches the all-India average in 1901, suggesting a century of stagnation! Further, this predominantly smallholder-agriculture state is highly vulnerable to hydro-meteorological natural disasters, with northern Bihar being flood-prone and southern Bihar being drought-prone (Economic Survey, 2015-16).
There are also imbalances across districts within the state. Of the 38 districts, per capita income of 33 districts falls below the state average, and the gap between the highest and lowest (Seohar) is almost five times1. World Bank (2005) report titled 'Bihar: Towards a Development Strategy' succinctly sums up the developmental challenge the state is facing: "...persistent poverty, complex social stratification, unsatisfactory infrastructure, and weak governance: problems that are well known, but not well understood."
Livelihood resilience index
At the dawn of the new millennium, there was growing dissatisfaction with dominant development theories of macro-readjustment policies and conventional top-down, centre-outward thinking (Ashley & Carney 1999, Krantz 2001), and a need for mapping at appropriate levels of spatial aggregation in the presence of geographically linked factors strongly affecting people´s livelihoods (Donohue and Biggs 2015). The combination of the Human Development Index (HDI) (United Nations Development Programme (UNDP), 1990) and 'sustainable livelihoods' concept, introduced in early 1990s (Chambers 1988) have changed the development narrative for the researchers and policymakers in recent decades (Alkire & Roche 2013).
We develop a livelihood resilience index (LRI) that captures capability, equity, and sustainability, which may help in understanding the processes that contribute to improving resilience, and prioritising strategies that can improve well-being in the region (Adger et al. 2009). The twin objectives of our analysis are to: (i) develop a livelihood resilience profile at the district level, and (ii) superimpose the profiles to identify districts in Bihar that are doubly exposed to external shocks of climate change and globalisation.
The LRI includes three major components: bio-physical resources, economic resources, and social resources. Each comprises several indicators or sub-components (Figure 1). Livelihood resilience is considered to be ideal when variability in bio-physical, economic, and social systems remains within their respective threshold limits and adaptive capabilities (Swaminathan 1991, Saleth 1993).
Figure 1. Components of livelihood resilience
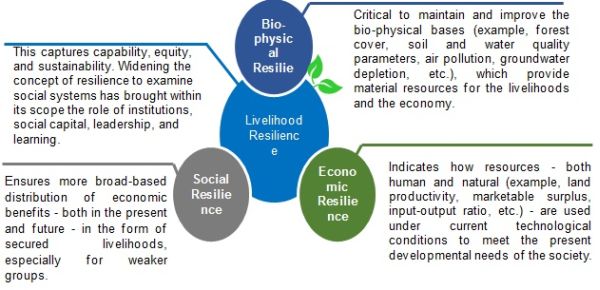
Construction of techniques of measurement of resilience is challenging due to its multifaceted nature, and the question it puts forth is: resilience of "what and to what" (Carpenter et al. 2001). There are several types of resilience that are distinguished in the literature, and these required different forms of measurement (Adger 2006). The resilience of bio-physical systems is influenced by factors like biodiversity, redundancies, response diversity2 , spatiality, and governance and management plans. The bio-physical resilience index (BRI) is largely constructed from stock and flow resource indicators to capture the dynamics of climate change and impacts on the bio-physical (re)production cycle by judiciously selecting static and dynamic indicators.
Further, there is a need to examine whether the resources in a given context are being overexploited to meet local and/or global economic demand, crossing the threshold limits of resilience. The economic resilience index (ERI) is constructed from production, productivity, and resource allocation indicators, for example, shifting attention to 'more crop per drop' and total factor productivity growth.
Social resilience can be increased through improvements in communications, risk awareness, and preparedness (Paton and Johnston 2006). The social resilience index (SRI) can be constructed from indicators of personal and social well-being such as health, nutrition, education, employment, income-consumption, housing, and energy.
The indicators were carefully chosen at the district level to capture the essence of livelihood resilience, and keeping data availability in mind. The LRI uses a balanced weighted average approach (Sullivan et al. 2002) where each sub-component contributes equally to the overall index even though each major component comprises different numbers of sub-components. The intention is to develop an assessment tool accessible to a diverse set of users in resource-poor settings.
The key resilience indicators are identified as follows (Table 1).
Table 1. Resilience indicators
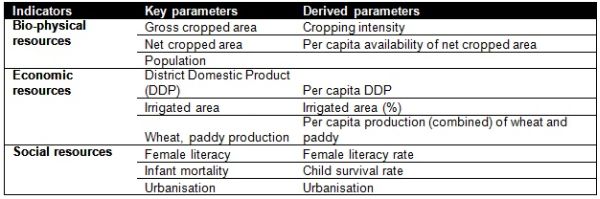
For instance, child survival rate is a leading indicator of the level of child health and overall development of countries and is observed to be positively associated with livelihood resilience (World Health Organization (WHO), 2005).
The LRI is scaled from 0 (least resilient) to 1 (most resilient).
Estimates for districts in Bihar
The data used for the analysis are district-level aggregates on key parameters. Sources include various economic surveys undertaken by the Directorate of Economics and Statistics, Government of Bihar, and the Census undertaken by the Government of India.
Figure 3 shows the LRI and its various components at the district level.
Figure 3. Major components of LRI for top and bottom six districts in Bihar
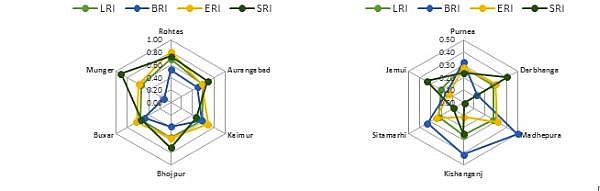
Top six districts Bottom six districts
Using the methodologies employed in the previous section, the LRI estimated at the district levels reveals an interesting picture. Rohtas, Aurangabad, Kaimur, Bhojpur, Buxar, and Munger are the top six LRI-ranked districts, while Purnea, Darbhanga, Madhepura, Kishanganj, Sitamarhi, and Jamui are the bottom six. Aurangabad, Kaimur, and Buxar are surprising entries in the top six; despite low per capita incomes, they performed quite well in terms of BRI and ERI. The low rank in terms of SRI for Kaimur and Buxar warrants a special focus on urbanisation and female literacy to improve social resilience in the districts. Further, the high per capita income districts, Munger and Bhojpur, have performed badly on BRI. This suggests that policy intervention is needed in these districts to restore bio-physical resources, which are over-exploited. The bottom six districts have no surprises, as they performed badly in terms of all the three resilience indicators, namely, BRI, SRI, and ERI. If we look at the other extreme, Seohar has the lowest per capita income but has an above-average LRI. It ranked the highest in BRI, suggesting that it did not exploit the bio-physical resources to full potential. Obviously, the district performs badly on ERI scale. This suggests that better access to resources does not necessarily mean districts have better resilience. The combination of bio-physical, economic, and social resources seems to be the determining factor in developing livelihood resilience for a district.
Policy conclusions
This column develops and provides a very crude measure to estimate the LRI at the district level in Bihar, one of the most backward states in India. The results, to an extent, show the diversity in livelihood resilience at the district level in Bihar. This pragmatic approach may be used to monitor resilience, programme resources for assistance, and/or evaluate potential programmes.
The next step is to operationalise the model with a rich set of temporal (across time) and spatial (space-related) data and then test it at a more granular level. This necessitates additional deliberations on resilience metrics. Participatory identification of resilient livelihoods may be helpful in formulating and executing different programmes to reduce vulnerability. This may assist in firmly re-establishing existing livelihood and in promoting a diversified portfolio of activities. Such an application should provide plausible measurements for assessing what makes some communities or places more resilient in the face of exogenous (external) shocks than others. This might allow a comparison of community resilience over time and across places using the same set of measures. Further, it should provide guidance for implementing more sustainable practices that empower local communities to take their risks seriously, and at the same time provide guidance on the structural, economic, social, and environmental policy changes needed to enhance their own resilience.
Notes:
- Patna, identified as outlier, had been dropped from the analysis.
- Response diversity entails the diversity of responses to environmental change among living beings that contribute to the same ecosystem function.
Further Reading
- Adger, W Neil (2000), "Social and Ecological Resilience: Are They Related?", Progress in Human Geography, 24(3):347–364. Available here.
- Adger, W Neil (2006), "Vulnerability", Global Environmental Change, 16:268–281. Available here.
- Ahluwalia, Montek Singh (2000), "Economic Performance of States in Post-Reforms Period", Economic and Political Weekly, 35(19):1637-48.
- Alkire, S, A Conconi and JM Roche (2013), 'Multidimensional Poverty Index 2013: Brief Methodological Note and Results', Oxford Poverty & Human Development Initiative (OPHI), Oxford Department of International Development.
- Ashley, C and D Carney (1999), 'Sustainable livelihoods: Lessons from Early Experience', Department for International Development (DfID), London.
- Barro, Robert J and Xavier Sala-i-Martin (1991), "Convergence across States and Regions", Brookings Papers on Economic Activity, 1:107–182.
- Baumgartner, R and R Hogger (eds.) (2004), In Search of Sustainable Livelihood Systems: Managing Resources and Change, Sage, New Delhi, and Thousand Oaks, London.
- Bhattacharya, BB and S Sakthivel (2004), "Forecasting Regional Growth and Disparity in India: Comparison of Pre and Post Reform Decades", Economic and Political Weekly, 39(10):1071-77.
- Carpenter, Steve, Brian Walker, J Marty Anderies, Nick Abel (2001), "From Metaphor to Measurement: Resilience of What to What?", Ecosystems, 4(8):765–781. Available here.
- Chambers, R (1988), 'Sustainable Livelihoods, Environment and Development: Putting Poor Rural People First', IDS (Institute of Development Studies) Discussion Paper 240, Brighton. Available here.
- Chambers, R and GR Conway (1992), 'Sustainable rural livelihoods: practical concepts for the 21st century', Discussion Paper 296, Institute of Development Studies, Brighton, UK.
- Government of Bihar (2015), 'Economic Survey 2014-15', Finance Department.
- Government of India (2013), 'Economic Survey 2012-13', New Delhi.
- Government of India (1955), 'Report of the State Reorganisation Commission', New Delhi.
- Krantz, L (2001), 'The Sustainable Livelihood Approach to Poverty Reduction: An Introduction', Sida (Swedish international Development Cooperation Agency), Division for Policy and Socio-Economic Analysis, Stockholm.
- Mukherji, A and A Mukherji (2015), 'Part II: Bihar', in A Panagariya and MG Rao (eds.), The Making of Miracles in Indian States: Andhra Pradesh, Bihar, and Gujarat, Oxford University Press.
- PIB (2014), 'State-wise Per Capita Income and Gross Domestic Product at current prices', Press Information Bureau.
- Saleth, Rathinasamy Maria (1993), "Agricultural Sustainability Status of the Agro-climatic Sub-zones of India: Empirical Illustration of an Indexing Approach", Indian Journal of Agricultural Economics, 48(3):543-50.
- Scoones, Ian (2009), "Livelihoods perspectives and rural development", Journal of Peasant Studies, 36(1).
- Sullivan, C, JR Meigh and TS Fediw (2002), 'Derivation and Testing of the Water Poverty Index Phase 1', Final Report, Department for International Development (DFID), UK. Available here.
- Swaminathan, MS (1991), "Greening the Mind", Indian Journal of Social Work, 52(3):401-7.
- Twigg, J (2007), 'Characteristics of a Disaster-resilient Community: A Guidance Note', DFID Disaster Risk Reduction Interagency Coordination Group. Available here.
- UNDP (1990), 'Human Development Report 1990', Oxford University Press, Oxford and New York.
- WHO (2005), 'Immunization Coverage Cluster Survey - Reference Manual', Department of Immunization, Vaccines and Biologicals, WHO, Geneva, Switzerland.
Comments will be held for moderation. Your contact information will not be made public.