

 10 February, 2021


Union budget 2021-22 has proposed a sharp 34.5% hike in capital expenditure, which is expected to boost the capital goods sector. While the sector has grown since liberalisation, its share in the global export market is under 1%, and there is heavy dependence on imports. Analysing trade data for the sector from 2008-09–2018-19, this article suggests that India has not been able to fully leverage free trade agreements due to non-tariff barriers and low competitiveness.
The capital goods industry is considered the core of the manufacturing sector, and provides critical inputs like machinery and equipment to a broad set of user-industries. A dynamic capital goods sector reflects domestic technological and innovation capabilities (Baark 1991, Rosenberg 1963). The 'National Capital Goods Policy 2016' defines capital goods as "any machinery, equipment, and accessories required, either directly or indirectly, for manufacture or production of goods or rendering services, including those required for replacement, modernisation, technological upgradation and expansion of manufacturing facilities". India's capital goods industry comprises 10 major subsectors. The largest subsector in terms of share in total capital goods production is heavy electrical and power equipment (60%) followed by earthmoving and mining machinery (9.4%), process plant equipment (7.3%), printing and packaging machinery (6.2%), dies and moulds (5.6%), food processing machinery (4.9%), textile machinery (2.5%), machine tools (2.2%), plastic processing machinery (1.4%), and metallurgical machinery (0.6%).
India's capital goods sector has grown in size since liberalisation in the 1990s. In terms of production, the sector contributes around 12% of India's manufacturing gross value added and 1.5% of India's GDP (gross domestic product) (Department of Heavy Industry, 2020). However, the sector's share in the global export market is less than 1% (Department of Heavy Industry 2016), and there is heavy dependence on imports to fill the huge demand-supply gap. Hence, a widening trade deficit is a major concern of the sector. The domestic production of capital goods in 2018-19 was US$13.6 billion, while the domestic market size was US$43.2 billion. India's modest export performance indicates that domestic producers are unable to tap the global export market demand effectively. The 'National Capital Goods Policy 2016' aims to increase the export of India's capital goods sector at least to 40% of the total production. In this context, we study whether India can leverage trade agreements to boost its capital goods' exports (Pal and Swathysree 2020).
Evaluating performance of India's capital goods in global trade
We carry out a 10-year (2008-09 to 2018-19) trend analysis of India's capital goods exports, imports, and trade balance using CMIE (Centre for Monitoring the Indian Economy) Tradex data.1 We group the capital goods’ exports and imports into three categories: (a) products exhibiting a rising trend, (b) products showing a falling trend, and (c) products with a stagnant trend. This exercise helps us to identify products where India has export growth potential and products in which import dependence is rising.
Gross exports of all capital goods subsectors show a positive trend during the study period. The leading exporter subsectors are heavy electrical and power equipment, earthmoving and mining machinery, and process plant equipment – together accounting for 85% of India's total capital goods exports. Gross imports of all subsectors, except metallurgical machinery, have shown an increasing trend during this period, suggestive of rising domestic demand. Heavy electrical equipment accounts for 40% of India's gross imports of capital goods, followed by earthmoving and mining machinery (21%), and machine tools (8%).
Although both exports and imports show a rising trend, the volume of exports is low as compared to imports, especially in trade with China. Subsequently, we classify capital goods into two broad groups: (a) products with a positive trade balance, and (b) products with a negative trade balance. We further segregate these categories based on the trend exhibited by the trade balance: (a) products with an increasing trend, and (b) products with a decreasing trend. We see that the trade deficit in subsectors like printing and packaging machinery, textile machinery, dies and moulds, machine tools, and plastic processing machinery, registered an upward trend during this 10-year period.
Trade agreements and India's capital goods sector
The world is witnessing a proliferation of bilateral and regional preferential/free trade agreements. These trade agreements enable trade integration and co-operation among signatories by eliminating trade barriers by lowering tariffs, streamlining regulations, and simplifying export and import procedures. At present, India has trade agreements with 48 nations, and several other trade agreements are under negotiation. India’s Foreign Trade Policy2 (2015-2020) states that India should leverage these trade agreements to expand the export markets.
Given this context, we examine India's capital goods trade with free trade agreement (FTA) partners (countries with whom India has trade agreements), the rest of the world, and China. The rest of the world – hereafter non-FTA partners – includes all other countries with whom India has trade relations but no existing FTAs (Most-favoured nation (MFN)3 partners minus China). We take a three-year (2017-18 to 2019-20) average value of exports and imports for this analysis, using CMIE Tradex data. The non-FTA partners constitute the major export market of India's capital goods, with a share of 64%, followed by FTA partners (32%), and China (4%) (See Figure 1). The major sources of capital goods imports are non-FTA partners (48%), followed by China (28%) and FTA partners (24%).
Figure 1. Share of capital goods exports going to FTA partners, non-FTA partners, and China
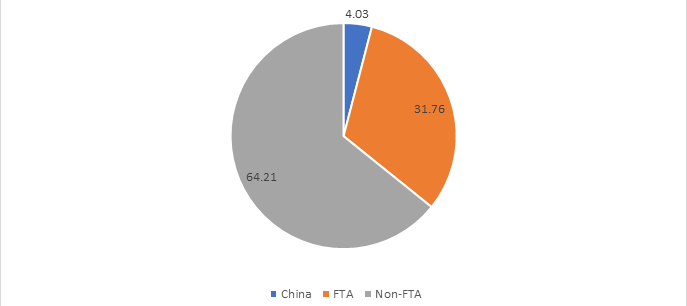
Source: CMIE Tradex data; Three-year (2017-18 to 2019-20) average value of exports
Using CMIE Tradex data at the two-digit and four-digit level harmonised system (HS)4 code classification, we identify the major export destinations and import sources of top 10 capital goods exports and imports, to understand the implications of trade agreements on India's capital goods sector. We find that the major export destinations of Indian capital goods are developed countries like the US, UK, Germany, and France, and Gulf nations such as UAE, Saudi Arabia, and Kuwait with whom India does not have FTAs currently.5 The major import sources of top 10 capital goods imports include China, South Korea, developed nations like the US, Germany, Japan, and Southeast Asian countries like Malaysia, Singapore, and Vietnam. India has existing trade agreements with Japan, South Korea, and the Southeast Asian nations. The compound annual growth rate of imports of capital goods by India from the ASEAN (Association of South East Asian Nations) bloc has increased by 14.4%, while India's exports to ASEAN has increased only by 10.6%, during 2008-09 to 2019-20.6 India runs massive trade deficits with China and ASEAN countries. China accounts for 58% of India's overall trade deficit in capital goods.7
It appears, from our study, that the current set of trade agreements are unlikely to bring many benefits for India's capital goods sector. Our analysis shows that the major export markets of Indian capital goods are countries with low applied tariff rates.8 Hence, it is unlikely that there is a high ‘preference margin’ (gap between applied MFN tariff and preferential tariff under FTAs) in these markets. The import tariff on capital goods is also low.9
On the other hand, Indian capital goods exports are likely to face stiff non-tariff measures like quality standards and TBTs (technical barriers to trade) in the major export markets. Many Indian standard-setting bodies are not recognised in these markets, and exporters have found it difficult to comply with multiple standard requirements. Non-tariff barriers are public policy measures that are unlikely to be relaxed under FTAs. As a matter of fact, in FTAs with WTO+ and WTO-X,10 non-tariff measures may be higher for FTA partners. These factors could have contributed to the apparent anomaly of India's low FTA utilisation in both exports and imports. The low share of FTA partners in capital goods exports compared to the countries with whom India does not have trade agreements shows that India has not leveraged the existing trade agreements to its full potential (Chanda, 2014). The FTA utilisation by Indian exporters and importers has been less than 3% of the available opportunity, whereas it is as high as 70-80% in developed countries (Deloitte, 2017).
Our interaction with capital goods exporters and other stakeholders suggests lack of awareness about FTAs, and complex paperwork as plausible reasons for low utilisation. The low FTA utilisation rate warrants sector-specific, granular studies to understand the underlying reasons. It is worth highlighting that India can leverage trade agreements only when domestic production of capital goods is internationally competitive.
Concluding remarks
The modest/stagnant export performance, increasing dependence on imports, and sizeable trade deficit in capital goods indicate India's lack of competitiveness, especially at the higher end of the value chain.11 Some of the factors adversely affecting competitiveness include adverse movement of exchange rates, high cost of credit, inverted duty structure,12 and technological backwardness. In a few subsectors of capital goods, where Indian exporters are globally competitive in terms of technology and prices, exporters have found it challenging to penetrate some important foreign markets due to strict standards and lack of recognition of Indian standard-setting bodies. Negotiating Mutual Recognition Agreements with these countries and harmonising standards can help India's capital goods exports.
Moreover, it does not bode well for the capital goods sector that, even in the domestic market, it struggles to compete with imports of second-hand capital goods,13 which are technologically of much older vintage. While the government needs to address the factors that place domestic producers at a disadvantage and help promote exports, the capital goods sector also needs to invest and upgrade domestic technological and production capabilities to emerge as a globally competitive producer and exporter of capital goods. The government should facilitate the efforts of domestic capital goods industry to improve technological depth through adequate investments and incentives.
I4I is now on Telegram. Please click here (@Ideas4India) to subscribe to our channel for quick updates on our content
Notes:
- CMIE Tradex database reports data from Directorate General of Commercial Intelligence and Statistics (DGCIS), Ministry of Commerce, Government of India.
- Foreign Trade Policy provides the framework of rules and procedures for exports, imports, and export promotion strategies. The Ministry of Commerce and Industry formulates Foreign Trade Policy for five years, but is reviewed annually.
- Under World Trade Organization (WTO) agreements, countries cannot discriminate between their trading partners – this includes granting some countries a special favour such as a lower customs duty rate for one of their products. Any such action would also have to be extended to all other WTO members. This principle is known as most-favoured-nation (MFN) treatment.
- The Harmonised System is an international nomenclature for the classification of products. It allows participating countries to classify traded goods on a common basis for customs purposes.
- Negotiation for an FTA with European Union is underway.
- Based on authors’ calculation using CMIE Tradex data.
- Overall trade deficit here refers to the three-year (2017-18 to 2019-20) trade deficit in capital goods.
- WTO requires countries to commit a ceiling tariff rate for every product. This is called the ‘Bound Tariff Rate’. However, under the WTO regulations, countries are allowed to charge any tariff rate lower than or equal to the ‘Bound Rate’ as long as the same tariff rate is charged for all WTO Members for a particular product. The tariff rate that countries actually charge is called the ‘Applied Tariff Rate’. For example, for country A, Bound Tariff Rate for steel can be 50%, but it actually charges 40%. Here, the applied tariff for steel for country A will be 40%. As per the World Tariff Profiles 2020, the duty faced by Indian non-agricultural products in developed markets like USA is 2.9% and EU is 4.2% whereas in ASEAN nations like Vietnam is 5.1% and Philippines is 4.5%.
- The tariffs on capital goods and equipment has been reduced to nil or 5% under the ‘Make in India’ programme.
- WTO+ includes policy areas already covered by the WTO Agreement but liberalisation is greater under the concerned FTA (for example, trade in industrial and agricultural goods, state trading rules, Technical Barriers to Trade etc.); WTO-X includes new areas beyond the WTOAgreement(for example, labour laws, environmental laws, human rights, aspects of Intellectual Property Rights not covered by WTO, etc.).
- In another study (Pal and Swathysree, in press), we find that for the broader ‘engineering goods’ sector (of which the ‘capital goods’ sector is a subset) India is not competitive in products with large global market, and India’s presence in global markets is more pronounced in resource-intensive, low value-add goods with small market size.
- Inverted duty structure refers to the scenario where the import duty on finished goods is lower than that of inputs used in the finished goods’ production. The existence of inverted duty structure leaves domestic manufacturers of finished goods uncompetitive.
- The ‘National Capital Goods Policy2016’ estimates the import of second-hand capital goods to be 15-20% of total production of capital goods.
Further Reading
- Baark, Erik (1991), "The accumulation of technology: Capital goods production in developing countries revisited", World Development, 19(7): 903–914.
- Chanda, R (2014), 'Impact Analysis of India's Free Trade Agreements', 2016 Economic Survey of India, Department of Economic Affairs, Ministry of Finance, Government of India.
- Deloitte. (2017), 'FTA utilisation – An opportunity in waiting for Indian industry!', India.
- Department of Heavy Industry (2020), 'Annual Report 2019-20', Ministry of Heavy Industries and Public Enterprises, Government of India.
- Pal, P and SS Swathysree (in press), 'Looking at India's Engineering Exports: Stuck in the middle of the Value Chain', in S Mani and CG Iyer (eds.), India's economy and society, lateral explorations.
- Pal, P and SS Swathysree (2020), 'Leveraging Trade Agreements to Boost Export from Indian Capital Goods Sector', Indian Institute of Management Calcutta Working Paper Series No. 853.
- Rosenberg, Nathan (1963), "Capital Goods, Technology, and Economic Growth", Oxford Economic Papers, 15(3): 217–227.
- World Trade Organization (2020), World Tariff Profiles, International Trade Centre and United Nations Conference on Trade and Development 2020.

Comments will be held for moderation. Your contact information will not be made public.