

 16 March, 2022


The Omicron variant resulted in a third major wave of Covid-19 in India, with the number of cases exceeding those in the second wave, albeit causing less severe illness on average. In this post, Kundu and Gisselquist draw on several nationally representative data sources to illuminate key Covid-19 patterns and trends in the country pre-Omicron – capturing the differential impacts across regions, and discuss how the pandemic response can be improved.
In India, the world’s second-most populous country, the Omicron variant resulted in the country’s third major wave of Covid-19. Omicron was now responsible for more cases than the Delta variant during the country’s second wave of infections, although with comparatively milder symptoms on average. Still, we remain in the dark about many important aspects of the spread of the Virus – such as the patterns and trends of infection, which are crucial to understand why some regions might be more affected than others, and how pandemic response can be improved.
In a recent study1 (Kundu and Gisselquist 2020), we draw on a handful of standard sources – District Level Household Survey (DLHS-4; 2012-13), 6th Economic Census of India (2013-14), 2011 (Population) Census of India (PC), and covid19india.org2 – to present five key maps and diagrams that illuminate the key patterns and trends that India experienced pre-Omicron. These empirics can help us think through some of the key lessons from the Delta wave and how they might apply to the pandemic response and outcomes in India today.
Waves and lockdowns
The staggering scale of the second Covid-19 wave stands out in Figure 1 relative to the first wave, both in terms of recorded cases and deaths. At the height of the second wave in late-May 2021, there were nearly 30 cases per 100,000 people per day – according to standard data sources3.
Figure 1. Daily cases and deaths due to Covid-19, and government response (2020-21)
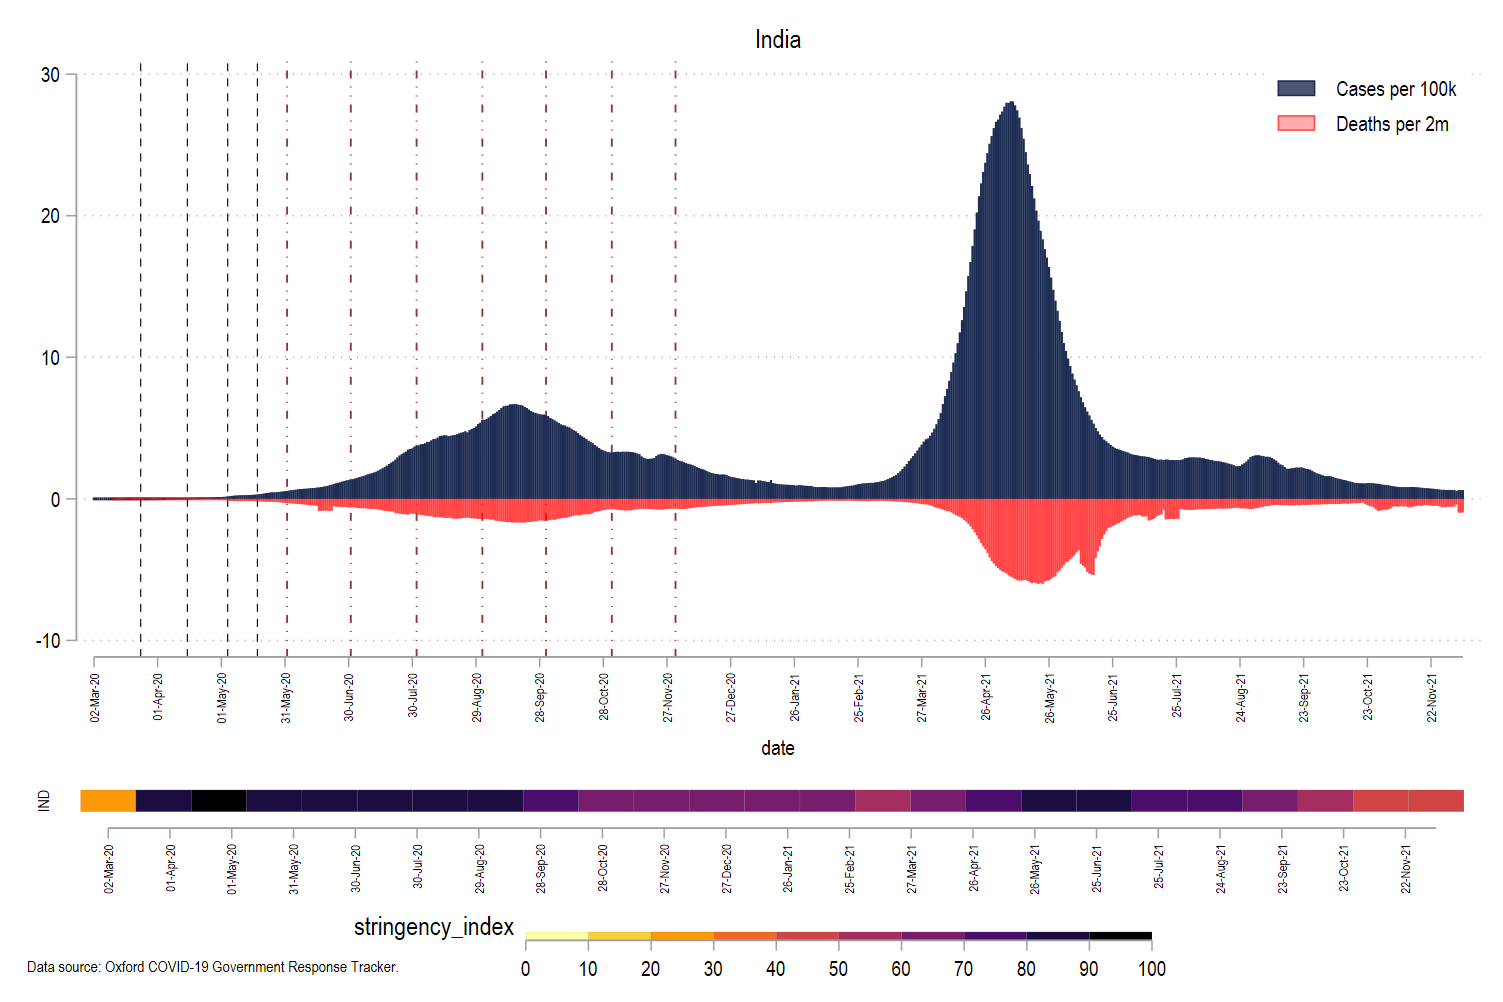
Source: Oxford COVID-19 Government Response Tracker.
What is clear from comparing the first and second waves is that the Delta variant was more infectious and more virulent than the original Virus, causing more confirmed cases and deaths. By most reports, Omicron is likely much more infectious than Delta, but far less virulent. How the numbers turn out post-Omicron will be worth paying attention to, especially for what it can tell us about efforts to curtail the pandemic, including the relative success of the large-scale vaccination campaign4.
Lockdowns are another key factor in understanding the scale of these waves. India imposed one of the world’s most draconian lockdowns, particularly in the period between 25 March and 30 May 2020. The stringency of India’s lockdown over time, as reported by the Oxford COVID-19 Government Response Tracker (OxCGRT) is included at the bottom of Figure 1. Some reporting suggests a clear link between the lockdown and India’s comparatively low early Covid-19 rates, but our read of the data suggests that more care should be taken in making such claims.
Variation in cases and deaths across states
There is a considerable amount of variation in pre-Omicron data on the impact of Covid-19 across Indian states. Looking at the official numbers, one point about this heterogeneity that stands out is that wealthier states average a higher recorded number of infections and deaths than poorer states. This is puzzling given the higher capacity the wealthier states have, to respond to crises such as the pandemic.
This calls for more investigation. One of the many factors that might be behind this simple relationship is that lack of capacity makes underreporting (and testing) a bigger problem in poorer Indian states.
Figure 2. Cases (left panel) and deaths (right panel) across Indian states (absolute numbers)
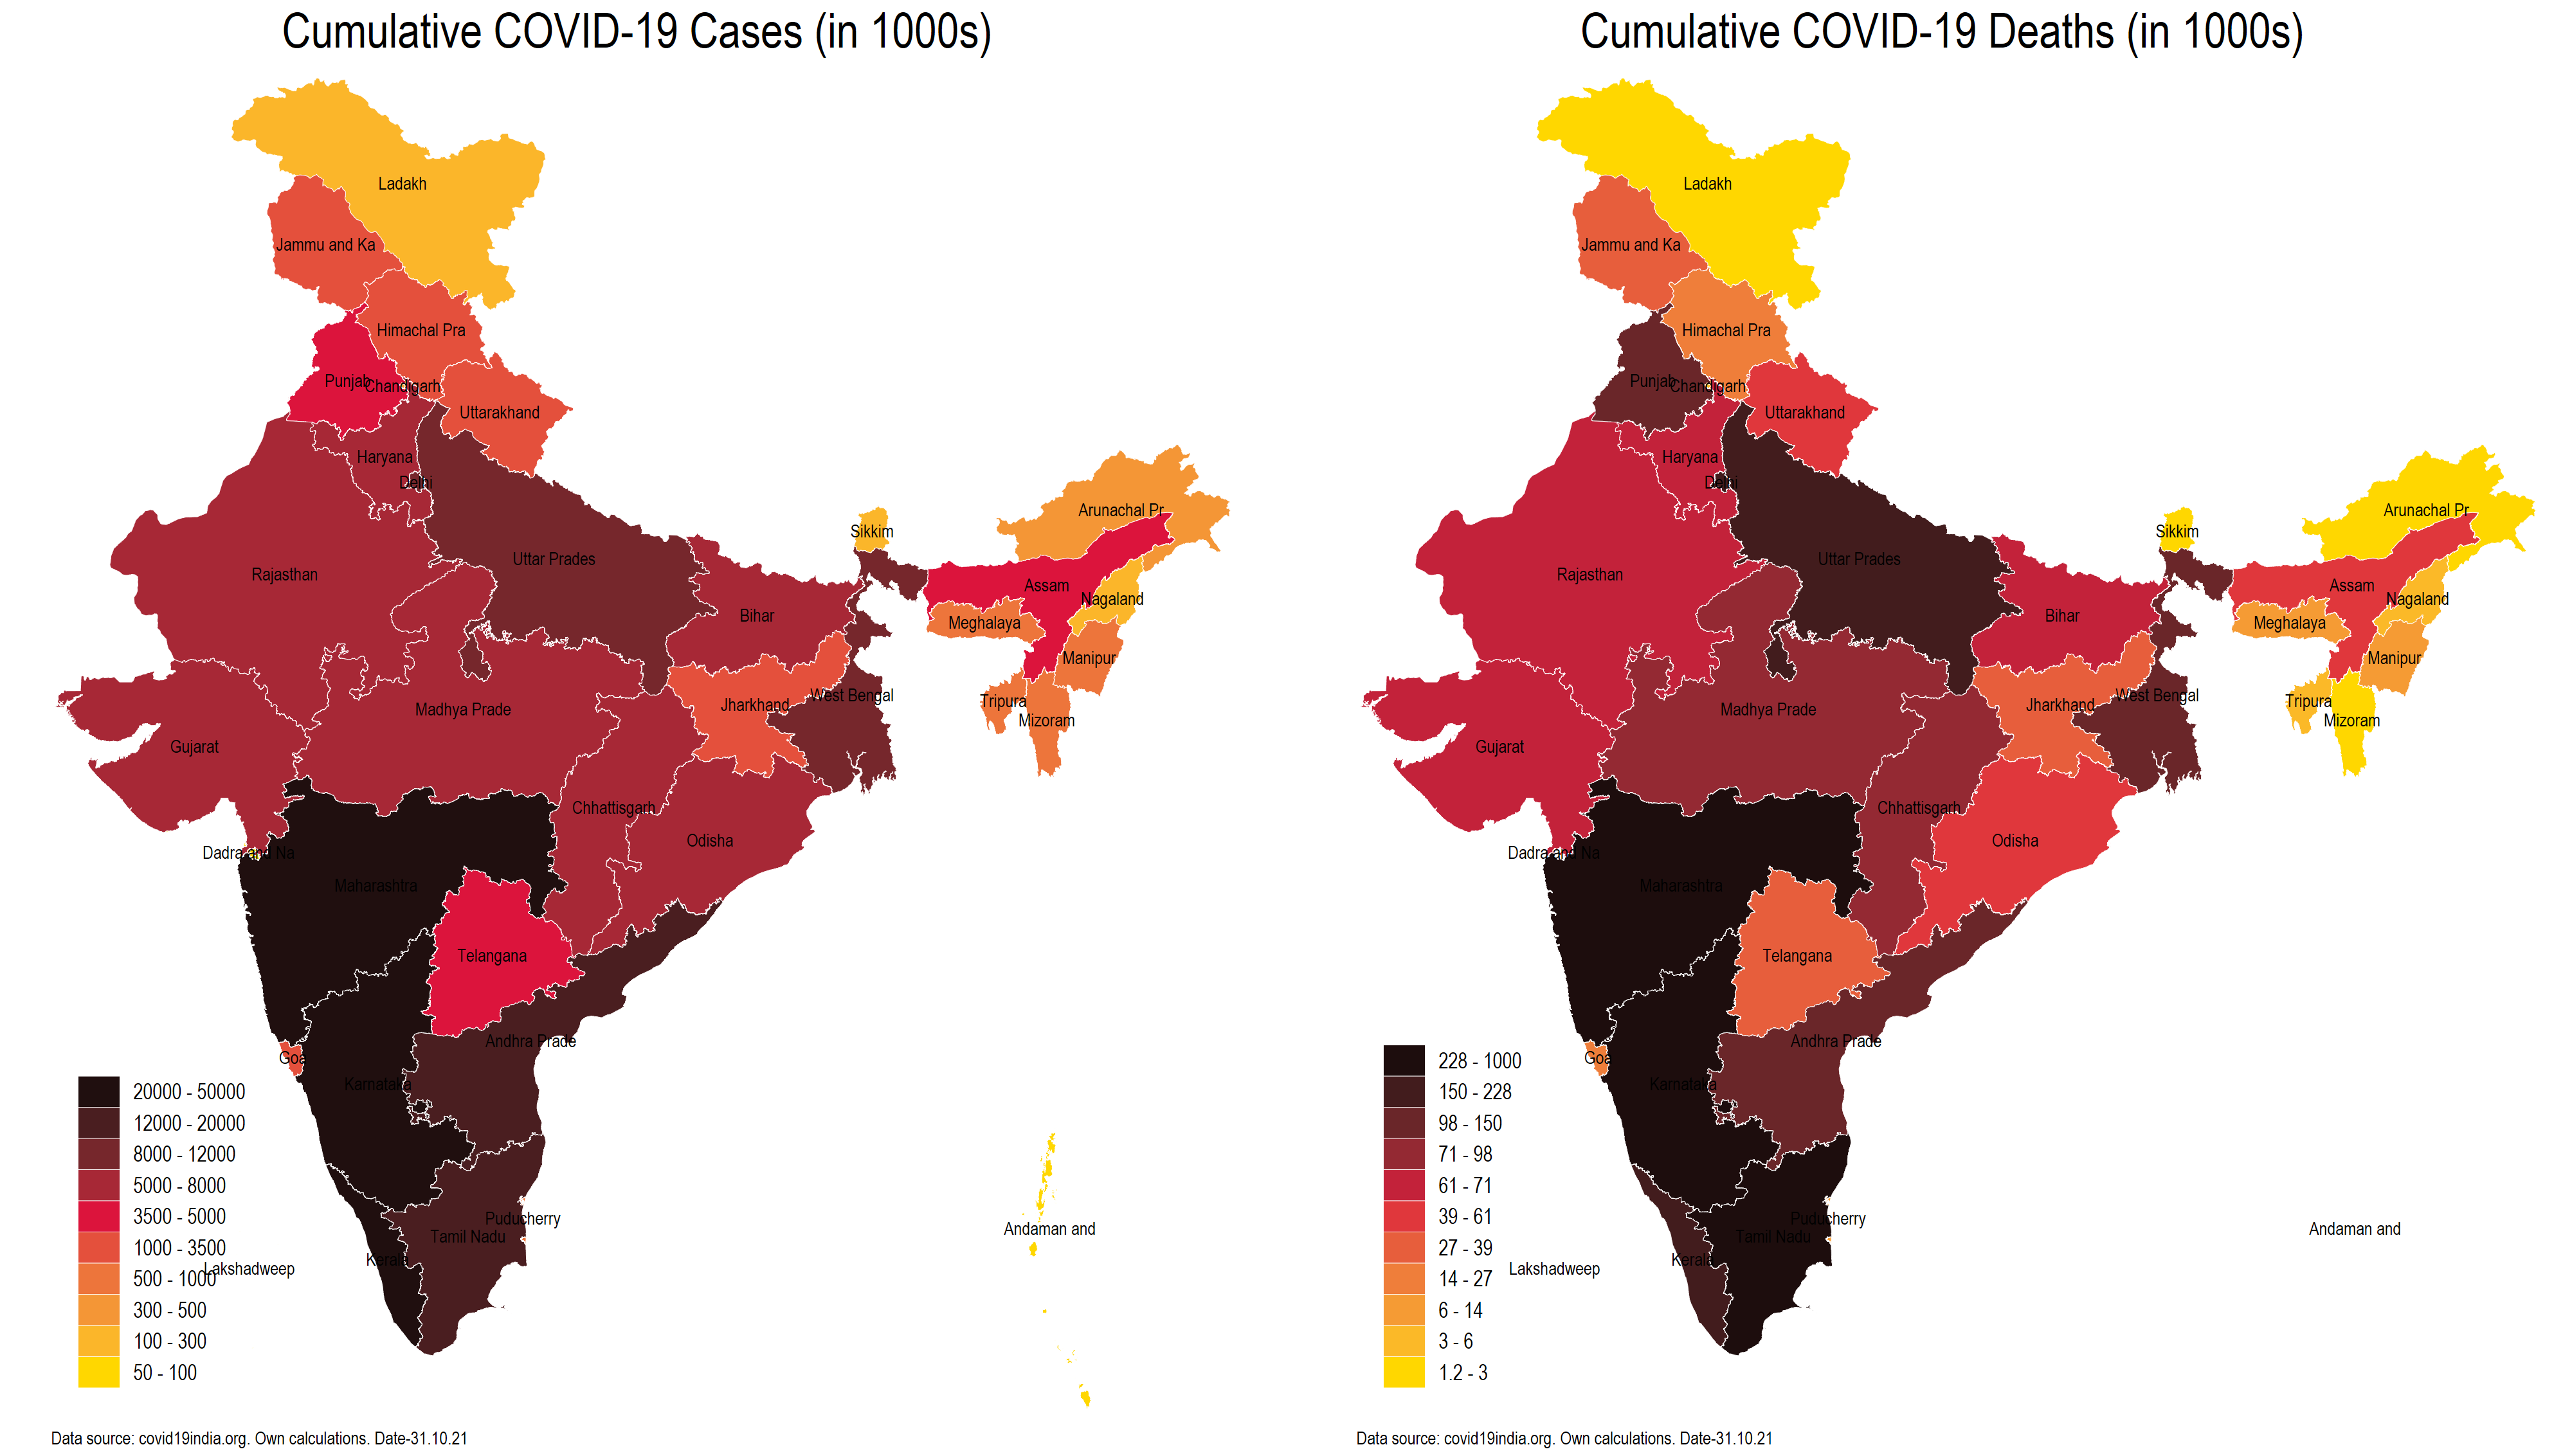
Source: Author estimates based on data from covid19india.org.
Figure 3. Cases (left panel) and deaths (right panel) across Indian states, proportionate to population
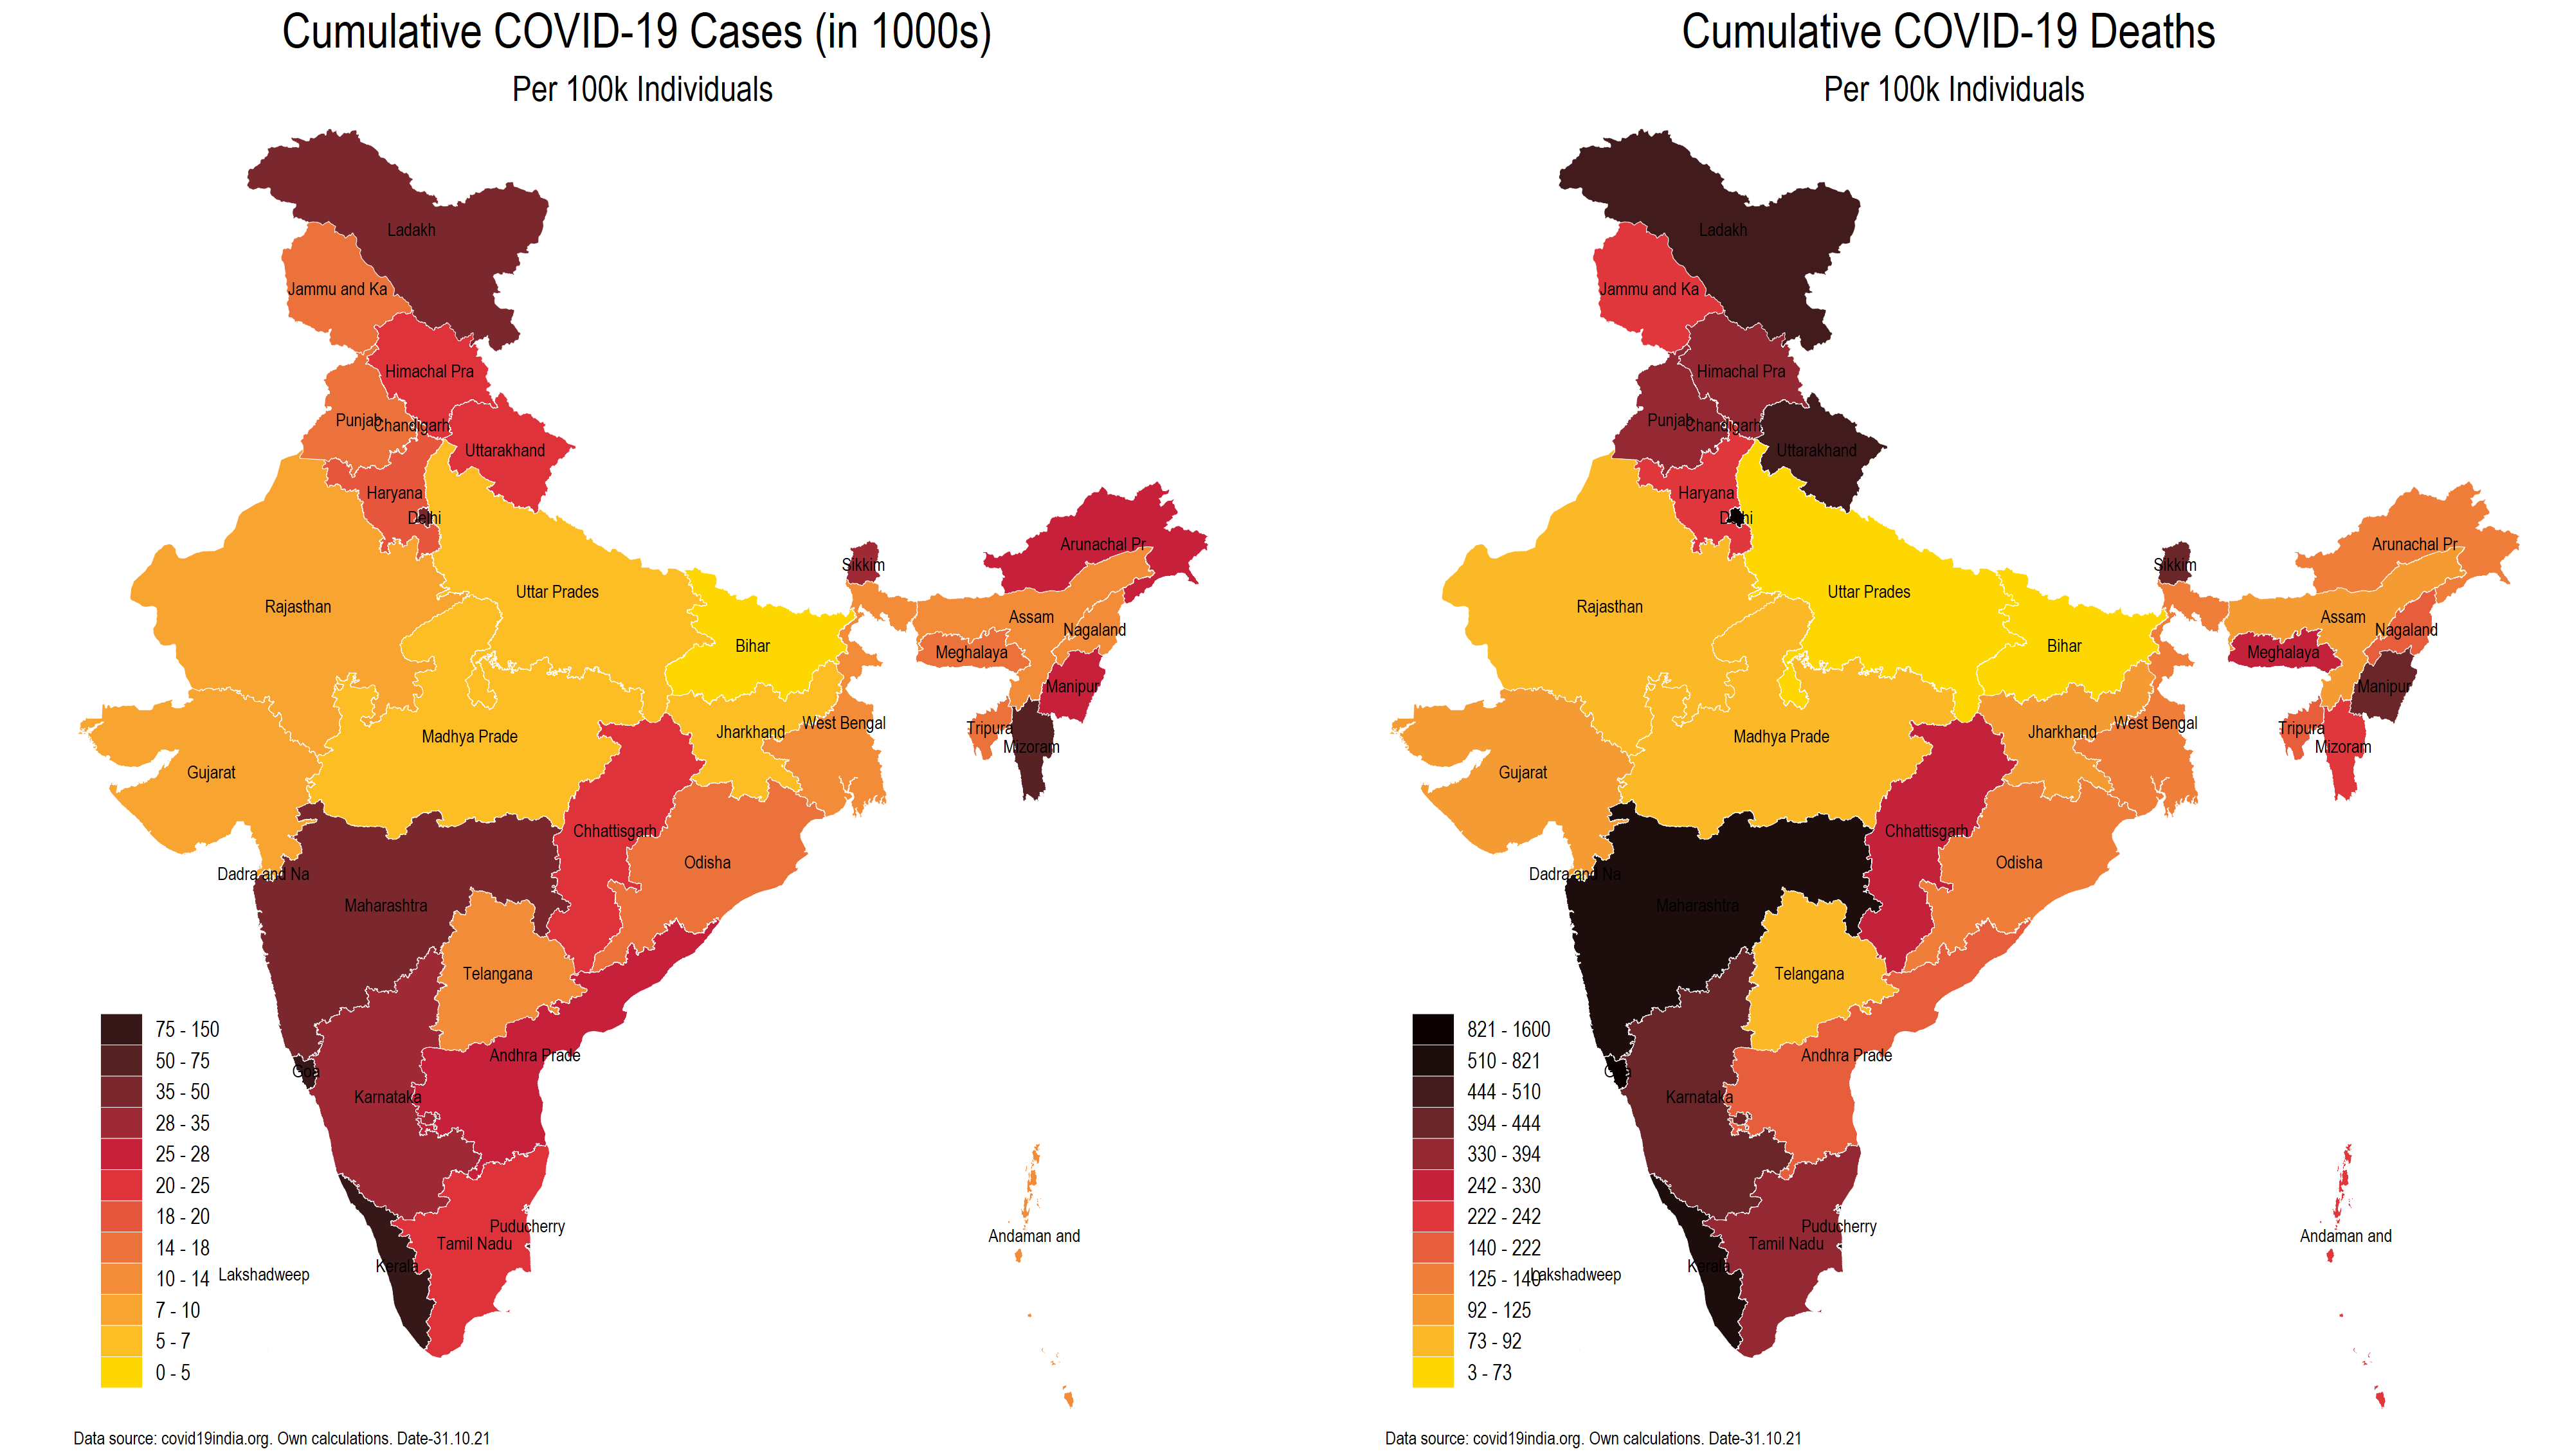
Source: Author estimates based on data from covid19india.org.
Excess deaths
Inaccurate data are a huge problem in monitoring and understanding the pandemic in India, and in the world more generally. One useful check on official statistics is excess mortality – measured as the difference between the reported number of deaths in a given week or month in 2020-2021 vis-à-vis the expected number of deaths for that period in the years preceding the Covid-19.
Although the raw number of excess mortality gives us a sense of scale, it is less comparable across states due to large population variation. In order to better compare across regions, here we report ‘P-scores’ which measure the difference between reported and projected deaths as a share of projected deaths.
For example, if we look at Figure 4, for the month of May 2021, Andhra Pradesh had a P-score of 400%, which means excess mortality was four times the projected death count for that month, in comparison to the baseline period (average of 2015-2019). In simple terms, excess death numbers like this point to significant underreporting of Covid-19 deaths in official statistics, and to variation in excess deaths across states.
Figure 4. Excess deaths in India, by state
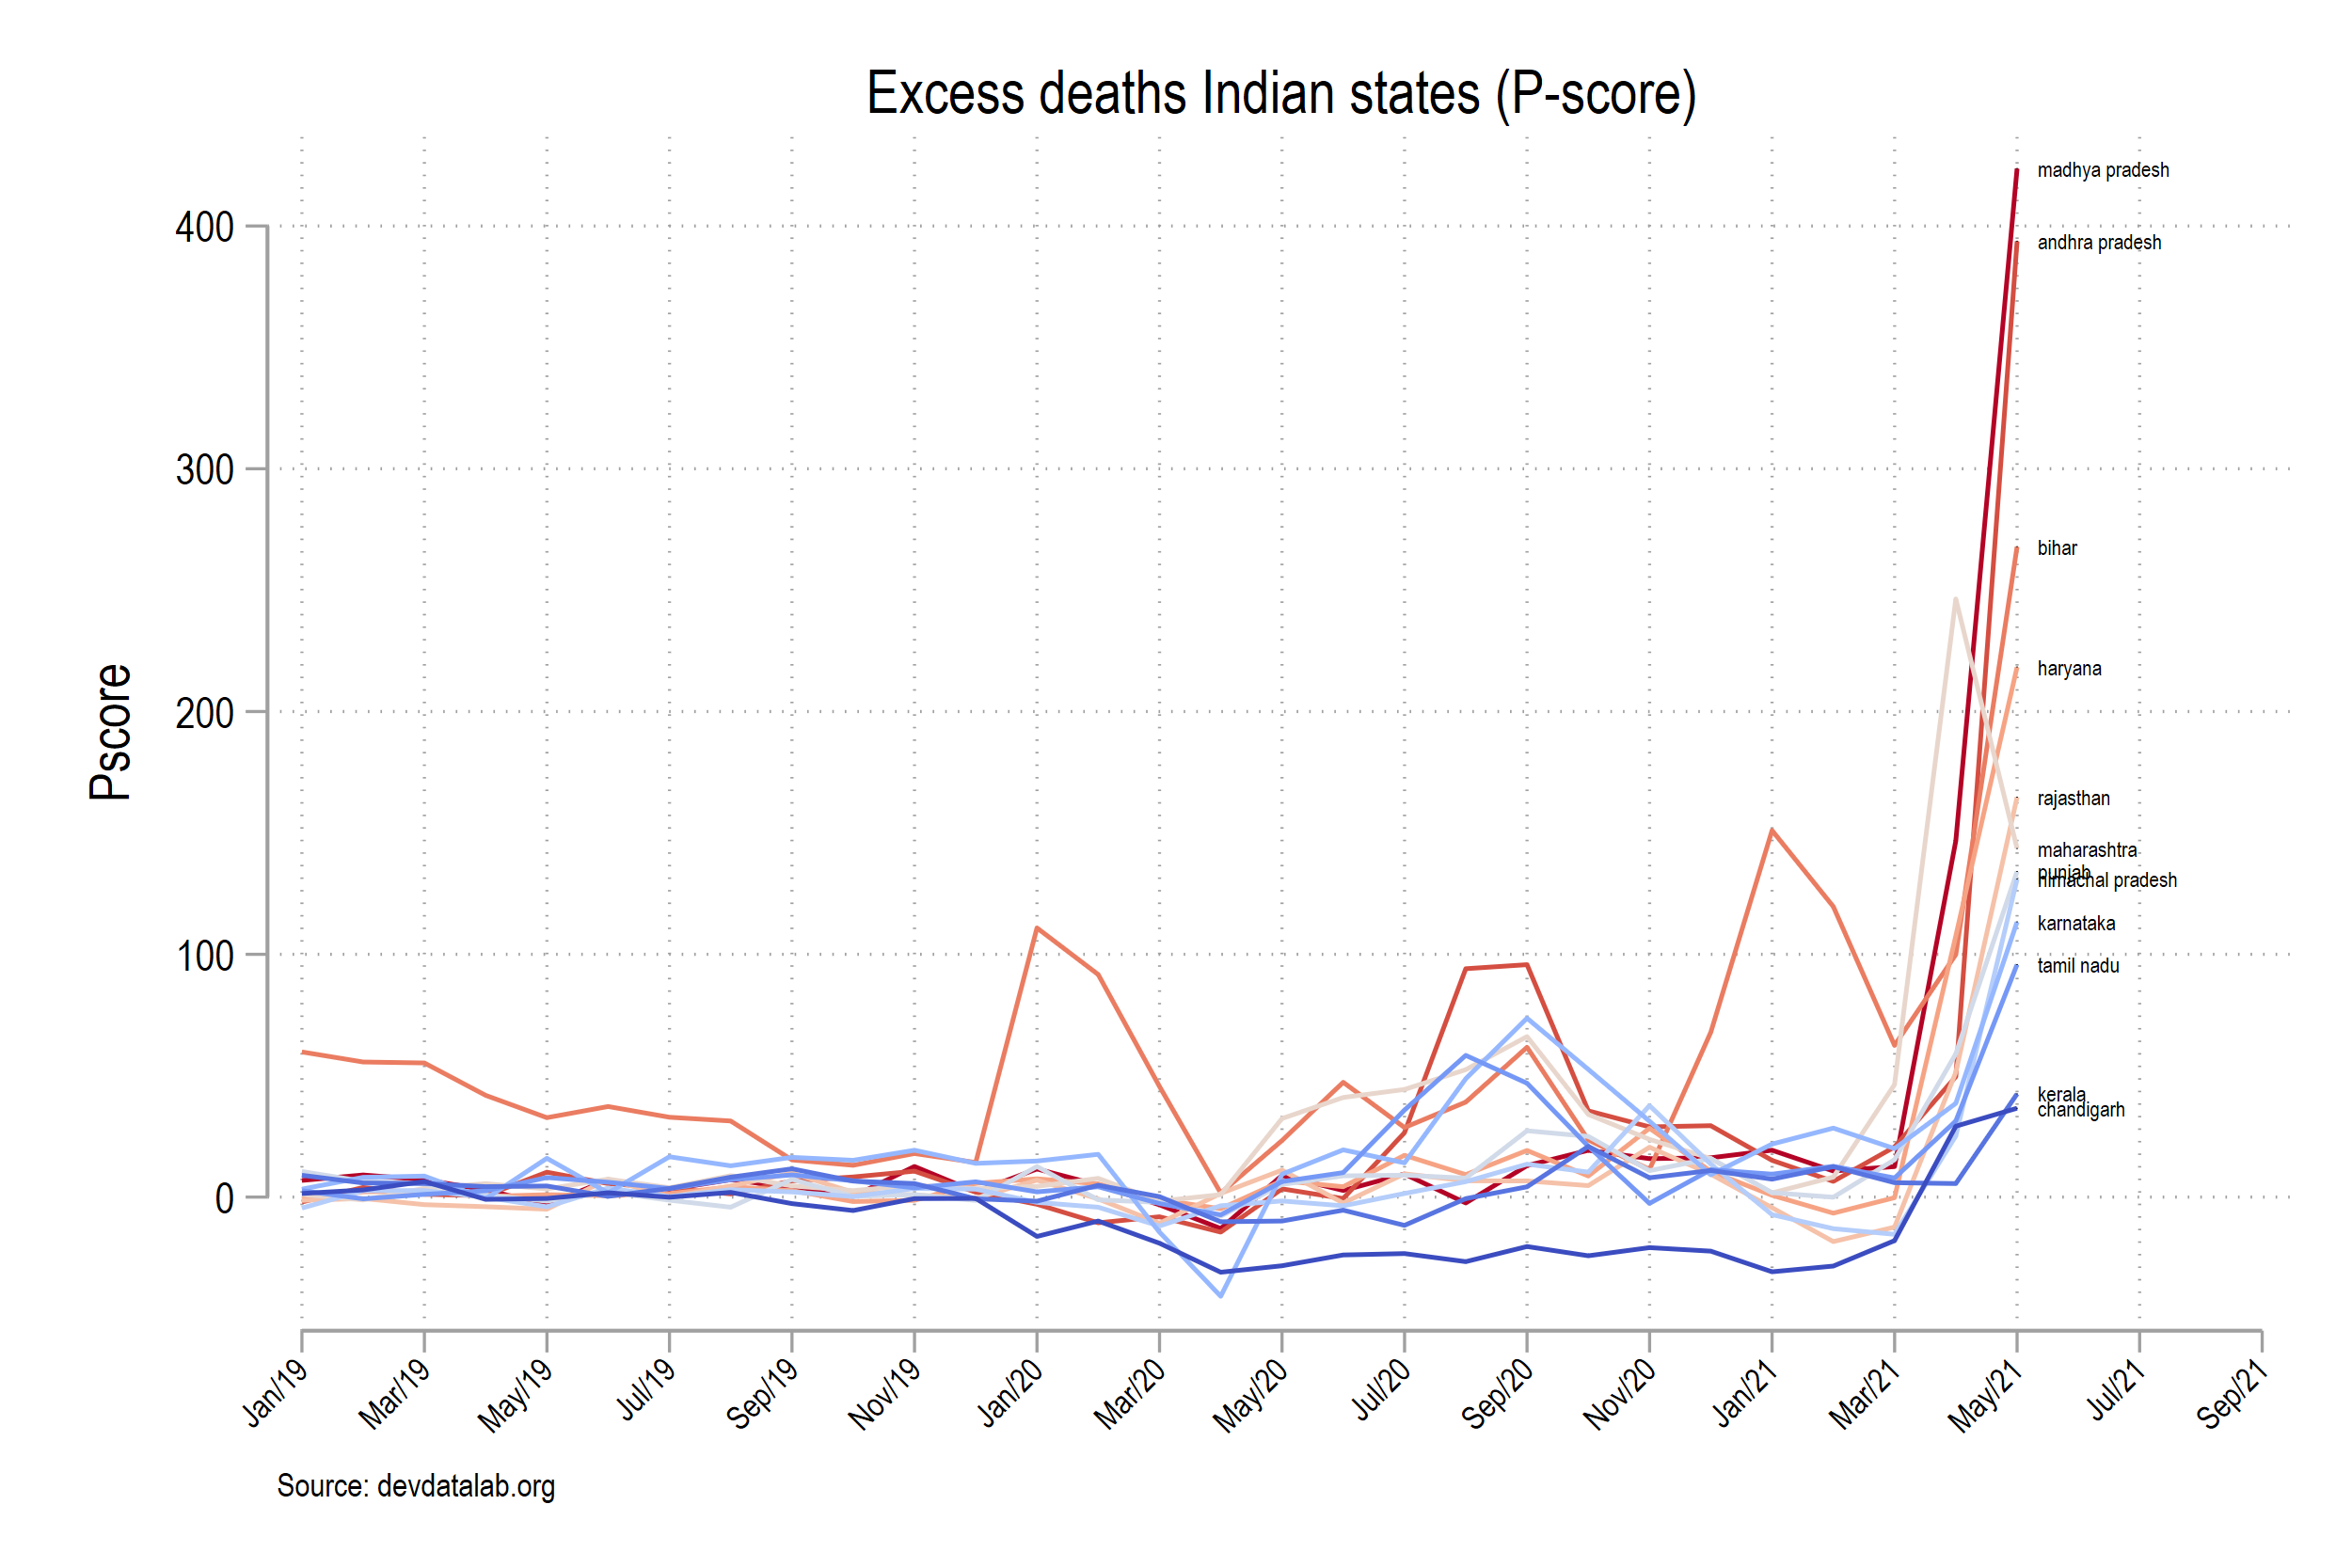
Source: devdatalab.org.
Note: The baseline period is an average of 2015-2019 data.
The scale and pace of vaccinations
India rolled out the world’s largest Covid-19 vaccination drive on 16 January 2021 with the aim to vaccinate around 300 million persons in ‘priority groups’ by August 2021. As Figure 5 shows, the vaccination drive was quite slow early on. In February 2021, reports indicated that at the pace of around 400,000 jabs a day, it would take India four years to complete vaccination of its priority groups. However, the pace subsequently picked up with the vast network of private hospitals across India administering doses from 1 March, right as the Delta wave began to worsen. As of mid-October 2021, according to the CoWIN dashboard, nearly 50% of the population had received a single vaccine dose and 20% had received both doses.
Figure 5. Covid-19 vaccination in India, absolute (left panel) and proportional to population (right panel)
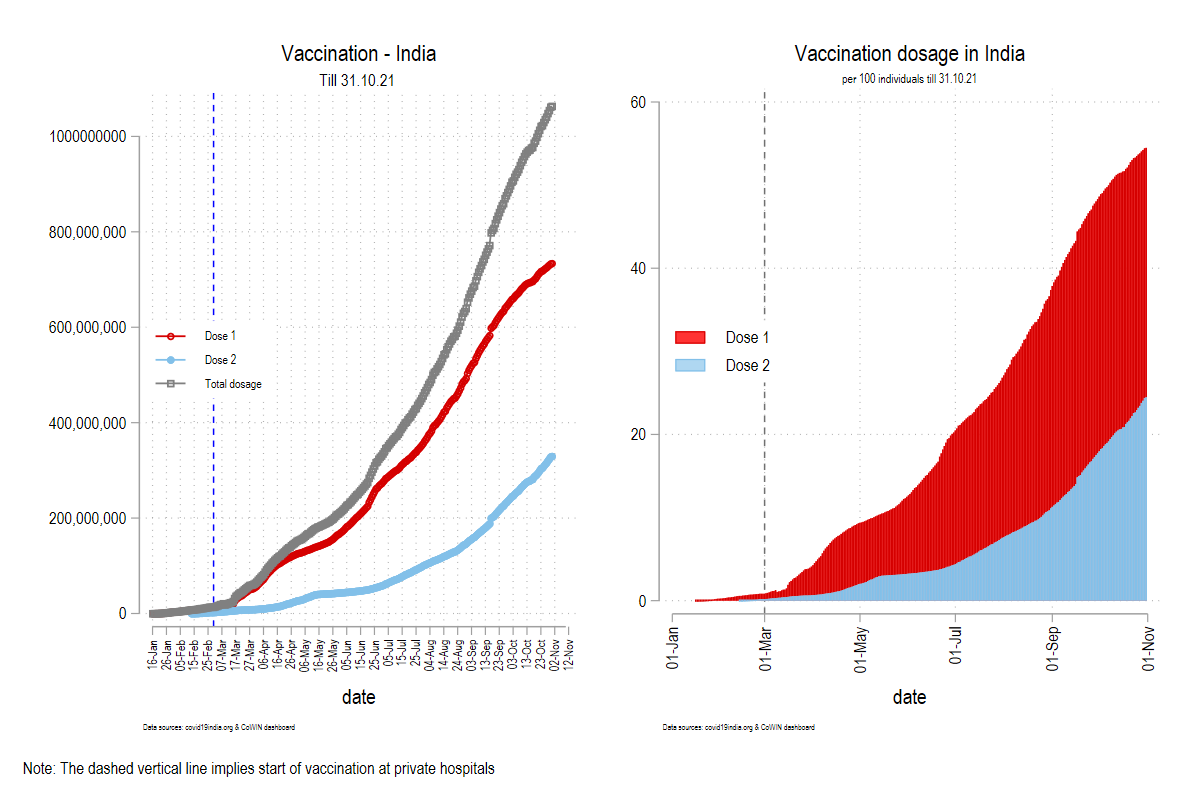
Note: The dashed vertical line implies the start of vaccinations at private hospitals.
Source: covid19india.org and CoWIN dashboard.
Vaccinations across states
Vaccination status across states varies quite a bit (Figure 5). Unsurprisingly, larger states such as Uttar Pradesh, Maharashtra, Madhya Pradesh, West Bengal, and Bihar have administered higher numbers of total doses, but the vaccination rates for these states in terms of their population are comparable to or lower than the national average.
Figure 6. Covid-19 vaccinations in India (till October 2021), by state, in absolute (left panel) and proportional (right panel) terms
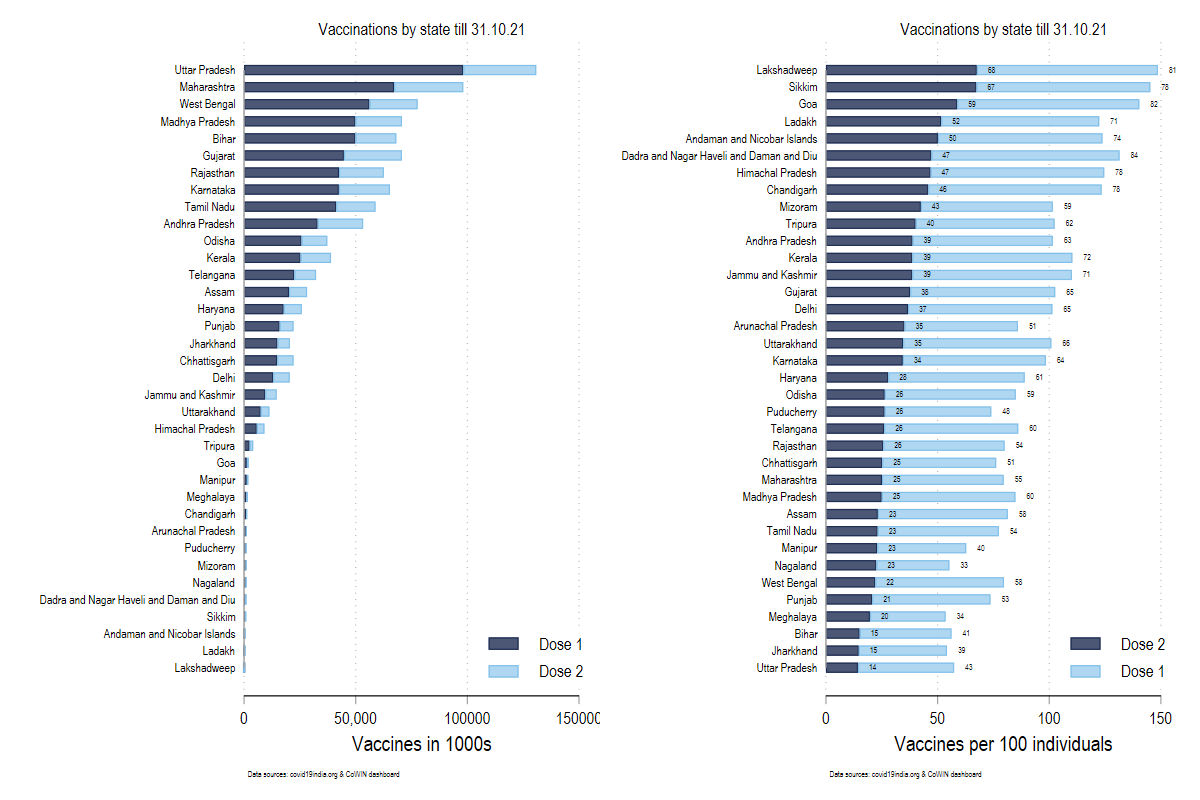
Source: covid19india.org; CoWIN dashboard.
Conclusion
It is clear that the data on Covid-19 in India – and in many other countries – are flawed. In 2021, India recorded the largest Covid-19 related death toll of any country in the world and the official numbers are likely to be underestimates. Triangulating across sources – for instance comparing official statistics on Covid-19 deaths with excess deaths – can help to build a better empirical understanding of the spread of the Virus. In ongoing work, we draw on statistics such as the above, together with in-depth case studies, to deepen knowledge about Covid-19 cases, deaths, and vaccinations. Working together with a group of research collaborators, our book manuscript in progress includes in-depth chapters on Bihar, Kerala, Maharashtra, Uttar Pradesh, and West Bengal, nested within analysis across all states. We aim to better understand variation in Covid-19’s impact across states and union territories, and specifically how sub-national state-level institutions and governments influenced pandemic response and impact.
I4I is on Telegram. Please click here (@Ideas4India) to subscribe to our channel for quick updates on our content
Notes:
- This study is part of ongoing research with the United Nations University World Institute for Development Economics Research.
- We access much of these data from the SHRUG COVID-19 platform.
- Other sources suggest still higher figures – we discuss this at a later point in the article.
- As per figures reported on 8 March 2022, India had logged 3,993 new Covid-19 infections, the lowest in 662 days. Virologist Dr T Jacob John said he is "fairly confident" that no fourth wave will occur in the country unless an unexpected variant that behaves differently comes up.
Further Reading
- Asher, S, T Lunt, R Matsuura and P Novosad (2020), ‘The Socioeconomic High-resolution Rural-Urban Geographic Dataset on India (SHRUG)’, World Bank Economic Review (Revise and Resubmit).
- Gisselquist, RM and A Kundu (2020), ‘Horizontal Inequality, Covid-19, And Lockdown Readiness: Evidence From India’, WIDER Working Paper 2020/156.
- Gisselquist, RM and A Vaccaro (2021), ‘Covid-19 And The State’, WIDER Working Paper 2021/80.
- National Commission on Population Ministry Of Health and Family Welfare (2020), ‘Population projections for India and States 2011-2036’, Technical report.
- Sumner, A, E Ortiz-Juarez and C Hoy (2020), ‘Precarity And The Pandemic: Covid-19 And Poverty Incidence, Intensity, And Severity In Developing Countries’, WIDER Working Paper 2020/77.

Comments will be held for moderation. Your contact information will not be made public.