

 29 September, 2020


Kerala, the state with the largest number of Covid-19 cases when India entered the lockdown on 25 March, had only 16 active cases on 20 May. However, the second wave of the pandemic in the state, coinciding with the ‘unlocking’ phase in the country, has led to a serious crisis. In this post, Benston John discusses what went wrong, and what the state needs to be mindful of when deciding on a new strategy to counter the pandemic.
The state of Kerala, where the first case of Covid-19 infection was registered in India, and also the state with the largest number of cases when the country entered the lockdown on 25 March, made a remarkable turnaround and had only 16 active cases on 20 May, 100 days after the first case was registered. Kerala received widespread appreciation for this. But the second wave of the pandemic in the state, coinciding with the ‘unlocking’ phase in the country, has proven to be a serious crisis. Daily fresh cases are now well over 2,000 on most days, and a very high share of these are ‘infections via contact’. So, what went wrong? I try to look into this question by considering the pandemic data during the various unlock phases which started with Unlock 1.0 on 1 June, followed by Unlock 2.0 on 1 July, and Unlock 3.0 on 1 August.
Unlock and Kerala
I will now consider how some of the key variables associated with the disease evolved with the unlock phases. The number of daily fresh cases is perhaps the most popular Covid statistic. Figure 1 gives this data for the three unlock phases.
Figure 1. Daily fresh cases between 1 June and 31 August in Kerala
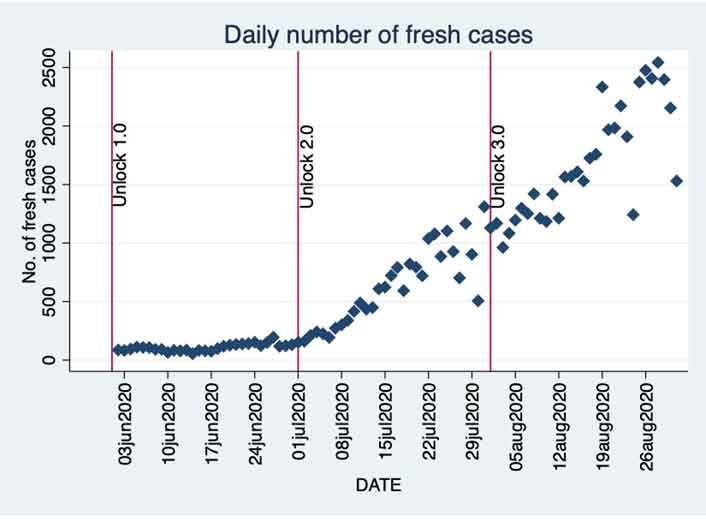
Unlock 1.0 did not see a rapid increase in the number of daily cases, and a modest rise began towards the end of the third week of June. Unlock 2.0 saw a much sharper increase from early July. Kerala breached the 1,000 mark in daily cases during Unlock 2.0, and the upward trend continued through the phase without any significant interruptions. Unlock 3.0 also saw a similar trend with the state breaching the 2,000 and 2,500 mark in daily fresh cases during this period. There is a reduction in the daily cases towards the end of August, but I will have more to say on this shortly.
Just looking at the daily total fresh cases is going to hide important details. We will now consider the share of infections via contact (contact infections, hereafter) among the total daily fresh cases. Kerala’s success in restricting the infections to only the primary cases and not allowing it to spread was amply clear in the first phase of the pandemic. The cases came from outside the state and the spread was limited to a great extent. How did the removal of restrictions affect this trend? Figure 2 gives the answer.
Figure 2. Share of contact infections in daily total fresh cases
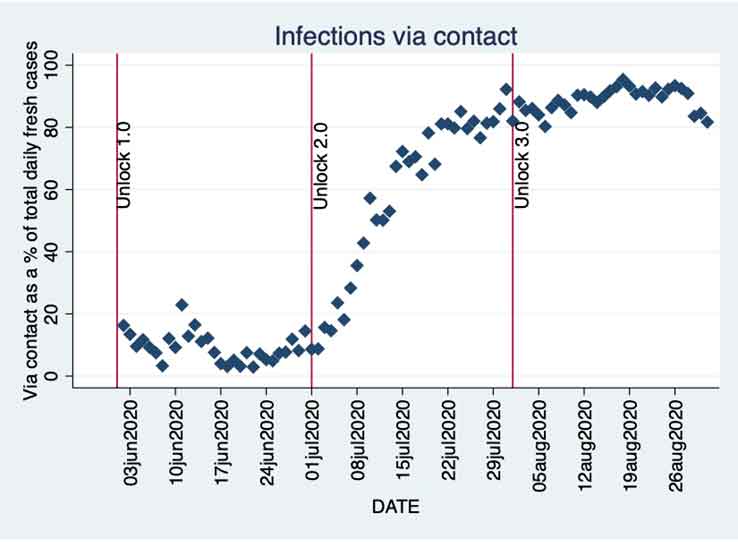
We see that while the increase in the share of contact infections starts around the same time as the increase in daily fresh cases, the former is much sharper especially after we enter Unlock 2.0. The share crosses 20% in the first week of July itself, and in just two weeks this share crosses 80%. Since then, it has remained above 80% and often over 90%. The rate at which this change happened is nothing short of alarming and shows us the true nature of the crisis that the state has been facing. Kerala’s ability to rein in the infections via controlling the spread from the primary infections has been seriously challenged.
How has Kerala been testing since Unlock 1.0? We will now look at this in some detail. Let us start with the number of tests conducted daily during this period. Figure 3 gives us this information.
Figure 3. Daily tests in Kerala since Unlock 1.0
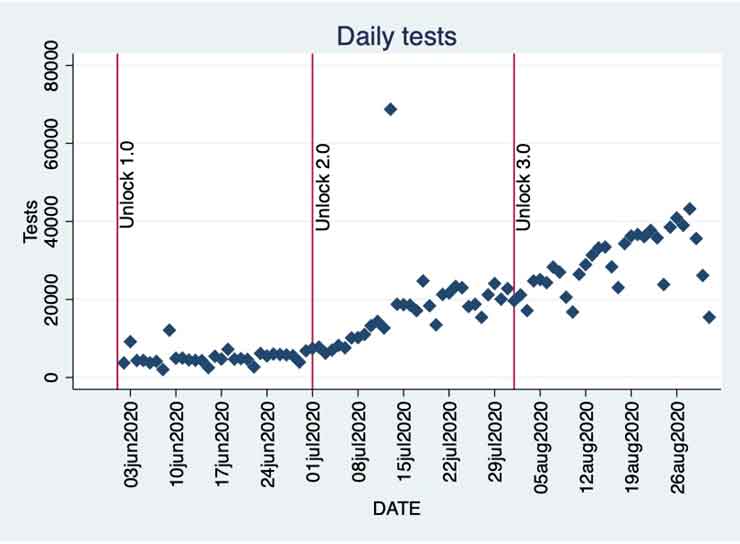
The number of tests conducted daily has certainly increased consistently during this period. But the real question is: are the number of tests conducted enough?
Test positivity rate, that is, the fraction of tests that come back positive, is a useful metric to use. I calculate this by dividing the number of fresh cases by the total number of daily tests. I use a seven-day moving average for both. Figure 4 shows this information. A report by Harvard Global Health Institute identifies test positivity rate as an important factor that distinguishes countries that have successfully managed the pandemic from countries that have not. The report shows how a low test positivity rate could be because of lockdown or stay-at-home orders, which would lower the incidence of the disease in a community, and hence would also lower the probability of someone getting infected. A low test positivity could also be the result of a volume of testing large and wide enough to bring in asymptomatic and mild cases as well as exposed contacts even if they are asymptomatic. But in both these cases, a low test positivity is a reflection of a high enough surveillance capacity and rapid case identification. This is essential to support other disease control measures like isolation. The target should be to not allow the test positivity rate to increase while keeping it as low as possible.
While Kerala’s test positivity rate has been better than the rates of many other Indian states during this period, it is a cause for concern that the positivity rate in Kerala has been consistently increasing. A look at Figure 3 and Figure 4 shows us clearly that the increase in the number of daily tests has failed to prevent the test positivity rate from going up. While it remained below 5% till the end of July, the upward trend is clearly visible. Unlock 3.0 has seen the positivity rate go up even further and breach the 6% mark. This worrying trend continues into September as well.
Figure 4. Test positivity rate in Kerala
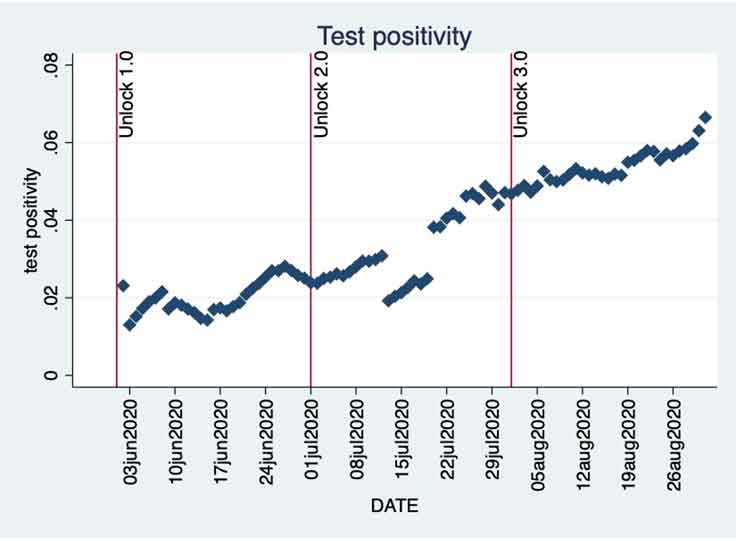
Now if we look at the last couple of days in August, where we had a falling number of daily fresh cases in Figure 1, Figures 3 and 4 show a different picture. The reduction in daily fresh cases is accompanied by an increase in test positivity rate, which in turn, is caused by a significant reduction in the number of tests.
The data confirms how Kerala did not increase the daily tests sufficiently and failed to keep the test positivity rate from increasing, especially in the initial stages where the positivity rates were going up from around 2%. While Kerala was well within the 5% target specified by the World Health Organization (WHO), the change in the qualitative nature of Kerala’s cases from before, where the share of contact cases in the total daily cases was increasing at a rapid rate, was an aspect that was perhaps ignored or the impact underestimated.
Discussion
As analysed in Jalan and Sen (2020), the initial conditions of the state presented Kerala with both advantages and disadvantages. The superior human development indicators, especially those related to public health, were always going to be beneficial. However, factors such as high population density, and the large number of Keralites working outside the state and wanting to come back as the pandemic worsened all around, were serious challenges, but the national lockdown helped keep many of these disadvantages in check. The strategies designed by the state administration could then take advantage of the beneficial initial conditions and effectively manage the pandemic.
Kerala used its experience of managing the Nipah Virus (NiV) outbreak in 2018 and the twin floods in 2018 and 2019, and quickly set up the necessary mechanisms. The state focussed on identifying the primary patients, tracing their within-state contacts, testing them, isolating and treating the infected, expanding the state health infrastructure, increasing the staff, and setting up social media channels for extensive information dissemination.
But the situation changed a lot with the unlocking. By early July, Kerala had 94,085 people – the highest in India – return to the state as part of the Vande Bharat Mission that started on 7 May. With economic activities resuming, the high population density of the state was expected to create an adverse impact. Kerala has a population density of 860 persons per square kilometre as per the 2011 Census, and this is more than twice India’s population density. Also, around 12.8% of Kerala’s population is above 60 years, and a large number suffer from comorbidities. Only 8% of India’s population is above 60 years.
It is clear that Kerala needs to come up with a new strategy. While the learning from the NiV outbreak was useful in the initial phase of the pandemic, as the state had some familiarity with contact tracing and isolation of suspected or infected individuals, this learning is not going to be of great help now with cases still going up, and also because of fundamental differences between the two diseases.
The NiV outbreak was limited to just two northern districts of the state: Kozhikode and Malappuram. It is also a disease with a very high fatality rate, documented to be well over 80%. In Kerala, there were 17 deaths out of a total of 19 people who were infected. The symptoms are very visible and helped keep track of the spread of the disease once it was detected. People realised the high risk associated with this disease and cooperated better. The health machinery could also concentrate resources and focus very well in the comparatively small number of affected areas.
With the risk of community transmission much higher and with the existence of a large number of asymptomatic cases and common flu-like symptoms, Covid-19 is proving to be a much bigger challenge. People may have felt more confident of handling it, especially after all the praise that Kerala received in the first stage of the pandemic, and this could well be leading to many being careless and ignoring basic precautionary steps. With the daily cases consistently going up to well over 2,000, contact tracing is going to be impractical and with the time that it takes, not effective either.
There is an immediate need to increase testing. Jain and Chatterjee (2020) show how variation in testing across Indian states during the lockdown phase explains a great amount of the variation in Case Fatality Rate (CFR) among the states. They show how the importance of testing is even greater in the case of states with high infection levels. With the unlocking increasing the infection load, the importance of testing has only increased.
Conclusion
There is no denying that Kerala is one of the better-performing states even now in handling the pandemic. Kerala is managing to keep its CFR very low, and is still running the show largely with the help of its robust public health infrastructure. Kerala’s low fatality rate looks even more impressive in the light of the findings by Philip et al. (2020) about the need to account for the age distribution while considering the CFR. The above-60 age group constitutes 12.8% of Kerala’s population as against 8% for India.
Different stages of a pandemic require different strategies to counter it. The unlocking phase brought back several disadvantages that Kerala had in its initial conditions. The strategies that the administration decides to use in countering the pandemic, need to adjust for the initial conditions, and more importantly, the stage of the pandemic, for these to be effective. A good starting point for the state would be to increase testing aggressively, and to do so in a smart and effective manner to get the best out of this.
Notes:
- The infected cases that came from outside the state are referred to as ‘imports’, and the cases that got infected via contact with someone within the state are referred to as ‘infections via contact’.
- The figures are obtained from the daily bulletins of the Directorate of Health Services, Government of Kerala, and http://covid19india.org was referred to for the data on testing.
- 13 July is a clear outlier with 68,753 tests. This was due to a large number of sentinel tests that were conducted. There are also fewer number of tests conducted on Sundays.
- There are different ways in which test positivity is calculated. One could use the number of daily positive results or the number of daily fresh positives (the former would include already infected individuals who could be tested positive in follow-up tests). The test positivity figures would obviously vary across the two methods, but the trend should remain the same.
- A tool to smooth out data by creating averages of a variable over a specific number of periods.
- To give a few examples, the life expectancy at birth in Kerala is 75, while it is 68 for the country. Kerala has an infant mortality rate (per 1,000 live births) of 10, while the all-India average is 34. Maternal mortality rate (per 100,000 live births) is 46 in Kerala, while the all-India average is 130. (NITI Aayog (National Institution for Transforming India), 2016). Kerala has 1.05 government hospital beds per 1,000 population as against an all all-India average of 0.55.
- These are laid out in detail in Jalan and Sen (2020).
- Kerala has a reported fatality rate of around 0.37%. There has been some controversy related to the way Kerala has been auditing the Covid-19-related deaths and deciding to report according to WHO guidelines as against ICMR (Indian Council of Medical Research) guidelines. Even if one were to include all the deaths, the CFR would still not go beyond 0.6%.
Further Reading
- Bartscher, AK, S Seitz, M Slotwinski, S Siegloch and N Wehrhöfer (2020), ‘Social capital and the spread of Covid-19: Insights from European countries’, CESifo Working Paper No. 8346. Available here.
- Brotherhood, L, P Kircher, C Santos and M Tertilt (2020), ‘An economic model of the Covid-19 epidemic: The importance of testing and age-specific policies’, IZA (Institute of Labor Economics) Discussion Paper No. 13265.
- Jain, R and T Chatterjee (2020), ‘Testing’ Times: Fighting COVID-19 Deaths during Lockdown in India’, 11 May 2020.
- Jalan, Jyotsna and Arijit Sen (2020), “Containing a pandemic with public actions and public trust: The Kerala Story”, Indian Economic Review, 1-20, 28 July 2020. Available here.
- Maya, C (2020), ‘Coronavirus: Covid-19 death audit report of Kerala raises eyebrows’, The Hindu, 30 August 2020.
- Philip, M, D Ray and S Subramanian (2020), ‘Decoding India's Low Covid-19 Case Fatality rate’, NBER (National Bureau of Economic Research) Working Paper No. w27696.
- Ray, Debashree, Maxwell Salvatore, Rupam Bhattacharyya, Lili Wang, Shariq Mohammed, Soumik Purkayastha, Aritra Halder, Alexander Rix, Daniel Barker, Michael Kleinsasser, Yiwang Zhou, Peter Song, Debraj Bose, Mousumi Banerjee, Veerabhadran Baladandayuthapani, Parikshit Ghosh and Bhramar Mukherjee (2020), “Predictions, Role of Interventions and Effects of a Historic National Lockdown in India’s Response to the COVID-19 Pandemic: Data Science Call to Arms”, Harvard Data Science Review.
- Siddarth, D, R Katz, E Graeden, T Analytics, D Allen and T Tsai (2020), ‘Evidence Roundup: Why positive test rates need to fall below 3%’, Harvard Global Health Initiative.

Comments will be held for moderation. Your contact information will not be made public.