

 28 April, 2020


International experience suggests that the rates of fatality on account of Covid-19 vary across the world. In this post, Jain and Chatterjee seek to estimate the fatality rate of the pandemic in India, and the extent of spatial variation across states. They find that the overall ‘Case Fatality Ratio’ – ratio of deaths to cases – is around 13-15%, and states such as Maharashtra, Gujarat, and Madhya Pradesh record higher values than other states.
India’s ongoing battle against Covid-19, although mismanaged, is admittedly prompt and timely. According to the Government Response Stringency Index – developed by the Blavatnik School of Governance, University of Oxford – India scored a full 100. While this lockdown was necessary to contain the spread and avoid community transfer, at this point of time what is even more imperative is stimulus from governments (Centre and state) and continued support from communities and citizens. During the lockdown, several events such as unplanned exodus of millions of migrant workers from cities, a swift communal turn due to a huge spike in the number of cases post a religious gathering in mid-March in Delhi, and soaring joblessness and unemployment have aggravated the crisis. This highlights that even a well-intended policy tool requires careful and well-planned execution.
As compared to other communicable diseases, Covid-19 is dreaded primarily because of two reasons: fast transmission and high mortality rate. As the number of Covid-19 cases keeps increasing and casualties cross 800 in India, we ask what the fatality rate of the pandemic is, and if it is spatially consistent across India. International experience suggests that the mortality rates vary across the world: 446 deaths per million population for Spain in contrast to 3 per million for China. Several theories posit that India is better protected due to BCG (Bacillus Calmette–Guérin) vaccine, demographics, temperature, and humidity, among other factors. At this juncture, it is pertinent to examine the severity of the pandemic and be better prepared in this ongoing fight.
Capturing the fatality rate of the disease in India
In this context, we explore the state-level pattern of the casualty and the plausible reasons for the same1. Instead of using the incidence rate (proportion of cases in the population) or mortality rate (proportion of deaths in the population), this post uses a measure defined as the ‘case fatality rate’ (CFR), which is better suited for capturing the severity of an ongoing pandemic (Battegay et al. 2020). We first discuss the measures used for capturing the fatality rate of the disease, and then several potential reasons driving the spatial pattern.
CFR is the ratio of deaths to cases. However, dividing the number of deaths to cases on a particular day is misleading since death is a consequence of the viral infection. An appropriate measure of fatality rate must, therefore, compare the number of deaths to the case count in the past. Hence, the first measure of CFR, that we use, is the ratio of deaths at day x to the total cases at day (x-T), where T is the average time-period from case confirmation to death. A crucial task here is the estimation of T which is calculated by pairing the number of current death and recoveries with the past total number of cases (Table 1). Data for this exercise has been collected from various sources2.
Table 1. Pairing current total recoveries and deaths with past active cases
|
Date |
Active |
Total deaths + recoveries |
|
01-Apr |
2,059 |
222 |
|
02-Apr |
2,545 |
260 |
|
03-Apr |
3,105 |
313 |
|
04-Apr |
3,684 |
382 |
|
05-Apr |
4,293 |
447 |
|
06-Apr |
4,777 |
528 |
|
07-Apr |
5,349 |
630 |
|
08-Apr |
5,914 |
746 |
|
09-Apr |
6,727 |
862 |
|
10-Apr |
7,598 |
1,035 |
|
11-Apr |
8,452 |
1,261 |
|
12-Apr |
9,210 |
1,417 |
|
13-Apr |
10,453 |
1,506 |
|
14-Apr |
11,484 |
1,760 |
|
15-Apr |
12,370 |
1,931 |
|
16-Apr |
13,431 |
2,215 |
|
17-Apr |
14,353 |
2,526 |
|
18-Apr |
15,724 |
2,987 |
Note: The cell values denote the absolute number of cases for the two categories. The values in bold denote matches between the two columns.
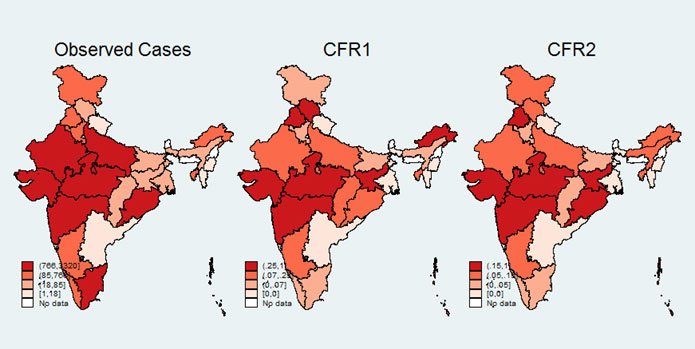
Table 1 shows that T equals 15 days for India. An alternative measure of CFR, as proposed by Ghani et al. (2005), is calculated as the ratio of current deaths to the sum of current deaths and recoveries. This measure is free of estimation of a time window and is completely based on cases with a verdict on any date. We use both methods for calculating CFRs for all major states as on 17 April 2020 – CFR1 (deceased on 17 April/cases on 2 April) and CFR2 (deceased on 17 April/deceased and recoverees on 17 April)3. The spatial distribution of the number of cases and the two CFRs are given in Figure 1.
Figure 1. Spatial pattern of observed cases and CFR
Geographic variation of CFR across India and factors responsible
The overall CFR in India hovers around 13-15%. It also indicates that the CFRs by both methods are similar (correlation coefficient4 of 0.88). Additionally, CFR varies highly across states. For instance, Maharashtra, Gujarat, and Madhya Pradesh record higher CFRs as compared to the rest of the states.
Next, we examine the factors that explain this geographic variation5. We group our preliminary set of variables into two categories: (i) testing and social distancing, and (ii) health infrastructure and vulnerability6.
Test incidence and social distancing
As is widely acknowledged, swift and accurate testing is critical to fight Covid-19. We use tests conducted per million population as on 12 April. CFR exhibits a negative association with tests per million population (Figure 2, top left panel). For instance, Kerala has been conducting more than 425 tests per million population and has the lowest CFR among all states.
Another crucial factor affecting the extent of the spread is social distancing. Despite the lockdown announced in India, social distancing is a distant dream for a huge proportion of the population. Social distancing is likely to be more difficult for households if they have to frequently access common/public spaces for a basic need such as drinking water. To capture this aspect, we use percentage of households that do not have a drinking water source within the premises.
Figure 2. Select variables and CFR1
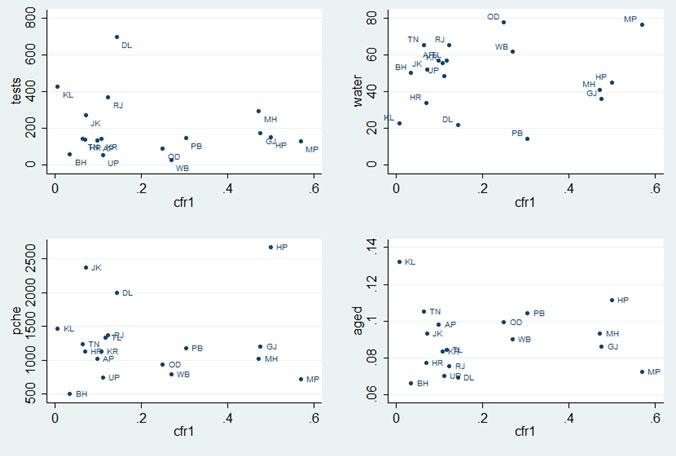
CFR shows a weak positive association with the percentage of households who do not have access to drinking water within the premises (Figure 2, top right panel). Both these factors emphasise the critical role of testing and social distancing in managing Covid-19 severity. Further, we find that CFR is positively associated with high population density and urbanisation (number of urban agglomerates).
Medical infrastructure and population vulnerability
We capture medical infrastructure using per-capita health expenditure (‘pche’) at the state level. We find a negative relationship between the two variables (Figure 2, lower left panel) affirming that the more a state spends on the health sector, the lower will be the severity of any disease. With the international experience of higher incidences of death among the aged, we use the proportion of above 60 population group to capture population vulnerability (Figure 2, lower right lower panel). As expected, we find a positive association between the two variables. Other health-related variables, such as number of doctors, and pneumonia and respiratory-related illnesses per million population, also suggest a weak negative and positive association, respectively. It must be noted that severity of a communicable disease is likely to be driven by other factors such as poverty, malnutrition, co-morbidity, and migration among others, which is beyond the scope of the current version of the study.
Policy implications
To summarise, this preliminary analysis highlights that testing, social distancing, and health infrastructure are critical in containing this disease. Only a coordinated effort by the central and state governments and individuals will avoid further community spread. While India is lagging behind in testing, recent developments that include using the ‘phone booth’ method and revising of strategies that expand testing coverage are well-appreciated. At the community level, the burden of ensuring social distancing must be borne by the citizens and civil society organisations. However, the government must develop strong safety nets (such as, kind and cash transfers and fiscal stimulus) for the vulnerable sections that cannot afford it. From the perspective of health infrastructure, lockdown is a window of opportunity for the government to boost health infrastructure (expand hospital capacity, bring retired doctors and healthcare providers on board). The need of the hour is for the government and the community to act in unison.
Notes:
- India, given its huge geographic spread, is very diverse, and ideally one should analyse spatial differences across districts. To the best of our knowledge, we do not get a district-level report on number of deaths at this stage. Therefore, as we parallelly work on district-level analysis, here we discuss state-level disparity.
- We collect state-level daily data on the total number of cases, number of deceased and recoverees from https://www.covid19india.org. Data on tests done per million population is collected from India Today published on 13 April. Data on drinking water facilities, and all health-related indicators has been collected from National Health profile, 2019, published by the Ministry of Health and Family Welfare. Data on the number of urban agglomerates is taken from Handbook of Urban Statistics, 2019.
- Measures will be made available upon request.
- Correlation denotes linear association between two quantitative variables. The degree of association is measured by a correlation coefficient.
- For this part of the analysis, the study focuses on 17 major states of the country which account for 98% of all cases.
- Our third set of variables – geographic ones – will be used later when we do a district-level analysis. This is because the impact of geography is much more evident at the district level. However, at this stage, one comment can be made that CFR rates are very similar across neighbouring states, indicating potential geographic spillover and interlinkage.
Further Reading
- Battegay, Manuel, Richard Kuehl, Sarah Tschudin-Sutter, Hans H Hirsch Andreas F Widmer and Richard A Neher (2020), “2019-Novel Coronavirus (2019-nCoV): estimating the case fatality rate – a word of caution”, Swiss Medical Weekly, 150:w20203.
- Ghani, AC, CA Donnelly, DR Cox, JT Griffin, C Fraser, TH Lam, LM Ho, WS Chan, RM Anderson, AJ Hedley and GM Leung (2005), “Methods for Estimating the Case Fatality Ratio for a Novel, Emerging Infectious Disease”, American Journal of Epidemiology, 162(5):479-486, 1 September 2005.
- Ministry of Family and Health Welfare (2019), ‘National Health Profile, 2019’, Issue 14, Government of India.
- Ministry of Housing and Urban Affairs (2019), ‘Handbook of Urban Statistics, 2019’, Government of India.

By: Abhilash S APS to Finance Minister 05 June, 2020
Commendable work.Kudos