

 12 February, 2021


Highlighting some of the key features of the 2021-22 Union Budget, Sarthak Agarwal contends that although this Budget was presented in an exceptionally difficult period for the Indian economy, policymakers have remained cognisant of the structural challenges facing the country.
The Finance Minister, Nirmala Sitharaman, had promised a ‘once in a century’ Budget for FY2021-22. Whether she lived up to that tall claim is a tough question – there were long-pending reforms that finally saw the light of day, but also other areas where incremental thinking dominated big-bang initiatives.
In this post, I present 10 charts that capture the essence of Union Budget 2021-22. I also discuss some structural challenges of the Indian economy and how the Centre has addressed them (or not) through the Budget.
Government receipts, expenditure, and deficit
The Covid-19 crisis for public finances is best visualised in Figure 1, which shows that actual receipts (provisional figures) for April-December 2020 were only 50% of FY2020-21’s budgetary estimates (BE).1 This number stood at about 55% for the previous financial year. However, the Centre’s expenditures in the two years were broadly similar as a proportion of the budgeted amounts.
Figure 1. Government receipts and expenditure
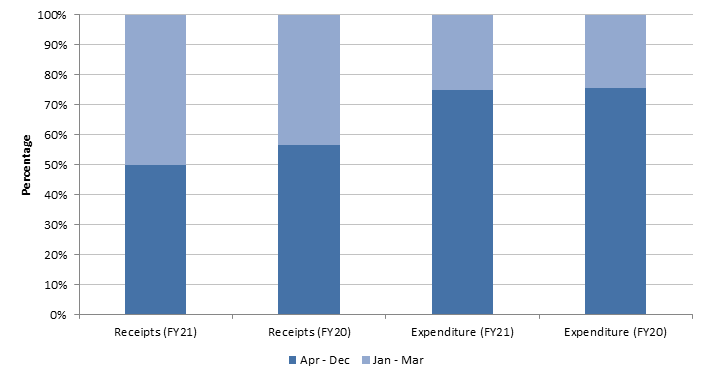
Note: Figures for FY2020-21 for April-December 2020 (versus April-December 2019), computed as a proportion of budgetary estimates for that year (and not revised estimates).
Source: Controller General of Accounts.
It is clear that the ‘automatic stabilisers’2 of public spending kicked in while the other three levers of demand – consumption, expenditure, and net exports – remained muted. However, some may wonder whether the Centre could have done more during the peak of the pandemic – only 75% of the budgetary allocations were spent in the crisis year, compared to 76% during the previous financial year.
As per the revised estimates (RE) however, total spending in FY2020-21 was raised by 13.4% over the budgeted amount. Since revenues were not expected to recover sharply (revised non-debt receipts were lower by 28.7%), budgetary deficits reached historically high levels. The Centre’s fiscal deficit stands at 9.5% of GDP (gross domestic product) as per FY2020-21 RE but is estimated to decline to 6.8% during FY2021-22 (BE).3
However, these deficit figures reflect the fact that off-budget borrowings were finally recognised in FY2020-21 RE after years of being hidden in various parts of the Budget (discussed below).
Figure 2. Deficit numbers reach historical levels
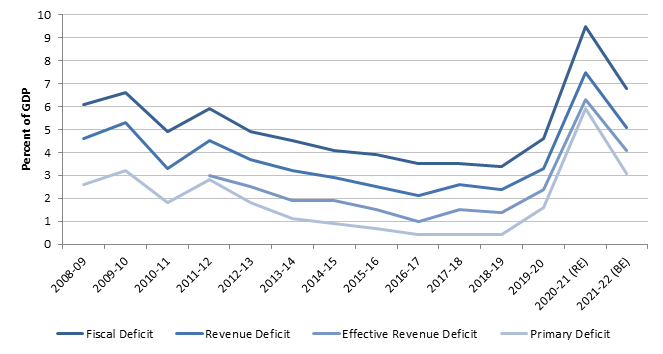
Notes: (i) Effective revenue deficit (as a percentage of GDP) series starts from 2011-12. (ii) Actuals for 2019-20 are provisional figures in Union Budget 2021-22. (iii) Fiscal deficit (comprising revenue and capital deficit) is the excess of government expenditure over revenue in a year. Revenue deficit is the government’s total revenue expenditure over its total revenue receipts. Effective revenue deficit is defined as the difference between revenue deficit and grants for creation of capital assets. Primary deficit is the fiscal deficit of the current year minus interest payments on previous borrowings.
Sources: Economic Survey 2020-21; Union Budget 2021-22, Government of India.
Figure 3 illustrates the Centre’s continuous inability to meet the 0% revenue deficit target – a hallmark of sound public finance. Of late, revenue deficits have also remained stubbornly high as a proportion of fiscal deficit, implying that most of the government’s borrowings are financing current expenditures4 (Chakraborty 2020). However, this ratio is estimated to decline to 75% in FY2021-22 (BE) from almost 80% in FY2020-21 (RE).
Figure 3. Revenue deficit remains high as a proportion of fiscal deficit
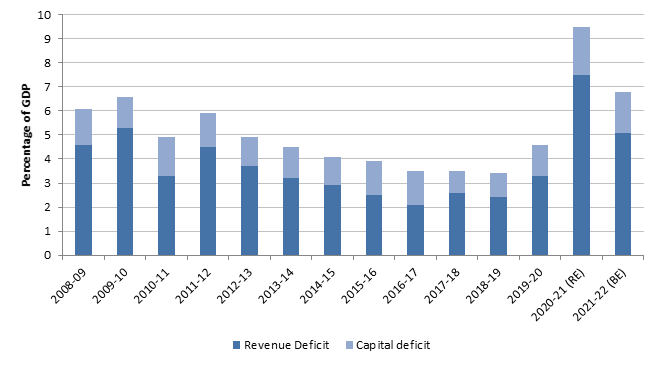
Note: Graph shows total fiscal deficit disaggregated across revenue deficit and deficit on the capital account.
Source: Union Budget, Government of India (various years).
One of the biggest components of the Centre’s revenue expenditures – besides interest repayments – is subsidies. Its share in government expenditure over nine major discretionary categories (Figure 4) has doubled in FY2020-21 (RE). This is on account of the belated admittance by the Centre of hidden food subsidy outlays, financed mainly by coercing the Food Corporation of India (FCI) to borrow from National Small Savings Fund (NSSF) and other agencies (Gulati and Banerjee 2020). The government has finally recognised these borrowings as part of public expenditure and hence, there is a steep one-time increase in FY2020-21. In FY2021-22 BE, the outlay on subsidy is estimated to drop sharply, although it is estimated to remain high relative to pre-pandemic levels.
Figure 4. Steep increase in subsidies as a percentage of total expenditure, stagnation in defence
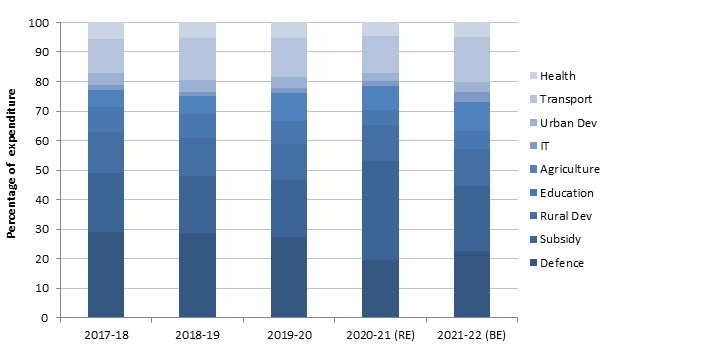
Note: Sum of expenditures on nine major items, normalised to 100 for each year.
Source: Union Budget 2021-22 (Budget at a glance).
Capital expenditure in the 2021-22 Budget
This year’s Budget has been praised by some commentators for substantially increased spending on capital expenditure. Capital expenditure has remained roughly stagnant for most of the past decade, despite an initial increase in the first half of the NDA-II (National Democratic Alliance) regime (2019-2024). However, this is all set to change with much higher allocations in FY2020-21 (RE) and FY2021-22 (BE). The Budget suggests that capital expenditure will soon touch 2.5% of GDP – the highest figure in the past decade.
If we ignore the temporary blip between 2014-15 and 2017-18, capital expenditure has remained roughly constant at about 1.75% of GDP in the last decade. Similarly, its share in total government spending too has stagnated at around 12%.
Figure 5. Sharp uptick in capital expenditure
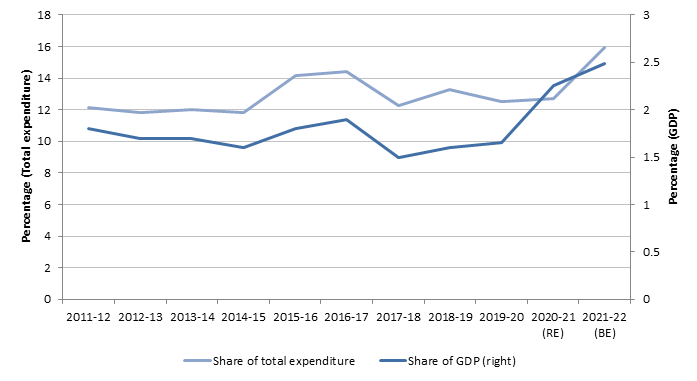
Note: The vertical axis on the right side shows capital expenditure as a share of GDP. Only gross budgetary support (GBS) capital expenditures have been taken into account (more on this below).
Source: Economic Survey 2020-21; Union Budget 2021-22, Government of India.
FY2020-21 RE represent a sharp increase in capital expenditure, as a proportion of GDP, relative to BE. This is not unexpected because nominal GDP fell by 4.2% in the year while overall government expenditure remained the same. Thus, the share of total public spending in GDP also registered a sharp increase in FY2020-21 and capital spending was no exception. If we look closely at capital expenditure as a proportion of total expenditure, this figure is estimated to grow in FY2021-22 (BE) to about 16% – a substantial figure given the historical trend.
Most of the reporting on the Centre’s capital expenditure looks only at the outlay from the Union Budget (as in Figure 5). However, Public Sector Undertakings (PSUs) also incur investment expenditure from their own sources. The latter component is known as internal and extra budgetary resources (IEBR), and since 2014-15, it has replaced ‘GBS’ to capital expenditure from the Centre as the principal component of the Centre’s public expenditure. A report of the Reserve Bank of India (RBI) argues that both of these must be considered together to reach a fuller picture of the capital expenditure incurred by India’s public sector.
Figure 6 shows that between FY2020-21 (RE) and FY2021-22 (BE), GBS has grown at the expense of IEBR, the latter perhaps an outcome of PSUs’ stressed balance sheets due to the pandemic. While GBS to capital expenditure jumps by 26% – a figure much talked about in the media – overall capital spending grew by 4.8% and remain roughly constant in real terms (if inflation is at 4.4%, as projected by Economic Survey 2020-21).
Figure 6. Shift in financing capital expenditure
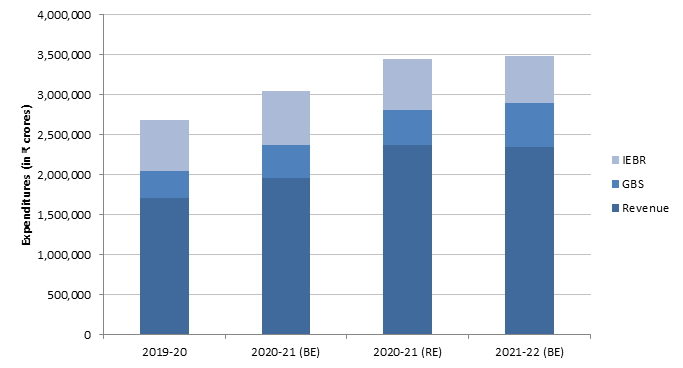
Note: GBS is gross budgetary support to capital expenditures. IEBR is internal and extra budgetary resources invested by PSUs.
Source: Union Budget 2021–22, Government of India.
Agriculture in the 2021-22 Budget
Total spending on agriculture might have risen sharply in the last two years (Figure 7) but most of this is on account of higher (food) subsidies for repaying the FCI’s past debts.
Public investment as a share of total government expenditure in agriculture, has remained low since the 1990s (Fan et al. 2008). The 2021-22 Budget does little to reverse this concerning trend – although the high allocations in FY2020-21 (BE) gave room for optimism, a subsequent cutback in FY2020-21 (RE) and an insignificant increase this year are disappointing.
PM-KISAN (Pradhan Mantri Kisan Samman Nidhi)5 too has seen a reduction in outlay from Rs. 75,000 crore to Rs. 65,000 crore, reflecting the smaller number of farmers availing this scheme compared to what was originally envisaged.
Figure 7. A boost to agriculture?
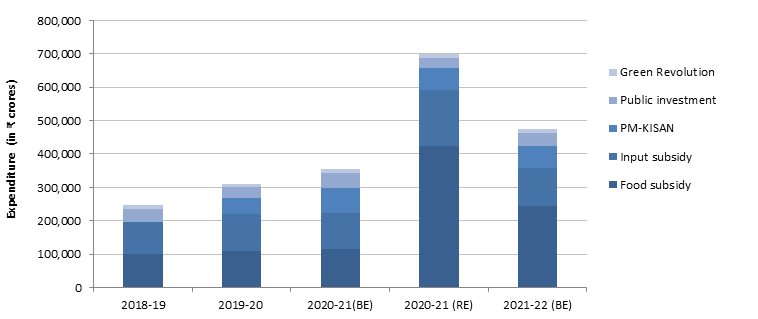
Note: Gulati and Banerjee (2020) classification. “Green Revolution” consists of several small development schemes mentioned in Union Budget 2021-22. Input subsidy includes subsidies on fertiliser, crop insurance, and interest subsidy on short-term credit. Public investment’s components are elaborated in Figure 8.
Source: Union Budget 2021–22, Government of India; Gulati and Banerjee (2020).
Figure 8. Public investment in agriculture remains stagnant
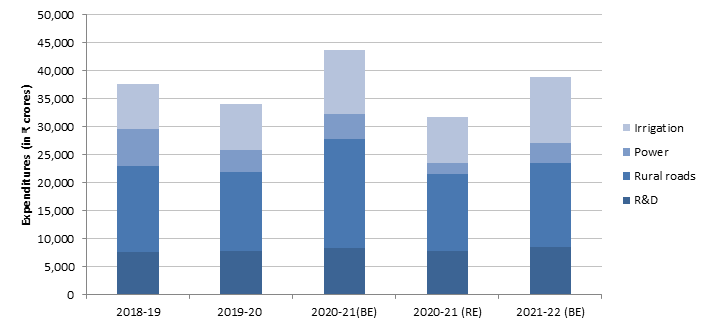
Note: This figure shows budgetary allocations for Pradhan Mantri Grameen Sadak Yojana (Rural roads scheme); Pradhan Mantri Krishi Sinchayee Yojana (Irrigation scheme); Deen Dayal Upadhyay Gram Jyoti Yojana (Power scheme); and the Centre’s expenditure on R&D.
Source: Same as Figure 7.
Given the importance of public investment in agriculture, we look closely at its components in Figure 8. Allocations for all components suffered a drop in FY2020-21 (RE) over the BE. Expenditure towards agricultural research and development (R&D)6 fell by 1% between 2019-20 (actuals as mentioned in 2021-22 Budget) and FY2020-21 (RE) – reflecting the shift in priorities post Covid-19 – but is budgeted to grow by 9.7% in the coming year. Estimates suggest that the recently revisited rate of return on agricultural R&D is quite substantial, which thus warrants a much steeper hike in allocations (Hurley et al. 2014).
Disinvestment and taxation in the 2021-22 Budget
Of late, proceeds from equity sales of PSUs have lagged behind BE. In FY2020-21, only 15% (Rs. 32,000 crore) of the budgeted Rs. 210,000 crore could be realised. However, the Centre remains ambitious in banking on non-debt capital receipts to finance its growing expenditure burden. In the FY2021-22 BE, it is estimated to gather Rs. 175,000 crore from disinvestment – to anyone underestimating the challenge, Figure 9 (dotted line) shows the steep climb required to close in on the target.
Figure 9. Growing gap between actual and budgeted receipts from disinvestment
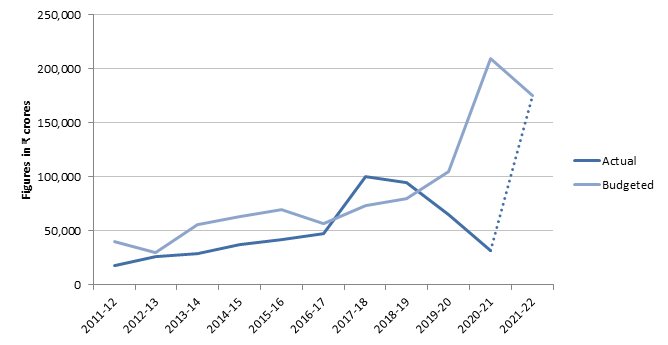
Note: Provisional actuals for 2020-21 (Rs.32,000 crore).
Source: Union Budget 2021–22; Provisional Accounts of Central Government Finances 2019-20: An Assessment, Reserve Bank of India.
The Budget works with the assumption that revenues from corporation tax, income tax, and goods and services tax (GST) will grow by over 22% in FY2021-22 over the RE of the previous budget. On the other hand, central excise revenues are expected to fall by 7% even as nominal GDP grows by 14.4%. This is a consequence of the new agricultural cess introduced in the Budget that will replace and reduce central excise duties and customs on certain products and hence, sharply lowers the revenues obtained from central excise, reflected in the negative buoyancy figures.
The overall buoyancy of gross tax revenues for FY2021-227 is estimated to be only slightly higher than historical averages computed by the Reserve Bank of India (2010-2019), as seen in Figure 10. Long-term data on GST buoyancy are not available. However, last year, the Centre assumed a less optimistic 1.2 buoyancy figure, while for FY2021-22 it is estimated to increase its forecast to 1.55.
Figure 10. Centre assumes buoyant tax revenues post-pandemic
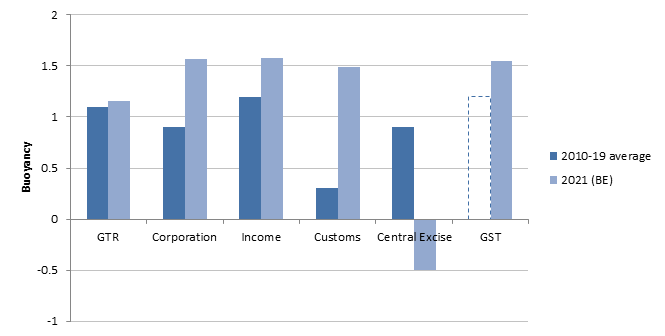
Note: GTR is gross tax revenue. Historical averages for GST are not available from the RBI and hence, the 2020 (BE) buoyancy estimate for GST is provided for comparison.
Source: Union Budget 2021–22, Government of India; Monetary Policy Report 2019, Reserve Bank of India.
The implied buoyancy of 1.57 for corporation taxes in FY2021-22 might be difficult to attain with 2019’s steep reduction in rates. Using budget data, my estimates suggest that if corporation and income taxes revert to their long-term averages, the Centre will collect Rs. 73,000 crore less than what it has budgeted for – equal to the entire allocation for MNREGA8 in FY2021-22.
Overall assessment
In conclusion, although this Budget was presented in an exceptionally difficult period for the Indian economy, policymakers remained cognisant of the structural challenges facing the country. Increasing the share of capital expenditure will create long-term assets and boost growth over the medium term. Transparent fiscal reporting – brought about by phasing out extra-budgetary borrowings almost entirely – will restore credibility to India’s deficit numbers.
Challenges in meeting targets for tax collection and disinvestment proceeds might be significant but in the absence of a second wave of Covid-19 cases, cheer may return to the Revenue Department.
However, agricultural investment – especially R&D – deserves greater emphasis. The sector’s struggles over the years can be neatly mapped onto the declining share of capital formation and rising proportion of subsidies in the Centre’s total outlay on agriculture. Now that the Centre has come clean on food and fertiliser subsidy, one can hope that investment in agriculture will be increased in the coming years.
This is being termed as a growth Budget more than a revivalist one. This shows that the Finance Minister still has an eye on the ‘US$5 trillion GDP by 2024-25’ goal – the coming year may tell us more about how realistic that is.
Notes:
- Budget estimates refers to the amount of money allocated in the budget to any ministry or scheme for the coming financial year. Revised estimates are mid-year review of possible expenditure and need to be authorised for expenditure through parliamentary approval or by re-appropriation order.
- Automatic stabilisers are features of the Budget that automatically help to reduce fluctuations in GDP – for instance, since tax revenues fall during a recession while government expenditure usually does not (to the same extent), the deficit widens, and hence the government is seen to be implementing a countercyclical fiscal policy even if it has not explicitly reacted to the downturn.
- It must be noted that fiscal deficit had already started rising even before the pandemic, after displaying a slight downward trend for the better part of the last decade.
- Revenue expenditure is expenditure for the normal running of government departments and various services, interest charges on debt incurred by government, subsidies and so on. Capital expenditure refers to expenditure that create assets or reduce the liability of the government.
- Under the Kisan Samman Nidhi scheme an income support of Rs. 6,000 per year in three equal instalments is provided to small and marginal farmer families having combined land holding/ownership of up to two hectares.
- Rate of return on R&D is an increase in agri-GDP over some time period, expressed as a percentage of the initial investment. Hurley et al. 2014 show that even if use a modified internal rate of return (since the internal rate of return measure has several methodological deficiencies in this context), the median return on agricultural R&D still stands at a respectable 9.8%.
- Tax buoyancy measures the response of tax revenues to a change in GDP and tax policy.
- MNREGA guarantees 100 days of wage-employment in a year to a rural household whose adult members are willing to do unskilled manual work at the prescribed minimum wage.
Further Reading
- Chakraborty, Lekha (2020), “Fiscal Consolidation Ex Post the ‘Escape Clause’”, Economic and Political Weekly, 55(9).
- Fan, Shenggen, Ashok Gulati and Sukhadeo Thorat (2008), “Investment, subsidies, and pro‐poor growth in rural India”, Agricultural Economics, 39(2): 163-170.
- Gulati, Ashok and Pritha Banerjee (2020), “Goal Setting for India Agriculture”, 55(9).
- Hurley, Terence M, Xudong Rao and Philip G Pardey (2014), “Re-examining the Reported Rates of Return to Food and Agricultural Research and Development”, American Journal of Agricultural Economics,96(5):1492-1504.

Comments will be held for moderation. Your contact information will not be made public.