

 20 January, 2021


In March 2021, India will complete five years since the adoption of the inflation targeting framework by the government and RBI. Analysing inflation data since 1996 using alternative models, this article argues that the ‘output gap model’ that underlies the current regime is not the best descriptor of inflation trends in India.
As the five-year tenure of the first agreement between Government of India and Reserve Bank of India (RBI) on inflation control draws to a close, evaluations of inflation targeting have begun to emerge both in the press and academia (Arun 2020, Eichengreen et al. 2020). On balance, the commentary in the press has been less favourable than the academic assessments. Two assertions have appeared in the latter: first, inflation rate has been lower since 2016 (when inflation targeting was introduced) and second, inflation targeting by the RBI has succeeded in anchoring inflationary expectations. In fact, the lower inflation is seen as reflecting the latter achievement. We find this to be an empiricist approach, laden with pitfalls.
When empirical assessment is made without theory, in this case of inflation, one cannot be sure of having dealt with observational equivalence. In this particular case, one cannot be sure if what is being observed is the consequence of the actions of the Central Bank or the workings of an independent mechanism. We explain this below, but commence with a discussion of alternative inflation models for India.
Alternative models for understanding inflation
In the 1990s, mainstream economics projected that there was only one game in town when it came to doing macroeconomics, and that its rules were set by the New Classical Macroeconomics. A central construct of this school of thought was the NAIRU, that is, the non-accelerating inflation rate of unemployment. The economy, it was asserted, would tend towards this rate of unemployment at which the inflation rate would be constant. In the less academic language of economic policymaking, a rise in the inflation rate was said to reflect an ‘overheating’ economy, one in which unemployment was lower than at its natural rate1 or, equivalently, actual output was greater than its natural level. As the latter is termed 'the output gap' in the literature we term this view of inflation as 'the output gap’ model. This, at any rate, was the basis of the model presented in the RBI study that recommended inflation targeting in India (RBI, 2014). The study claimed to draw its inspiration from the New Keynesian Phillips curve.2 (Gali and Gertler 1999).
In the model, current inflation is specified as a function of the output gap, the expectation of inflation, and the lagged inflation rate. In this model, expectation formation takes the form of a ‘hybrid model’ combining the rational and adaptive expectations3 approaches.
However, inflation in India may be modelled in ways other than how it is done in the output gap model. There is the structuralist model, with its origins in Latin America, which interprets inflation as the result of relative price adjustment within the economy and changes in the price of imported inputs.4 Consider an economy with two sectors, namely agriculture and industry, with different pricing rules. In agriculture the (relative) price clears the market while in industry, prices are set as a constant mark-up over costs. A supply constraint implies that the economy experiences recurring excess demand in the agricultural goods market. Now, given cost-determined industrial prices, the necessary rise in the relative price can come about only through a rise in the absolute price of the agricultural good. This translates into a rise in the general price level via wage adjustment, as wages are tied to the price of food, the principal agricultural good. Thus, inflation reflects changes in the relative price and the price of imported inputs, of which oil may be considered the most important. Finally, variation in exchange rate also contributes to inflation by altering the cost of imported inputs. It must be noted, that there is no unique specification of the structuralist view of inflation. Hence, there is more than one model of inflation that may be deployed to understand inflation in India. And they are distinct, or non-nested, in that one cannot be derived as a special case of the other.
Inflation models and inflation in India
We estimate both the above models using: two different measures of inflation – the gross domestic product (GDP) deflation and the consumer price index (CPI) – with data at two different frequencies (annual and quarterly) and from two different sample periods5 (necessitated by the fact that quarterly data are available for a relatively recent period compared to annual data) (Balakrishnan and Parameswaran 2019). In not even one estimate of New Keynesian Phillips Curve model – using the six cases implied above – was the output gap statistically significant and of the right sign, that is, positive. On the other hand, the relative price was statistically significant, and of the right sign,6 in every estimation. The poor performance of the output gap model in relation to inflation in India data has been recognised by several researchers before us (Paul 2009, Hatekar et al. 2011). This, however, does not seem to have deterred those claiming the efficacy of inflation targeting in India.
Assessment of inflation targeting: What the evidence implies
Our results have clear implications for the favourable assessments of inflation targeting that have appeared. First, as the output gap is not statistically significant in tests of the output gap model, the model underlying inflation targeting – as set out in RBI (2014) – has no explanatory power. Even if inflation in India has been lower since 2016 – when inflation targeting was formally adopted – can it be said that it is the outcome of inflation targeting? Further, not even evidence from surveys showing that agents expect lower inflation since 2016, can confirm that this is due to the adoption of the inflation targeting framework. It is entirely possible that agents are using the structuralist model in forming their expectations. Indeed they would be justified in doing so as the structuralist model predicts the inflation rate after 2016 quite well, as we demonstrate below.
Our empirical results have an implication for the output effects of inflation targeting. If the output gap is not a determinant of inflation then raising the interest rate in response to rising inflation could lead to a loss of output without lowering the inflation rate – the worst of all possible scenarios.
On the decline in inflation since the adoption of inflation targeting
Favourable evaluations of inflation targeting in India are largely based on the inflation rate having declined since its adoption. However, if it can be demonstrated that the structuralist model does a good job of forecasting inflation, it would imply that the decline in inflation has little to do with inflation targeting. It could be due to weaker relative price shifts and lower oil-price inflation.
Figure 1 presents the inflation forecasts for the period after 2016 using the structuralist model. The model was estimated from the first quarter of 1996-97 to the fourth quarter of 2015-16, and used to predict CPI inflation during the period from the first quarter of 2016-17 to the first quarter of 2020-21. The out-of-sample forecasts are the points beyond the vertical line, drawn at the first quarter 2016-17. Note that, as may be seen from the fitted trend line, our model predicts lower inflation from 2016. A reasonably strong correlation (0.79) is estimated between the actual and predicted values, indicating predictive power of the structuralist model.7
Figure 1. Inflation forecasting based on the structuralist model
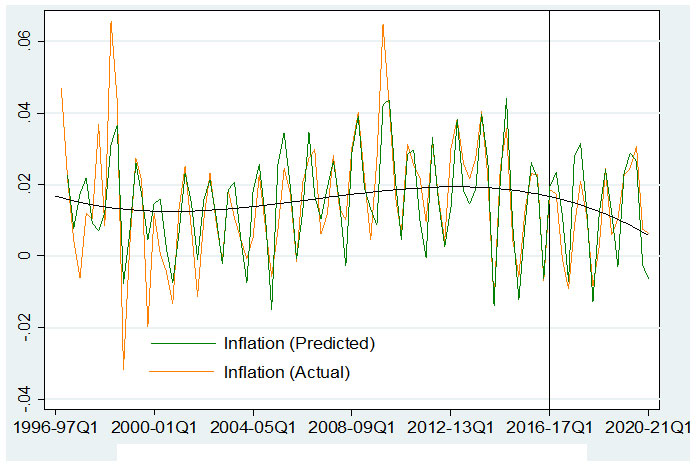
Figure 2. CPI inflation from 2000-01 to 2020-21
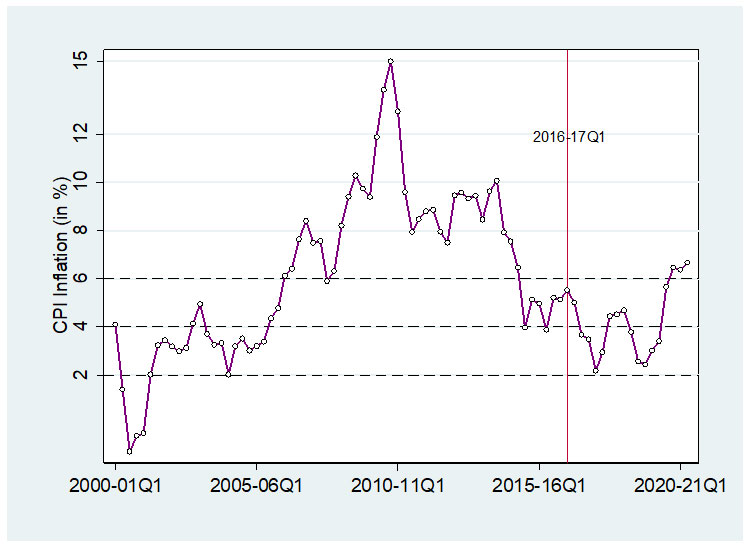
We believe that the role of inflation targeting in lowering inflation since 2016 may be understood in yet another way – by observing the trajectory of inflation for the past two decades. Note from Figure 2 that a decline in inflation had commenced before 2010, implying that inflation has been trending downward even prior to the adoption of inflation targeting (Balakrishnan 2019). So, statistically speaking, the period since 2016 can be seen as the continuation of a trend that had commenced earlier. As for the period after the adoption of inflation targeting, growth has been declining, putting less pressure on food prices. The structuralist model would imply lower inflation in such a situation, as seen in Figure 2.
Altogether, the data do not warrant the conclusion that the inflation rate is what it is after 2016 due to inflation targeting. Inflation had declined to the RBI’s target range – 4% plus or minus 2% annually – six quarters prior to 2016. Moreover, if we are willing to go back long enough we would see in Figure 2 that for approximately six years starting 2000 it has remained within the band adopted under the inflation targeting agreement between the government and the RBI. It was also less volatile then, hovering around 4%, unlike after 2016.
Conclusion: Inflation targeting and the recent surge in inflation
The value of ‘natural experiments’ in identifying causes of economic outcomes is widely appreciated. Thus, the lockdown prompted by Covid-19 affords us an ideal opportunity to investigate the factors that drive inflation. The period since the lockdown was imposed in late March last year, lasting for close to 10 weeks, has seen a spike in the inflation rate. Since then, inflation has been consistently above the prescribed upper-bound target of 6%. It implies that the RBI has been unable to contain inflation during this period. More to the point, the output gap model, which the RBI is bound to, has little traction when it comes to explaining the phenomenon. We now know that GDP contracted 23.4% in the first quarter of this year. If inflation reflects a positive output gap, its decline would require the natural rate of output to have reduced even more precipitously than actual output for inflation. Surely the higher inflation is not the sign of an ‘overheating’ economy. On the other hand, we can easily see the role of a rise in the relative price of food in it. The price of food, with the largest share in the CPI), has risen at a rate faster than non-food prices since April 2020. This feature, along with the evidence we have detailed here, gives us reason to believe that the structuralist model is the best descriptor of inflation in India. This implies that only effective supply management can tackle inflation in India, inflation targeting acting on the Phillips Curve cannot.
I4I is now on Telegram. Please click here (@Ideas4India) to subscribe to our channel for quick updates on our content
Notes:
- The natural rate of unemployment is defined as the rate at which unemployment is compatible with a steady inflation rate.
- The New Keynesian Phillips curve implies that increased inflation can lower unemployment temporarily but cannot lower it permanently.
- The rational expectations theory states that an individual bases their decisions on human rationality, past trends, and the information available to them; while in the case of adaptive expectations, an individual only uses past trends to make future decisions.
- See Basu (2003).
- The data for this analysis is from the Central Statistical Organisation’s National Account Statistics, extracted from the EPW Research Foundation's 'India Time Series' database. The annual data is for the period 1971-72 to 2015-16, except in the case of the Labour Share where it is for the period 1980-81 to 2015- 16. The quarterly data is for the period 1996-97(Q1) - 2017-18(Q3).
- As shown in Balakrishnan and Parameswaran (2019) the expected sign is positive.
- It may be mentioned that we reckoned that it makes little sense to use the output gap model to forecast inflation after 2016 as the output gap term was not statistically significant in any of the estimates.
- The inflation rate upto the third quarter of 2011-12 is computed using a constructed CPI, which combined the separately given CPI for ‘agricultural labour’ and ‘industrial workers’ with weights of 0.7 and 0.3, respectively. For the period from the fourth quarter of 2011-12 onwards, the new consumer price index with base 2012 = 100 (combined for rural and urban India) is used.
- A natural experiment occurs when units of observation are exposed to ‘treatment’ and ‘control’ conditions using variation that is outside the control of the researchers. These typically involve comparing outcomes before and after a policy for those exposed to the policy (treated group) relative to a contemporaneous control group that was not exposed to the policy, but where the exposure to the policy was not randomised by the researcher.
Further Reading
- Arun, TK (2020), ‘As instrument of Monetary policy, inflation targeting has outlived its utility’, The Economic Times, 11 October.
- Balakrishnan, Pulapre (2019), “Unmoved by stability: Capital formation in the Modi economy”, Economic and Political Weekly, 54(30): 33-36.
- Balakrishnan, P and M Parameswaran (2019), ‘The Dynamics of Inflation in India’, Working Paper No. 485, Centre for Development Studies, Thiruvananthapuram.
- Basu, K (2003), Analytical Development Economics – The Less Developed Economy, The MIT Press, Cambridge MA.
- Eichengreen, B, P Gupta and R Choudhary (2020), ‘Inflation Targeting in India: An Interim Assessment’, The World Bank.
- Galí, Jordi and Mark Gertler (1999), "Inflation Dynamics: A Structural Econometric Analysis", Journal of Monetary Economics, 44(2): 195-222.
- Hatekar, Neeraj, Ashutosh Sharma and Savita Kulkarni (2011), “What Drives Inflation in India: Overheating or Input Costs?”, Economic & Political Weekly, 46(34): 46-51.
- Paul, Biru Paksha (2009), “In search of the Phillips curve for India”, Journal of Asian Economics, 20(4): 479–488.

By: Shaurya 08 September, 2022
I think that this is very interesting. Good points made by everyone in the chat