

 06 June, 2020


In the first part of the series, Dr Pronab Sen discussed the performance of the Indian economy during the last two major economic shocks – Global Financial crisis in 2008, and demonetisation-cum-GST in 2016-17 – and drew lessons for the current crisis. In this part, he estimates the damage to the economy due to the lockdown and export slowdown, taking into account the fiscal stimulus announced by the government so far. Presenting the expected trajectory of the economy over the next three years, he contends that the likely recovery path is not a V, but an elongated U, maybe even closer to an L.
The Covid-19 shock
When the Covid-19 pandemic struck India in February 2020, the Indian economy was already in the middle of a prolonged slowdown driven by steadily weakening demand. This was in stark contrast to the two previous crises, when the economy was at or near its cyclical peaks. The implication of this is that the level of resilience and staying power of both enterprises and consumers is much lower in this case than in the previous two. This fact has significant bearing on the ability of the economy to weather and come out of this shock; and, therefore, on the size and duration of the policy response that will be required.
Before we get to this, it is necessary to get some sense of the damage that can be expected. In doing so it makes little sense to use percentages of GDP, since the GDP itself is endogenous to the computations, and will change as assumptions change. It is, therefore, better to work with absolute values and work out the various ratios after all adjustments have been made.
The first thing to note is that a lockdown itself is a pure supply shock.1 There will be consequences on demand as incomes get affected, but these are secondary effects. As things stand, the supply effect of the lockdown, which affects somewhere between 50 to 55% of the economy on an optimistic basis, leads to a weekly loss to the economy of around Rs. 2 trillion (1% of 2019-20 GDP) in 2019-20 prices. Thus, in the nine-odd weeks that the nationwide lockdown has been in effect since 25 March, the total loss would be Rs. 19 trillion (9.5% of GDP). If one adds to this the partial lockdowns that were implemented by state governments for three weeks prior to the national measure, the total loss to date could be Rs. 23 trillion (11.5% of GDP) or more.2 Further damage will occur in the coming weeks depending upon the content and time-path of lifting the lockdown in a phased manner as has been announced by the government. But let us set this aside for the moment and assume that the lockdown is lifted all at once across the entire country on 31 May 2020.
This Rs. 23 trillion represents only the first round effect of the lockdown. This income loss will lead to second round, third round and subsequent round effects as well.3 This whole process takes between 1.5 to 2 years to work itself through the economy. As a consequence, the total damage in 2020-21 will be Rs. 43.7 trillion minus the damage that will be accounted for in 2019-20. This latter amount is around Rs. 4 trillion;4 yielding a net effect for 2020-21of Rs. 39.7 trillion. This number should be seen against the expected addition to GDP in 2020-21 if the pandemic had not happened. If we go by the Budget numbers, the budgeted government expenditure was expected to support a growth rate of 6% in 2019-20 prices, which translates to an additional GDP in 2020-21 of Rs. 16.4 trillion. Thus, if there is no increase in government expenditure beyond the budgeted numbers, the GDP in 2020-21 will be Rs. 23.3 trillion less than the 2019-20 GDP.
This is bad enough, but things will get worse through the impact of the global economy on India. As far as exports are concerned, given that the global economy is expected to contract despite massive fiscal support in most countries, global trade will also contract significantly. Indian exports can hardly expect to remain unscathed. Production for exports is exempted from the lockdown and, therefore, is not included in the above loss calculations. Although there is no estimate at present of the extent to which global trade will decline, it is not unreasonable to assume that Indian exports may go down by at least 12% in 2020-21 compared to the previous year.5 In such a situation, export earnings will decline by Rs. 3.2 trillion, which will lead to an overall GDP loss of about Rs. 6 trillion in 2020-21, once the multiplier effects are factored in.6 Added to the lockdown loss, this raises the 2020-21 loss to Rs. 29.3 trillion.
However, the government has made some effort to address this problem. On 25 March the Finance Minister announced the PM Garib Kalyan Yojana (PM-GKY), which was ostensibly valued at Rs. 1.76 trillion. Closer inspection suggests that most of the elements of this package were repackaging of provisions already included in the 2020-21 Budget, and only about Rs. 0.8 trillion was the additionality. Since the budgetary numbers are already factored into the expected (pre-Covid) growth numbers, only the additionality can be considered as a stimulus. Since these expenditures have been made relatively early by government standards, the multiplier will leverage the Rs. 0.8 trillion to Rs. 1.76 trillion in 2020-21.
Then in mid-May, the Finance Minister made a series of announcements covering a wide range of initiatives from stimulus to liquidity support to various reform measures, purportedly adding up to a very impressive figure of Rs. 20.7 trillion (including the PM-GKY numbers). However, the fiscal stimulus component was only Rs. 1.3 trillion in addition to the Rs. 0.8 trillion provided earlier. Even if this entire amount is disbursed in the second quarter of 2020-21, the multiplier inclusive impact will add up to Rs. 2.4 trillion during the year.
Thus, the net negative effect of the lockdown, export slowdown, and the fiscal stimulus provided so far in 2020-21 is estimated to be at least Rs. 25 trillion or a GDP growth rate -12.5% if the government does not increase its expenditure beyond what has been provided so far.
In addition, there will be further residual effects of both the shocks and the stimuli, which will play out in 2021-22 as well. These effects are also not small by any means and work out to minus Rs. 26 trillion. In other words, the growth rate in 2021-22 could well turn out to be very small, maybe even negative depending upon what the government does, despite the favourable base effect. As things stand, and the government retains the 2020-21 expenditure budget for 2021-22 as well, it is likely that 2021-22 will witness a GDP growth rate of -8.8%. This is a frightening thought since it means that the country could experience a full-blown depression – the first in our history as an independent nation.
Trajectory of the economy: A cautionary word
It appears that the government has adopted a wait-and-watch approach in determining its fiscal response to the crisis. While evidence-based policymaking is a good thing and must be encouraged, it is fraught with difficulty in a situation of a sudden and grave crisis. In the first place, the relevant data usually come in with a significant lag, which can delay the response and thereby impose completely avoidable damage to the economy and pain to the people. In the present instance, the quarterly GDP estimate for the 1st quarter of 2020-21 (April-June) will be available only at the end of August. If the government then decides that a major fiscal response is indeed called for, the actual expenditure is unlikely to begin before January 2021. As a result, six valuable months would have been lost.
Moreover, what metric would the government use? Would it be the absolute decline in GDP in the first quarter, the trend in employment, the trend in the growth rate, or something else altogether? The most likely metric, I believe, would be the growth rate. But this would have two serious problems. First, it would delay the response even further. The second is that with a shock of this magnitude, the usual continuity assumptions break down completely, and the GDP growth rate can yo-yo quite dramatically rather than move smoothly in one direction or the other.
In such a situation, it may be better to rely on synthetic estimates based on models to decide on the future course of policy action rather than wait for hard data to become available. An attempt has been made to generate such estimates for the next four years based on a simple dynamic model developed for this purpose. Clearly, the precision of such estimates will not be very good since they cannot take into account all the complex changes that can possibly occur in the future in numerous variables, but they do give a reasonable feel about the trajectory that can be expected.
These estimates have been based on a number of simplifying assumptions, which need to be understood and kept in mind while interpreting them:
- The lockdown will be lifted completely across the country on 1 June 2020, and will not be imposed again.
- Exports will decline by 50% during the first quarter of 2020 and will then recover to the pre-Covid level thereafter and stay at that level for the duration.
- The core growth momentum stays constant at 6% per year over the entire period.
- The regular expenditures of the central and state governments will be maintained at the levels budgeted for 2020-21.
- The additional fiscal stimulus will be limited to what has already been announced by the central government.
The core assumptions (1, 2, and 3) are actually very conservative, and the reality can be much worse. The assumptions on the fiscal stance (4 and 5) enable us to focus attention on these as policy variables for addressing the issue, if the government so decides.
The results of the model are given in Figure 1 below.
Figure 1. GDP trends, 2019-20 to 2023-24
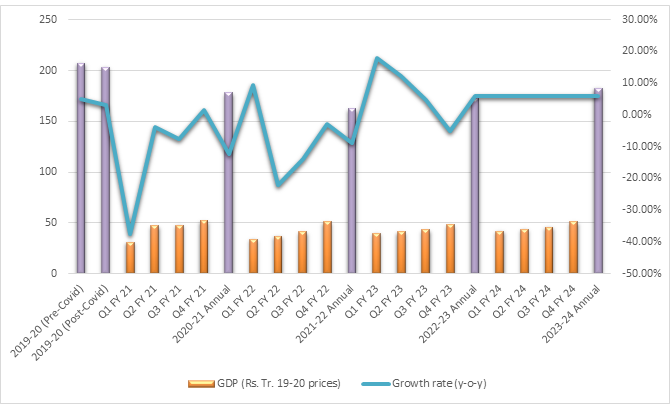
Note: The data on which the graph is based is given in Table 1 in annexure.
The results presented in the figure display a number of very interesting results. First, as has been mentioned before, the view that the Indian economy will recover in 2021-22 is misplaced. Even with favourable assumptions 2021-22 is also likely to show negative growth so that by the end of that year GDP will be 20% lower than 2019-20. Although 2022-23 should show positive growth, this is no cause for the government to go into a self-congratulatory mode. It should be noted that the GDP in this year will continue to be 16% lower than the post-Covid estimates for 2019-20. Even in 2023-24, the GDP will still be roughly 11% lower. At this rate, the 2019-20 GDP will be achieved only in 2025-26.
What is worse, the per capita GDP would be 6% lower in 2025-26 as compared to 2019-20. In other words, if the government feels that it has done enough to tackle the crisis, the country stands to lose six years of GDP and seven years of per-capita GDP growth, with all its attendant costs and hardships. In other words, the likely recovery path is not a V, but an elongated U, maybe even closer to an L.
Second, the quarterly growth performance can be very erratic; swinging from negative to positive, back to negative, and finally to positive. Therefore, using this as a metric to determine policy action could lead to misplaced decisions. The reasons for the erratic behaviour of the growth rate call for some explanation. The principal reason is that the multiplier processes are likely to be very different for the negative shocks arising from the lockdown and export contraction, and the positive shocks from government action. As has been explained in footnote 3, after the initial shock, the subsequent rounds of the multiplier are likely to be reverse S-shaped, which means the negative secondary effects will tend to be back-loaded. The positive multipliers that apply to the fiscal stimulus packages, on the other hand, will display monotonic behaviour and will, therefore, tend to be front-loaded.7
The second reason is that it has been assumed that the lockdown, export contraction, and the first stimulus all occur in the first quarter of 2020-21, while the second stimulus is in the second quarter. This causes discontinuity in the series and thereby creates base effects that are reflected in the growth rates.
A final word of caution is called for at this stage. In an important sense, the trajectory described in the figure, although frightening, is really a best case scenario. Things can get much worse. All the simplifying assumptions made above involve large downside risks. The lockdown may be phased out gradually depending on state government decisions; lockdown may be imposed again if the pandemic spikes up; exports can continue to sink because of global recession; and the core growth momentum of 6% may weaken if investor confidence is impaired. In addition to these, there is one other danger that the government needs to be aware of: the spending capacity of state governments.
The state government expenditure effect arises from our specific form of fiscal federalism. Most people do not realise that states have very little upward flexibility in terms of their expenditures and face what is referred to as a “hard budget constraint”. This means that a state cannot spend more than the sum of their tax receipts and the amount of market borrowings approved by the Centre on their own expenditure heads.8 Despite the fact that states have borne almost the entire cost of dealing with the pandemic, both at the medical and the humanitarian levels, the Centre has approved an increase in the states’ annual borrowing limits for 2020-21 by only 2% of 2019-20 GDP or Rs. 4 trillion. According to the model results, the states will lose Rs. 4.2 trillion in taxes during the course of the year compared to their budget estimates.9 Thus, it is inevitable that all states will have to cut back on their development spending in order to accommodate the costs of disease management and welfare support. As a result, the core growth momentum is bound to be somewhat lower than the assumed 6%.
A bigger problem can occur in 2021-22 if the Centre insists on returning to the FRBM (Fiscal Responsibility and Budget Management Act) -mandated 3% of GDP for state government borrowings. This, taken with the further loss of taxes, will force the states to reduce their expenditure by about Rs. 3.5 trillion compared to 2020-21, which will reduce the GDP by another Rs. 5 trillion after working through the multiplier. As a result, GDP in 2021-22 could end up being Rs. 157.5 trillion as against the Rs. 162.5 shown in Figure 1, which would make the growth rate -12%. Further, a part of this effect will persist in 2022-23 as well, bringing down the GDP for that year to Rs. 167 trillion.
In the next part of the series (to be posted on Sunday, 7 June 2020) Dr Pronab Sen presents a pathway to recovery, focusing on the survival phase. In the immediate context while the lockdown is in place, the two principal imperatives should be survival of those who have lost livelihoods, and of production capacities in non-essentials sectors. An approximate estimate of the additional fiscal support required during this three-month period is Rs. 2 trillion.
Notes:
- There was a demand shock which preceded the lockdown as tourism activity collapsed from early February. This affected only some sectors, such as transport, hotels and restaurants. With the lockdown, all these sectors are included in the supply shock itself.
- An alternative way to assess the damage would be to use the data on employment and an estimate of the productivity of workers. According to the CMIE (Centre for Monitoring Indian Economy) data, over the concerned period, the unemployment rate of non-agricultural workers has increased by 18 percentage points, which translates to 120 million workers. Just going by this, the GDP loss would be closer to Rs. 1.65 trillion per week as compared to the Rs. 2 trillion estimated by the production loss method. This would, however, probably be a serious underestimate since a large number of workers who have not lost their jobs are getting paid without producing (that is, productivity of zero), and most of these would be in the highest productivity bracket. Nevertheless, the interested reader can work out what a scenario based on this approach will yield.
- This is known as the multiplier effect in economics. In the Indian case, the standard multiplier is estimated at around 3. However, in a shock of this magnitude, the multiplier is not a constant figure as it would be under normal circumstances. Initially people would protect their consumption by drawing down their accumulated savings, but once income flows start, savings will get slowly restored. As a result, consumption will increase at a much slower pace than income. This pattern of behaviour will lead to the multiplier being close to 1 initially, then rising steadily beyond its normal value, and then settling back to the normal. As a consequence, after the first round damage, the subsequent damage will be back-loaded. This pattern is built into the computations presented here.
- This loss in March 2020 means that growth rate for the year 2019-20 will have to be scaled back from the estimated 5% to 2.5%.
- Although global growth is expected to be -3%, our major export destinations – USA, Europe and the Middle East – are expected to fare worse. In any case, even when the global economy was growing at +3%, our exports were flat. In April 2020, exports declined by 60% and May is expected to show similar results. Therefore, even if exports go back up to the pre-Covid levels from June onwards, the annual export figure will be lower than the 2019-20 figure by 10%.
- This is based on the 2019-20 export earnings of US$370 billion.
- At this point it should be mentioned that the multipliers that apply to different forms of government expenditures are different. In particular, transfer payments, such as cash transfers, have lower multipliers than government purchases of goods and services, such as public investment or MGNREGA. However, in the model, the higher multiplier has been applied uniformly to all fiscal stimuli without breaking them down into the component parts.
- States actually do spend more than that on Centrally Sponsored Schemes (CSS), which are schemes implemented by states but funded by the Centre. These are also included in state budgets.
- The breakdown of the total economic loss of Rs. 40 trillion from budget assumptions is: about Rs. 4.2 trillion loss in state government taxes, Rs. 3 trillion in central taxes, roughly Rs. 2.5 trillion loss to the gross profits of companies, and the remaining Rs. 30 trillion is the loss to households from wages, salaries and mixed income of the self-employed.
ANNEXURE:
TABLE 1 GDP Trends 2019-20 to 2023-24
|
GDP (Rs. Tr. 19-20 prices) |
Growth rate (year-on-year) |
|
|
2019-20 (Pre-Covid) |
207.1 |
5.0% |
|
2019-20 (Post-Covid) |
203.4 |
3.0 % |
|
Q1 FY 21 |
30.8 |
-37.5% |
|
Q2 FY 21 |
47.2 |
-3.9% |
|
Q3 FY 21 |
47.8 |
-7.5% |
|
Q4 FY 21 |
52.3 |
1.7% |
|
2020-21 Annual |
178.2 |
-12.4% |
|
Q1 FY 22 |
33.7 |
9.5% |
|
Q2 FY 22 |
36.8 |
-22.2% |
|
Q3 FY 22 |
41.2 |
-14.0% |
|
Q4 FY 22 |
51.0 |
-2.8% |
|
2021-22 Annual |
162.5 |
-8.8% |
|
Q1 FY 23 |
39.7 |
17.9% |
|
Q2 FY 23 |
41.3 |
12.4% |
|
Q3 FY 23 |
43.1 |
4.6% |
|
Q4 FY 23 |
48.2 |
-5.2% |
|
2022-23 Annual |
172.3 |
6.0% |
|
Q1 FY 24 |
42.0 |
5.9% |
|
Q2 FY 24 |
43.8 |
6.0% |
|
Q3 FY 24 |
45.7 |
6.0% |
|
Q4 FY 24 |
51.1 |
6.0% |
|
2023-24 Annual |
182.6 |
6.0% |

Comments will be held for moderation. Your contact information will not be made public.