

 02 February, 2021


Swachh Bharat Mission was introduced by Government of India in 2014 to eliminate open defecation. Based on data from the National Family and Health Survey (NFHS)-5 factsheets, this article shows that the sanitation situation has broadly remained the same between NFHS-4 in 2014 and NFHS-5 in 2019. Half of the rural population in the states of Uttar Pradesh, Madhya Pradesh, Bihar, and Rajasthan, continue to defecate in the open.
How much did rural sanitation change under the five years of the Swachh Bharat Mission (SBM)? The best nationally representative statistics on sanitation in India have long come from the Demographic and Health Surveys (DHS), known as the National Family and Health Surveys (NFHS) in India. The fifth round of the NFHS (NFHS-5), conducted in 2019-2020, was interrupted by the Covid-19 pandemic. Hence, there is no independent, high-quality, nationally representative survey of sanitation behaviour collected at the end of Phase 1 (October 2019) of SBM. However, data for some states had been collected before the lockdown. Factsheets of selected summary statistics have been released for those 22 states.1 Unfortunately, the states where data collection was interrupted had higher open defecation (OD) in NFHS-4 than the states where data collection was completed.
In this post, we discuss what the factsheets tell us about OD in rural India. We are particularly interested in the fraction of people who defecate in the open in the rural areas of Bihar, Madhya Pradesh (MP), Rajasthan, and Uttar Pradesh (UP), which we call the ‘focus states’. These states are home to over two-fifths of India’s rural population, and to a little more than half of the rural Indians who reported practicing OD in NFHS-4, which was the prior DHS survey round in 2015-2016. We have undertaken in-depth studies and surveys of rural OD behaviour in these states in our prior research (Coffey et al. 2014, Gupta et al. 2010, Coffey and Spears 2017). Among these focus states, only Bihar has any data released at all under NFHS-5.
NFHS-5 factsheets and open defecation
The NFHS-5 factsheets do not answer every question that we may have about the status of OD in the country. For starters, they do not directly report anything about OD. Instead, they report the fraction of households with improved sanitation.2 One problem with this is that we do not know how many of the households without improved sanitation are defecating in the open or how many are using ‘unimproved’ latrines.3 But this is a small problem, because we can use data from prior NFHS survey rounds to reassure ourselves that unimproved latrines are very uncommon in rural India – people either defecate in the open or use a latrine that counts as ‘improved’ by this standard. To be charitable to SBM, we can assume that it built zero unimproved latrines, so the reduction in OD is the same as the increase in the use of improved latrines.
Another problem is that the NFHS question on OD is asked at the household level and not at the individual level. But we know from other, more detailed surveys that many rural households that have access to improved sanitation have some members who use a latrine and some members who defecate in the open (Coffey et al. 2014, Gupta et al. 2020). In separate studies, we collaborated with several researchers to organise survey experiments in rural Bihar, Odisha, Karnataka, and Gujarat, which compared the NFHS question with an individual-level question about OD. The individual-level question found more OD than the NFHS’s household-level question (Vyas et al. 2019). These findings suggest that there actually is more OD than an estimate based on the NFHS will suggest.
Finally, the NFHS-4 and 5 factsheets have rural summary statistics at the state level, and combined rural and urban summary statistics at the district level. So we know the fraction of all rural Bihar households who have improved sanitation but not the fraction of rural people in any Bihar district who have improved sanitation.
Thus, we use the numbers available to us and do the best we can to update our understanding of sanitation in rural India.
Where data are available, open defecation situation is broadly unchanged between 2015-16 and 2019-20
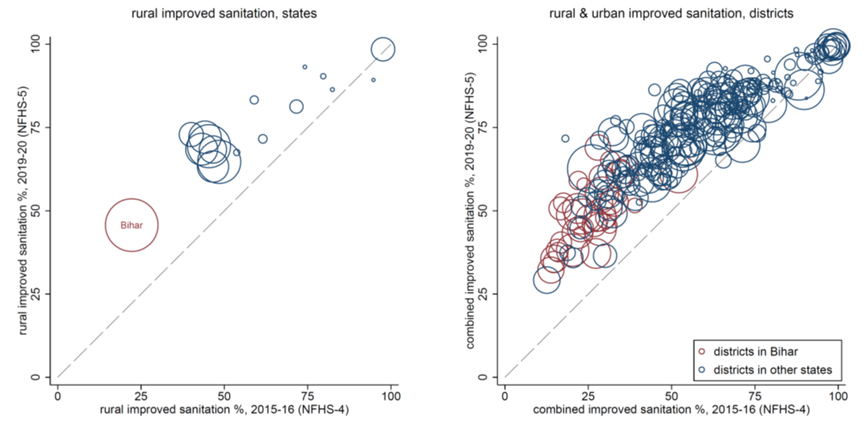
Figure 1 below plots improved sanitation rates in the 2019-20 NFHS-5 factsheets against improved sanitation rates in the 2015-16 NFHS-4 at the state level (left panel) and the district level (right panel). The NFHS-5 data were collected at the end of phase 1 of SBM and the NFHS-4 data were collected before SBM had made large changes (Coffey and Spears 2018), so this graph is informative about before-and-after changes over the course of SBM.
Figure 1. Open defecation in NFHS-5 factsheets and NFHS-4
It was never realistic to expect the SBM to solve every sanitation problem and it would be unreasonable to assess any public policy by such a standard. Yet, in many public discussions, SBM presented a radically transformative account of itself and in its political rhetoric, the Mission claimed for itself the highest benchmarks.
NFHS-5 factsheets, however, show us that sanitation coverage in rural India after SBM has increased but is still sorely in need of further attention. Figure 1 shows meaningful increases in improved sanitation, especially where OD was worse to begin with. The dashed diagonal line represents a scenario of no change in improved sanitation coverage, that is, if 2019 were just like 2015. Most districts are above the line, which means that sanitation coverage improved in most districts. The data show that rural Bihar has improved by over 20 percentage points. Averaging over all of India, improved sanitation increased by 18 percentage points. UNICEF (United Nations International Children's Emergency Fund)-WHO (World Health Organization) data show that countries that had high rates of unimproved sanitation in 2015 tended to subsequently improve by about 1 percentage point per year, so India’s 4-5 percentage points a year is notably faster.
However, on average, places such as Bihar that had worse sanitation before SBM still had worse sanitation, and places that had better sanitation before the SBM, such as in the Northeast, still had better sanitation. Figure 1 does not show an old order swept away by transformative change: It shows that the correlation between sanitation before SBM and after SBM is 91%.
How much open defecation remains in focus states?
To offer any answer to this question we are going to have to make assumptions. Our first assumption is that the change in UP, MP, and Rajasthan since the time of NFHS-4 was similar, on average, to the change in Bihar. One easy answer requires no computation: the factsheets say that 45.7% of rural Bihar has improved sanitation, implying that 54.3% do not. Or, we can do a simple computation:
- In the rural areas of focus states in NFHS-4, OD was 70.2% (Coffey and Spears 2018).
- According to the NFHS-5 factsheets, improved sanitation in rural Bihar increased by 23 percentage points.
- So if we can subtract these statistics, then about half of the rural population in the focus states continued to defecate in the open at the end of SBM.
We write ‘about half’ rather than any particular number to emphasise the imprecision of this estimate. It is not precise, but it is informative. By this computation, around 200 million rural people in the focus states defecate in the open.
In a 2014 study (Coffey et al. 2014), we made a projection about what a large-scale latrine building programme might accomplish. Before SBM, we wrote: “In the four focus states, the model predicts that individual-level OD in our sample would fall from the observed 70% to a predicted 51%. Therefore, we conclude conservatively that our data predict that even if the government were to construct a latrine for every rural household in Bihar, MP, Rajasthan, and UP that does not currently have one, more than half of all rural persons in our sample would still defecate in the open. This is not to suggest that an 18-percentage point decline in OD, if achieved, would not be an important advance in human development. However, even after such an ambitious construction scheme, rural India would still be very far from ending OD.”
We can use the same tool now to try to quantify what did happen. Because the data are incomplete, we have to use models. We follow the three steps below:
- We estimate a simple model for NFHS-5 improved sanitation as a function of NFHS-4 improved sanitation, using all of the places for which NFHS-5 data are available. This assumes that the changes in the places where NFHS-5 data are unavailable are similar to the changes in the places where data are available. This can be done in different ways – at the state or district level, separating or pooling rural and urban, treating Bihar separately or pooling it with the other states.
- For each district, we use NFHS-4 to estimate OD as a function of improved sanitation. This assumes that, although the distribution of sanitation behaviours changed over time, the relationship between improved sanitation and OD stayed constant because unimproved latrines remained uncommon.
- Compute a projected rural OD for each district. Assemble these districts into population-level rural averages using NFHS-4 population weights.
There are multiple ways to perform each of these steps. In order not to make an arbitrary choice, we used 10 different combinations. Our 10 estimates span from a low of 45% of rural residents of the four focus states defecating in the open to a high of 54%. Or, if you prefer, you can use the simpler computation of 70-20≅50. Or, we can stop where we started – at the factsheet statistic that 54% of rural Bihar has unimproved sanitation. With any of these methods, NFHS-5 factsheets suggest that about half of the rural population in the focus states defecated in the open when these data were collected at the end of the SBM Phase 1.
What about the effects of the SBM on health outcomes?
We can say little about the effect of the SBM on sanitation behaviour with these data. We can say even less about subsequent effects on health. In our prior work, we have written about the effects of OD on early life health–effects that are visible in data on child height (Hathi et al. 2017, Spears 2020).
The NFHS-5 factsheets do not include child height-for-age. Instead, they include only rates of ‘stunting’ among children under five years of age, which indicate the proportion of children who are more than two standard deviations4 shorter than the average height of a reference population of healthy children of the same age and gender. In this way, stunting rates are like poverty rates – a large one is bad, but they conceal more than they reveal and they are vulnerable to statistical shenanigans. In one of our research group’s first studies on sanitation, we used DHS data from 2005 to show that dichotomised stunting rates reduce statistical power, meaning they obscure relationships that in fact exist (Spears et al. 2013).
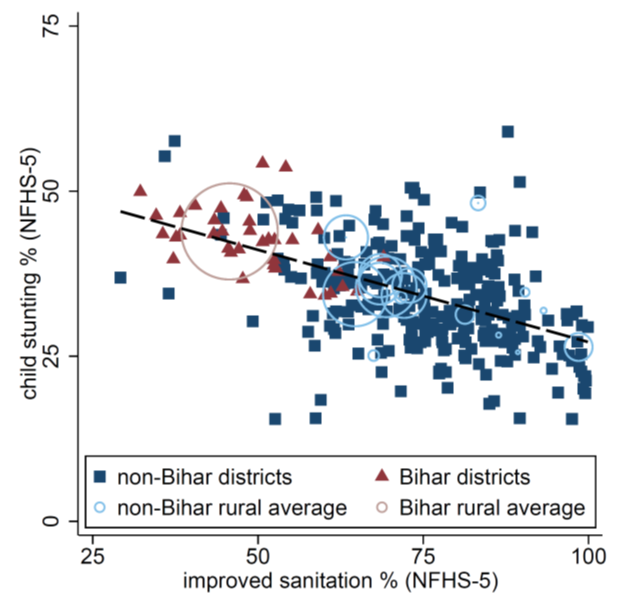
With these caveats, we can see that OD continues to predict child height in NFHS-5 factsheets, as measured by stunting rates. Experts on child nutrition have highlighted concerns and puzzles about the stunting numbers in these factsheets, most notably the deeply worrying fact that there has been so little improvement over time (Rukmini 2020, Drèze 2020). But at least in Figure 2 below there is little to be puzzled about – places with worse sanitation have more stunting, on average. Of course, this one scatterplot should be far from enough to persuade you that sanitation has a causal effect on child height if you did not already find that plausible. Our point is merely that the NFHS-5 summary factsheets – as limited as they are – provide no new reason to be sceptical or to be confident about this relationship. Fully quantifying the consequences of the SBM will require more data.
Figure 2. Child stunting and improved sanitation in Bihar
Notes:
- Factsheets and a list of the 22 states is available at: http://rchiips.org/nfhs/factsheet_NFHS-5.shtml
- According to the WHO, “An improved sanitation facility is one that likely hygienically separates human excreta from human contact. Improved sanitation facilities include:flush or pour-flush to piped sewer system, septic tank or pit latrine, ventilated improved pit latrine, pit latrine with slab and, composting toilet.” Shared facilities are also considered “improved” in this round of the NFHS. For more information, see: https://www.who.int/data/gho/data/indicators/indicator-details/GHO/population-using-improved-sanitation-facilities-(-)
- Unimproved latrines include flush or pour-flush to elsewhere, pit latrine without slab or open pit, bucket, hanging toilet or hanging latrine.
- Standard deviation is a measure that is used to quantify the amount of variation or dispersion of a set of values from the average of that set.
Further Reading
- Coffey, Diane, Aashish Gupta, Payal Hathi, Nidhi Khurana, Nikhil Srivastav, Sangita Vyas and Dean Spears (2014), “Open defecation: evidence from a new survey in rural north India”, Economic and Political Weekly, 49(38): 43-45.
- Coffey, D and D Spears (2017), Where India Goes: Abandoned Toilets, Stunted Development and the Costs of Caste, Harper Collins.
- Coffey, Diane and Dean Spears (2018), “Open defecation in rural India, 2015-2016: Levels and trends in the NFHS-4”, Economic & Political Weekly. Commentary, 53(9): 10-13.
- Coffey, D and D Spears (2019), ‘Child height in India: New data, familiar challenges’, Ideas for India, 11 February.
- Drèze, J (2020), ‘New evidence on child nutrition calls for radical expansion of child development services’, The Indian Express, 17 December.
- Gupta, Aashish, Nidhi Khalid, Devashish Deshpande, Payal Hathi, Avani Kapur, Nikhil Srivastav, Sangita Vyas, Dean Spears and Diane Coffey (2020), “Revisiting Open Defecation: Evidence from a Panel Survey of Rural North India”, Economic and Political Weekly, 55(21): 55.
- Hathi, Payal, Sabrina Haque, Lovey Pant, Diane Coffey, and Dean Spears, "Place and Child Health: The Interaction of Population Density and Sanitation in Developing Countries." Demography, 54(1): 337.
- Indian Institute of Population Sciences (2020), National Family Health Survey – 5, Ministry of Health and Family Welfare, Government of India.
- Rukmini S (2020), “India May Be Reversing Decades Of Progress On Child Nutrition, New Govt Data Show”, IndiaSpend, 13 December.
- Spears, Dean, Arabinda Ghosh and Oliver Cumming (2013), “Open defecation and childhood stunting in India: an ecological analysis of new data from 112 districts”, PloS one, 8(9): e73784.
- Spears, Dean (2020), “Exposure to open defecation can account for the Indian enigma of child height”, Journal of Development Economics, 146(C).
- Vyas, Sangita, Nikhil Srivastav, Divya Mary, Neeta Goel, Sujatha Srinivasan, Ajaykumar Tannirkulam, Radu Ban, Dean Spears and Diane Coffey (2019), “Measuring open defecation in India using survey questions: Evidence from a randomized survey experiment”, BMJ Open, 9:e030152.

Comments will be held for moderation. Your contact information will not be made public.