Industries are one of the most significant contributors to energy-related carbon-dioxide (energy-CO2) emissions in India – the share of industries in the total emissions was 25%, second only to power generation. In this post, Manisha Jain examines the trends, and differences in the two data sources on manufacturing emissions in India – International Energy Agency estimates, and country-level data reported by the central government to the United Nations Framework Convention on Climate Change.
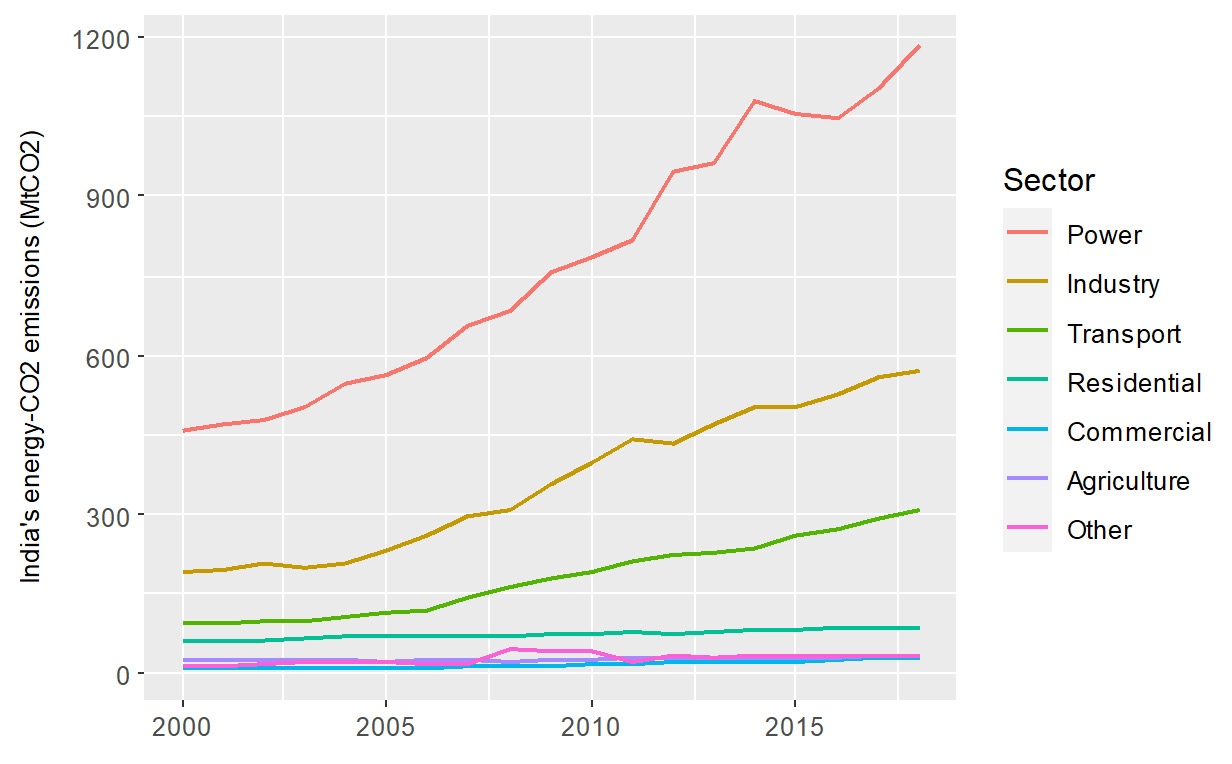
Data on energy use and associated emissions are necessary to design climate change-mitigation solutions and track progress. Industries are significant contributors to energy-related CO2 (energy-CO2) emissions. The share of emissions from industries in total emissions is second only to the emissions from power generation. As per International Energy Agency (IEA) estimates, India’s total emissions from energy use in 2018 were 2,251 MtCO2 (metric tons of carbon-dioxide). The share of power generation and industries in the total emissions was 53% and 25%, respectively. This was followed by transport and residential sources with shares of 14% and 4%, respectively, in the total emissions. Other sectors including agriculture, and commercial sources contributed the remaining 4% emissions.
Figure 1. Sector-wise trends in CO2 emissions from energy use (energy-CO2 emissions) in India
The nationally reported source of India's emissions disaggregated by the industrial sector is its communications to the United Nations Framework Convention on Climate Change (UNFCCC). These GHG (greenhouse gases) emissions inventories developed by national governments are referred to as ‘country data’. On the other hand, the most widely used data source globally of India's energy-CO2 emissions is the energy balances data from the International Energy Agency (IEA).
In a previous post on Ideas for India (Jain 2021), I reported differences in IEA data and India's country data – I showed that emissions from power generation and transport are similar in the two datasets. However, manufacturing and construction sector emissions were higher in IEA data than country data. I also showed how this difference results in different narratives on India's industrial emissions intensity and the effectiveness of industrial energy efficiency policies. In this post, I examine the differences in the estimates of emissions, from different components within manufacturing.
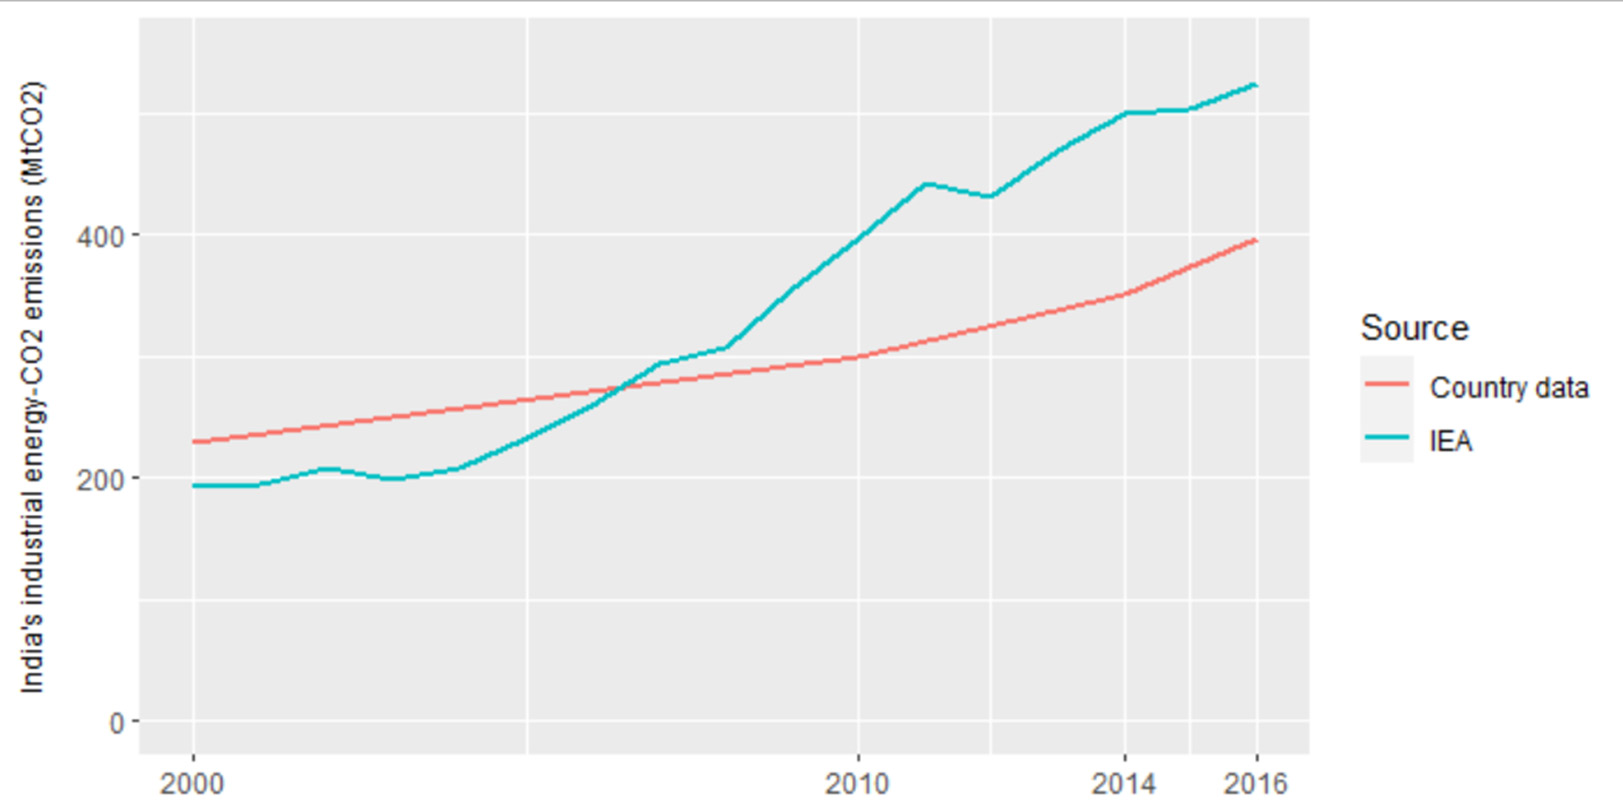
Figure 2 shows the industrial CO2 emissions from the two data sources during 2000-19. Emissions from country data are available for 2000, 2010, 2014, and 2016, and that from IEA data is available for all years. In this post, I compare India's energy-CO2 emissions by industry, under the mining, manufacturing and construction sector in IEA and country data, and identify the source of differences in these two datasets.
Figure 2. India's energy-CO2 emissions from mining, manufacturing and construction sectors
Industry classification for reporting energy-CO2 emissions
I first discuss the industry classifications used for reporting emissions in the two data sources. I observe a few differences in the industry classification. I map the industries in the two datasets for comparison and divide the industries into high and low carbon-intensive industries and analyse the differences in the two datasets.
IEA reports industry emissions as per the International Standard Industrial Classification of all Economic Activities (ISIC) (Table 1). However, India's GHG emissions inventory reported by the government classifies industries somewhat differently. Country data report emissions under iron and steel, non-ferrous metals, mining, and textile and leather, as per the ISIC. As per the ISIC, cement should be included in non-metallic minerals, and fertilisers in chemicals. However, the country data reports cement and non-metallic minerals emissions separately. Similarly, emissions from chemicals and fertilisers are also reported separately. Emissions from transport equipment, machinery, wood and wood products, and construction are not reported in country data. Instead, the bricks and engineering sector emissions are reported – two categories not part of the ISIC. Further, it is unclear if the emissions reported under food and beverages include tobacco, and that from pulp and paper includes print.
Table 1. Industry classification as per IPCC guidelines and followed in IEA energy statistics
|
Manufacturing industries and construction |
|||||
|
Iron and steel |
vi) |
Non-metallic minerals |
xi) |
Construction |
|
|
Non-ferrous metals |
vii) |
Transport equipment |
xii) |
Textile and leather |
|
|
Chemicals |
viii) |
Machinery |
xiii) |
Non-specified Industry |
|
|
Pulp, paper and print |
ix) |
Mining (excluding fuels) and quarrying |
|||
|
Food processing, beverages, and tobacco |
x) |
Wood and wood Products |
|||
Table 2. Industry classification in India's GHG emissions inventory submitted to UNFCCC (or ‘country data’)
|
Manufacturing industries and construction |
||
|
a. Cement |
f. Food and beverages |
j. Bricks |
|
b. Iron and steel |
g. Non-metallic minerals |
k. Fertiliser |
|
c. Non-ferrous metals |
h. Mining and quarrying |
l. Engineering sector |
|
d. Chemicals |
i. Textile/leather |
m. Non-specific Industries |
|
e. Pulp & paper |
||
Energy-CO2 emissions data
I estimate energy-CO2 emissions in industries from the IEA using the World Energy Statistics. IEA's energy statistics provide the quantity of fuel used in each sector and the calorific value of the fuels. I use IEA calorific values and IPCC default emission factors to estimate the emissions from the fuels consumed in each industry. The GHG emissions inventory in country data does not provide data on fuels used, and only provides direct estimates of emissions. I construct country data from the national communications and biennial update reports submitted by the Government of India to the UNFCCC.1
Since the emissions from the two sources are reported somewhat differently, it is essential to map the categories in the two data sources. I account for emissions from iron and steel, non-ferrous metals, mining, textile and leather, and paper, pulp and printing, as per the ISIC. I add emissions from cement and bricks to non-metallic minerals, and fertilisers to chemicals and petrochemicals. I also exclude construction and machinery as the corresponding data is not available in country data and I exclude food and beverages due to a data anomaly in country-data in 2000. The emissions from these sectors are not significant and hence their omission does not cause any bias in the analysis.
Trends in energy-CO2 emissions from IEA and country data
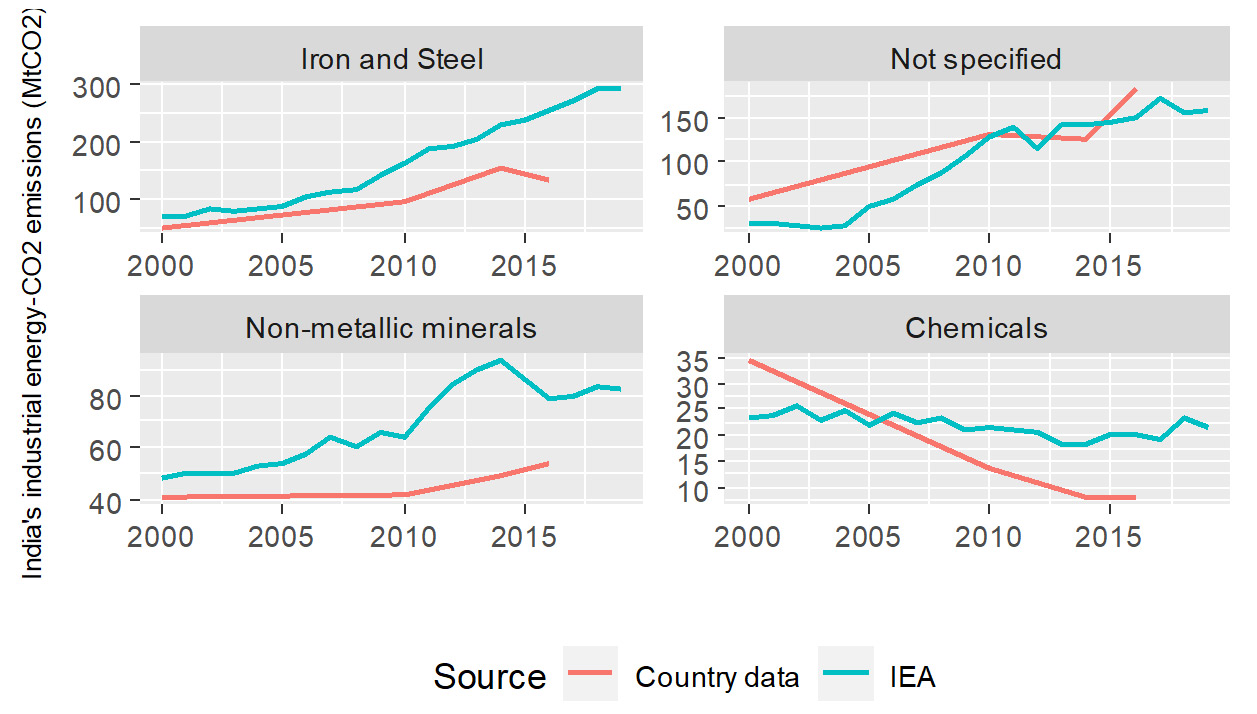
The estimates of emissions, from the two sources, from high carbon-intensive industries are shown in Figure 3. The most carbon-intensive industry is iron and steel, followed by non-metallic minerals and chemicals and petrochemicals. However, a very high share of emissions is from industries that fall under the “Not specified” category. The emission from iron and steel consistently increases in IEA data. However, country data show a decline in 2016 compared to 2014. Also, the divergence between the two datasets increases from 2000 to 2016. The two datasets' estimates of emissions from non-metallic minerals and chemicals differ considerably. However, the emissions under “Not specified” are a crucial black box in the figure.
Figure 3. Emissions from high carbon-intensive industries in India from country and IEA data
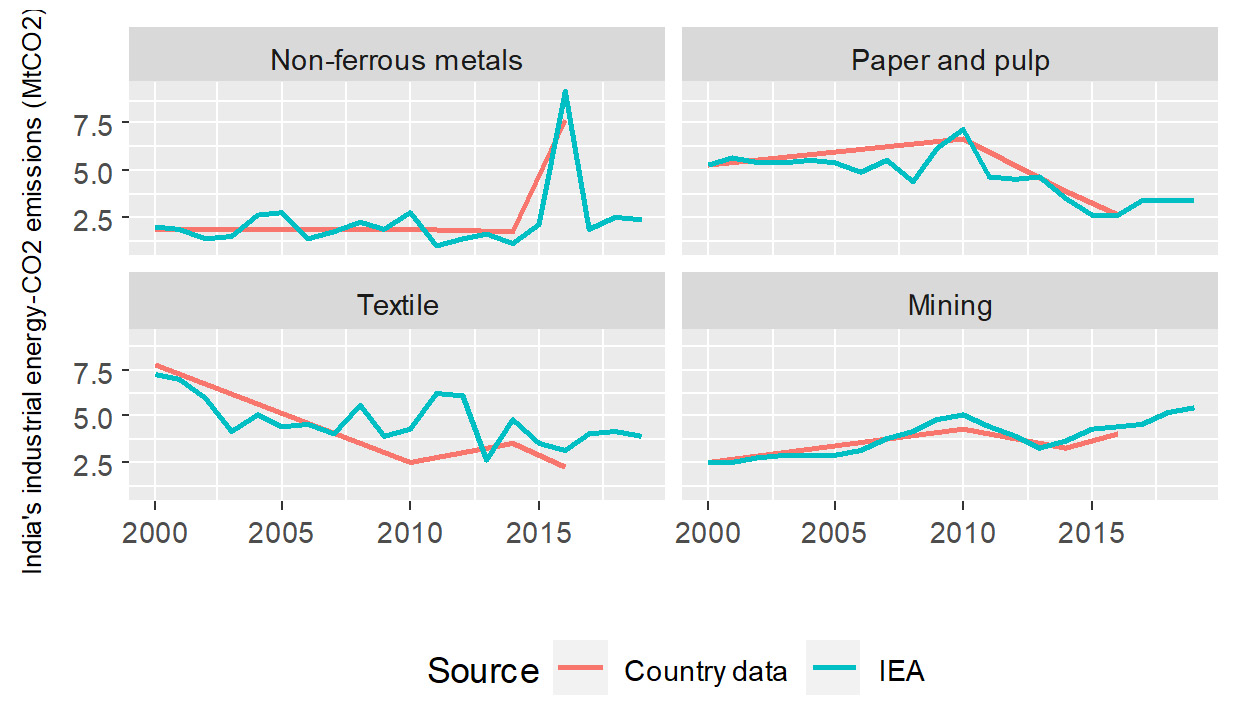
The emissions from less carbon-intensive industries are shown in Figure 4. The figure clearly indicates that the estimates of emissions of all the four sectors from the two datasets follow a somewhat similar trend. The emissions from non-ferrous metals remain unchanged during the entire period except for a spike in 2016. The emissions from paper and pulp start declining after a peak in 2010. The emissions from textile also decline in both datasets, although at different rates. The emissions from mining rise similarly in both datasets.
Figure 4. Emissions from low carbon-intensive industries in India from country and IEA data
Differences in the country data and IEA estimates: Who is getting it wrong?
The estimates of emissions from country data are lower than IEA data. The question that arises is that: Which of these estimates are correct? One of the potential ways to check if the country data is derived accurately is to estimate emissions from national energy balances. India's energy data by the industrial sector is reported in the national energy balances published by the Ministry of Statistics and Programme Implementation (MOSPI) annually (MOSPI, 2021). However, there are two issues with MOSPI's energy balances that limit its usability. First, the energy derived from coal is overestimated, and industries' disaggregation of energy use is incomplete. MOSPI's energy balances assume a higher calorific value for Indian coal, thereby overestimating the energy derived from coal. Second, around three-fourths of the energy used in industries is reported in the “Not-specified” industry category. Hence, it is not possible to calculate the emissions, by industry, using national energy data.
There are few independent estimates of India's emissions from industries. A recent TERI (The Energy and Resources Institute) report estimates the emissions from iron and steel to be 242 MtCO2 in 2016 (Hall 2020). The corresponding values in country data is 135 MtCO2 and 255 MtCO2 in IEA data. In another study on energy efficiency on India's iron and steel industry, the emissions reported for the year 2007 is 117 MtCO2, a value similar to the estimates from IEA data (Krishnan 2013). GHG Platform India’s estimates of emissions from iron and steel were 223 in 2013 (Gupta 2017). These independent estimates are closer to the IEA estimates than country data. All this points to emissions in the country data being lower than the emissions reported elsewhere.
Comparing industry emissions from country data and IEA data brings out an urgent need to examine the methodology for estimating emissions from high carbon-intensive industries such as iron and steel, non-metallic minerals, and chemicals. Given my findings in this post, it is clear that India should invest in developing and publishing the national energy balances. A coordinated effort to publish the national energy statistics can prove beneficial for national reporting and facilitate research in the energy sector's transition to meet climate change-mitigation challenges.
Note:
- I use reports from 2004, 2012, 2015, and 2021 to construct these data.
Further Reading
- Government of India (GOI) (2004), ‘Initial National Communication to the United Nations Framework Convention on Climate Change’, Ministry of Environment and Forests.
- GOI (2012), ‘Second National Communication to the United Nations Framework Convention on Climate Change’, Ministry of Environment and Forests.
- GOI (2015), ‘First Biennial Update Report to the United Nations Framework Convention on Climate Change’, Ministry of Environment and Forests.
- GOI (2018), ‘Second Biennial Update Report to the United Nations Framework Convention on Climate Change’, Ministry of Environment and Forests.
- GOI (2021), ‘Third Biennial Update Report to the United Nations Framework Convention on Climate Change’, Ministry of Environment and Forests.
- Gupta, V, T Biswas and K Ganesan (2017), ‘Industrial Emissions State Level (Ver 1.0)’, CEEW (Council on Energy, Environment and Water) Report.
- Hall W, T Spencer and S Kumar, ‘Towards a Low Carbon Steel Sector Overview of the Changing Market, Technology, and Policy Context for Indian Steel’, TERI, SHAKTI, and Energy Transmissions Commission Report.
- Jain, M (2021), ‘India’s progress in meeting its climate goals’, Ideas for India, 22 April 2021.
- Krishnan, SS, V Vunnam, PS Sunder, JV Sunil and AM Ramakrishnan (2013), ‘A Study of Energy Efficiency in the Indian Iron and Steel Industry’, Center for Study of Science, Technology and Policy (STEP) and SHAKTI Report.
- MOSPI (2021), ‘Energy Statistics 2021’, Report. Available here.


 02 May, 2022


By: Karthik 22 December, 2023
Hi Manisha I have been tasked to write an article about decarbonization of India's industrial sector. So for my case I wanted to first know what the total emissions and which sub divisions are emitting how much. To my horror, I have found same type of discrepancies! Not just that there are classification differences, absence of accounting for other GHGs, all these factors make discerning data nearly impossible at best.