

 04 June, 2019


It is widely agreed that China has grown much faster than India, and that India has finally taken over in recent years. In this piece, Martin Rama benchmarks the growth performances of the two countries in ‘development time’ rather than ‘chronological time’ – and puts forth the possibility that for a quarter of a century India outperformed China in terms of economic growth and is starting to lag now.
There is ample consensus that China has grown much faster than India, a comparison that is a source of considerable anguish and soul-searching among Indian leaders. There is also agreement that over the last few years India has finally taken over in terms of economic growth, raising the prospect of an eventual catch-up.
However, both propositions are arguably wrong, and the opposite could be true. Here I want to entertain the possibility that for a quarter of a century India has outperformed China in terms of economic growth but is now starting to lag. And this could be the real reason for concern.
I realise that this possibility may sound unlikely, and at odds with widely known and undisputed evidence. After all, in 1990, China’s Gross Domestic Product (GDP) per capita reached only US$348, below India’s US$364, whereas in 2017 the corresponding figures were US$8,838 and US$1,940. So, on the surface there is no argument.
While these numbers are uncontroversial, a proper comparison needs to pay attention to the period of reference. The consensus comparison is in terms of “chronological time” but, to use the terminology of the latest Economic Survey of India, it may be more relevant to think in terms of “development time”.
The history of Asian economic growth is rich in dramatic turnarounds. For example, in 1868 the Meiji led Japan to open to the outside world, and in 1986 Doi Moi marked Vietnam’s shift from central planning to a market-oriented economy. China and India also experienced such turnarounds in recent history. Which is why rather than comparing how countries are doing today it may make sense to assess how well they performed after they embraced a new economic mindset.
For several decades after World War II both China and India were poor and slow-growing socialist economies. Their governments professed deep scepticism about market mechanisms, relying instead on State ownership, trade barriers, and price controls. In China, the attitude toward markets changed dramatically in 1978, when a series of far-reaching reforms were initiated under the leadership of Deng Xiao Ping. In India, the economic liberalisation process launched in the year 1991 by Prime Minister Narasimha Rao may represent a comparable turning point.1
The years just preceding these shifts toward market mechanisms are arguably the “time zero” of modern economic development in each of the two countries. Since that time zero, 40 years have elapsed in China and 28 in India. The relevant question is thus: how does India today compare to China at a similar stage in reform process? Comparisons of this sort have been applied to other pairs of countries.2 But to my knowledge a benchmarking of growth performances in development time has not been attempted in connection with the China-versus-India debate.
The standard metric: GDP per capita
Economic performance can be assessed along multiple dimensions. Human capital, access to basic services, voice in collective decision-making, are among the metrics that could be used to compare how well China and India have done since the beginning of their reform processes. However, multi-dimensional approaches make comparisons more difficult. Instead, the focus here is on living standards, not on its various components.
The most standard measure of living standards is GDP per capita. And the most recent data point available for India is for 2017, 27 years after time zero. A comparison in development time requires looking at China not in 2017 but in 2004, a quarter of a century after Deng Xiao Ping launched the reform process. A problem in this respect is that 2004 dollars were worth more than 2017 dollars. Therefore, the comparison first requires converting current dollars into constant dollars. The increase in consumer prices in the US can be used to this effect, as it provides a measure of the dollar’s loss of value. The year 2011 is chosen as the base for this conversion.
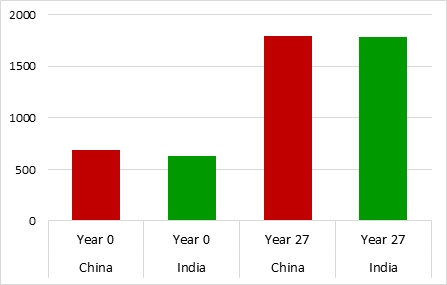
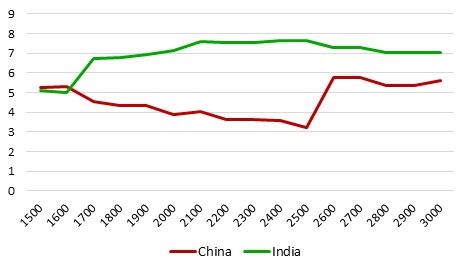
Measured in constant dollars of 2011, China’s GDP per capita in 2004 was US$1,797. This is almost exactly the same as India’s GDP per capita in 2017 (US$1,780; also measured in constant dollars of 2011). Seen this way, both countries were doing equally well 27 years after the beginning of their respective reform processes (Figure 1a). Interestingly, India was poorer than China at time zero. Its GDP per capita in 1990 was US$627, compared to US$687 for China.
In the growth literature, GDP per capita is often measured in Purchasing Power Parity (PPP) to ensure greater comparability across countries. Conceptually, computing GDP in PPP terms amounts to multiplying the quantities of goods and services produced in a country by the prices these goods and services would have in the US. Prices in developing countries tend to be lower than in the US, especially for services. As a result, the GDP per capita of countries like China and India is lower when measured in constant dollars than when measured in constant PPP dollars.
The most commonly used GDP per capita figures in constant PPP terms come from the Penn World Tables and the Maddison Project (See Feenstra et al. 2015 for the Penn World Tables, and Bolt et al. 2018 for the Maddison Project). Data are expressed in 2011 dollars and are very similar across the two sources. But data from the Maddison Project are used in what follows because they extend until 2016, whereas the Penn World Tables stop in 2014.
Figure 1. GDP per capita in China and India
a. Constant dollars
b. Constant PPP dollars
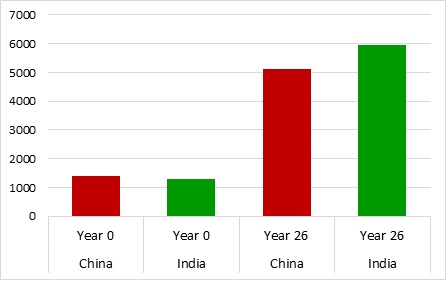
Note: Dollar figures are at 2011 prices. ”Year” refers to the time into the reform process, with Year 1 being 1978 in China and 1991 in India.
Source: World Development Indicators (World Bank); National Bureau of Statistics of China; and Maddison Project Database.
In 2016, which corresponds to year 26 since the beginning of reforms, India’s GDP per capita in constant PPP terms was US$5,961. The corresponding figure for China in 2013, 26 years after time zero, was a substantially lower US$5,122 (Figure 1b). But the starting point was similar for both countries. China’s GDP per capita in constant PPP terms was US$1,412 in 1977, while India’s reached a more modest US$1,283 in 1990.
In sum, if GDP per capita is used as the yardstick for economic progress, during the first quarter of a century since the beginning of their reform process, India did was as well as China, if not better. And the conclusion is the same when measuring GDP per capita in constant dollars as it is when using constant PPP dollars.
How robust is the comparison?
The proposed comparison of growth performances could be challenged on several grounds. One of them is that India started its reforms much later than China. Late-comers to development have a greater advantage, because their distance to the frontier is bigger and therefore they have more opportunities to catch up. In other words, India would have done better than China mainly because it was more backward to begin with.
While this remark is correct, it is worth noting that the advantage enjoyed by India at the beginning of its reform process was not substantial. In 1977, China’s GDP per capita measured in constant PPP terms was 5% of that of the US; the corresponding ratio for India in 1990 was 3.5%. It is difficult to believe that from a catch-up perspective a 96.5% distance to the frontier is fundamentally different from a 95% distance.
Furthermore, the difference in starting points relative to the frontier did not last for too long. This can be seen by computing the ratios of GDP per capita in China and India to that of the US on annual basis and comparing their averages over two sub-periods of equal length. Again, figures in constant PPP dollars are used for this exercise.
In the first 13 years after the beginning of reforms, China’s GDP per capita was on average 6.4% of that of the US, while that of India was a more modest 4.2%. But over the next 13 years the average was almost identical, at 8.6% and 8.4% respectively. If lagging by a greater margin might have conferred an advantage to India for some time, the advantage did not last for too long. The initial difference in distances to the frontier is thus unlikely to undermine the proposed comparison of growth performances in development time.
Another potential reason to dismiss the proposed comparison is the difference in the external conditions faced by the two countries over the first quarter of a century since the beginning of their reforms. But if anything, the difference in the global environment strengthens the conclusion that India did as well as China, or even better. Indeed, China enjoyed a period of unprecedented global growth and globalisation after it started its reforms, whereas India had to cope with the global financial crisis.
One way to assess the external environment faced by the two countries is to compute the growth rate of GDP per capita in the US (a key destination for their exports of goods and services) during the two 27-year periods. From 1977 to 2004, the annual growth rate of the US in constant PPP dollars was 2%, but from 1990 to 2017 it was a much more modest 1.4%. This makes it difficult to attribute India’s performance to a more conducive external environment.
A final challenge to the comparison in development time relates to the choice of time zero. Few would dispute that China’s economic reforms started in 1978, but there is less of a consensus in India’s case. For example, it has been argued that 1991 does not represent a clear breaking point for the GDP per capita time series, and that growth in India had been on an upward trend from one decade to the next. If there was a structural break in the series, it happened a decade earlier (Rodrik and Subramanian 2005).
From a policy perspective, the reforms enacted until the 1980s were too minimal to result in a freer business environment. However, more significant deregulation measures were adopted by Rajiv Gandhi, who was Prime Minister between 1984 and 1989. They included the broad-banding of licenses by allowing firms to switch between similar product lines, the delicensing of 30 industries, some relaxation of capacity constraints for larger firms, and raising of the ceiling on the asset size in plant and machinery of small-scale enterprises.3
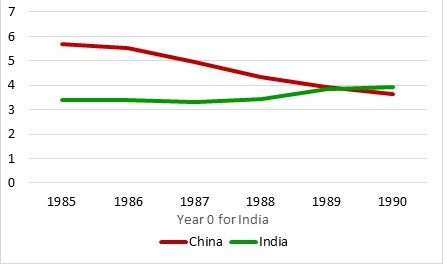
The question is thus whether the results above would hold if other, equally defensive starting points for the comparison in development time were chosen. One practical way to answer this question is to keep 1977 as the year zero in China’s case, but to allow India’s year zero to vary between 1985 and 1990.
Pushing the beginning of reforms back by five years allows for a performance comparison spanning 32 years for GDP per capita in constant dollars, or 31 years for GDP per capita in constant PPP terms. In India’s case, all years for which data are available are considered. In China’s case, the relevant period is from 1977 to 2009 in constant dollars, and from 1977 to 2008 in constant PPP dollars. But this extension of the comparison period may lead to an overestimation of China’s performance, as its GDP growth rates from 2008 onwards might have been overstated by around 1.7 percentage points per year.4 This apparent China advantage needs to be kept in mind when comparing the growth rates of the two countries over this extended time frame.
With this caveat in mind, India still seems to perform roughly as well as China even if the beginning of reforms is advanced by a few years. China’s GDP per capita growth is faster when measured in constant dollars (Figure 2a). But India’s growth is faster when constant PPP dollars are considered (Figure 2b).
A different way to address the uncertainty on the real timing of the beginning of reforms in India is to choose as the starting point for the comparison the year when GDP per capita reaches some arbitrary level for the first time.5
For example, China’s GDP per capita exceeded US$2,500 in constant PPP terms for the first time in 1987 and India first crossed that threshold in 2004. It is thus possible to compare the average growth rates of the two countries in the years that followed. Given that data in constant PPP dollars are only available until 2016, growth in India can only be assessed over a period of 12 years. To ensure comparability, growth in China also needs to be computed for the first 12 years following 1987. This procedure can be repeated with multiple thresholds, to see whether the results remain consistent.
Figure 2. Annual growth rates of China and India since the beginning of reforms
a. GDP per capita in constant dollars
b. GDP per capita in constant PPP dollars
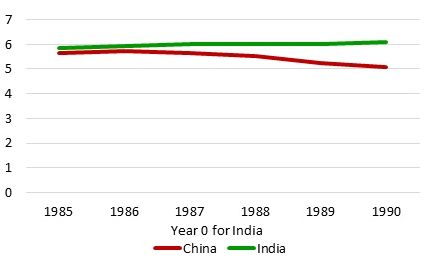
Notes: Dollar figures are at 2011 prices. “Year 0” for China is 1977.
Sources: World Development Indicators (World Bank); National Bureau of Statistics of China; and Maddison Project Database.
Data in constant PPP dollars is better suited to implementing this approach than data in constant dollars. Following the 1991 reforms, India experienced a sharp depreciation of the Rupee, followed by a subsequent catch-up in domestic prices. China, in turn, had a tightly controlled exchange rate policy for long, to ensure the competitiveness of its exports and the stability of its economy. Exchange rate misalignments introduce noise in comparisons of growth performances that involve relatively short periods of time, as may be the case with some of the potential thresholds in GDP per capita.
Another practical difficulty to consider stems from the relative prosperity of China and India at earlier stages in their history. For example, according to data from the Maddison Project, China’s GDP per capita exceeded US$1,000 in constant PPP terms for the first time in 1936, then again in 1953, and several more times before the beginning of reforms. India was above that threshold during the 17th and 18th centuries, and after a period of relative decline, it crossed it again in 1885.
In light of these long periods of relative stagnation, a comparison that picks up the first time a threshold is crossed could be misleading. The comparison is therefore restricted to threshold crossings happening after 1977, the time zero of economic reform in China. And the results confirm that regardless of the income threshold chosen, India did as well as China, or even better (Figure 3). Given this robustness of the results, in what follows 1991 is retained as the beginning of reforms in India’s case.
Figure 3. Annual growth rates after crossing selected GDP per capita thresholds
Notes: Thresholds and growth rates refer to GDP per capita in constant PPP dollars at 2011 prices. Growth rates are computed over the maximum number of years after crossing the threshold for which data is available for both countries.
Source: Maddison Project Database.
The ‘constant prices’ fallacy
Very few economists and commentators have even entertained the possibility of India doing as well as China. Most comparisons, however, focus on the growth rates of GDP per capita measured in constant local currency. And by this metric, the conclusion that China’s economic performance was superior to India’s seems justified. Indeed, in constant local currency China’s GDP per capita grew on average by 8.4% per year during the first 27 years since the beginning of reforms, while India’s GDP per capita grew by ‘only’ 4.9% per year (Figure 4).
Figure 4. Annual growth rates of GDP per capita in China and India
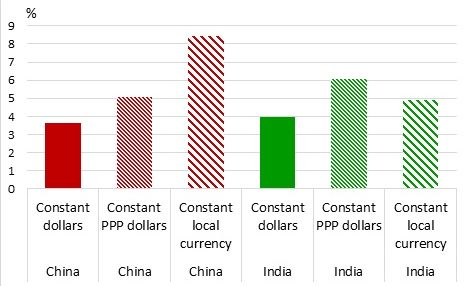
Note: Growth rates in constant dollars and in constant local currency are computed over a period of 27 years into the reform process, whereas growth rates in constant PPP dollars are for a period of 26 years.
Sources: World Development Indicators (World Bank); National Bureau of Statistics of China; and Maddison Project.
However, despite being very telling when conducting short-term macroeconomic analyses, this other metric is not so informative when assessing economic development over longer periods of time. Computing GDP in constant local currency amounts to always multiplying the quantities of goods and services produced in a country by their local prices in the base year. Because these prices do not change over time, the ‘weight’ of these goods and services in total output does not change either. And because prices are kept constant, changes in the value of what is being produced are ignored. But long-term development is about structural change and moving up the value-added ladder.
GDP measured in constant dollars, on the other hand, is computed by first multiplying the quantities of goods and services produced in a country by their current prices (which vary from year to year), then dividing by the exchange rate (which also varies over time) and then finally dividing by the consumer price index of the US (which varies too). With this arithmetic, the individual prices of goods and services measured in constant dollars may increase or decrease from one year to the next. And the weights of the different goods and services changes along the way.
For example, toys produced at steadily lower cost become cheaper in dollar terms, whereas software incorporating increasingly greater value added becomes more expensive. GDP measured in constant dollar terms captures these changes, whereas GDP measured in constant local currency does not. As a result, a country specialising in the production of toys would have a lower growth rate in constant dollars than in constant local currency. And the opposite would be true of a country specialising in the production of software.
Measuring GDP in constant PPP dollars, in turn, amounts to multiplying the quantities of goods and services produced by the prices these goods and services would have in the US in the base year. Changes in the value of goods and services are thus ignored in this case, because prices are kept at their level of the base year. But the weight of individual goods and services in total output is different from the weight they get when measuring GDP in constant local currency.
Consider an economy with only two sectors: services, and the rest. Goods produced by the rest of the economy, including agricultural and manufacturing products, can be traded internationally and therefore their prices tend to be similar across countries. Services, on the other hand, are much less traded internationally, and price differences across countries can be huge. For example, a haircut or a private math lesson costs much more in the US than in China or in India. GDP measured in constant PPP dollars thus gives more weight to the services sector than GDP measured in constant local currency.
As countries develop, their services become increasingly expensive – a transformation known as the Balassa-Samuelson effect – and the share of the services sector in the economy increases. The structure of their economies thus becomes more similar over time to that implied by the measurement of GDP in constant PPP dollars. However, the speed at which the share of the services sector expands varies across countries. A country whose growth is driven by manufacturing has a lower growth rate in constant PPP dollars than in constant local currency. And the opposite is true for a country whose growth is driven by the services sector.
As a result of structural transformation and changes in relative prices, it is generally not possible to obtain the GDP per capita observed in year 27 (or in year 26) by applying growth rates measured in constant local currency to the GDP per capita observed in year zero.
For example, in 1977 China’s GDP per capita measured in constant dollars was US$687. If the growth rate of GDP per capita had indeed been 8.4% per year, then in 2004 its GDP per capita should have reached US$6,088. But this is more than thrice the actual figure of US$1,797. Similarly, with a GDP per capita of US$ 627 in 1990 and an annual growth rate of 4.9%, India should have attained a GDP per capita of US$2,295 in 2017. But this is substantially higher than the actual US$1,780.
Relying on GDP per capita in constant dollars or in constant PPP dollars is thus a preferable choice. And by these measures India outperformed China during the first quarter of a century since the beginning of economic reforms. In constant dollars, the annual growth rate of China’s GDP per capita over the first 27 years was 3.6%, compared to 3.9% for India. In constant PPP dollars, over the first 26 years, China’s annual growth rate was 5.1%, while India’s reached 6.1%.
An alternative metric: The poverty rate
Admittedly, these numbers may be confusing, and I understand that scepticism may still prevail. But another, completely independent metric can be used to compare the performance of the two countries. The poverty rate is this other metric. Indeed, economic growth matters because it leads to improved living standards for the population. From that point of view, the poverty rate is as defensible as a synthetic gauge of prosperity as GDP per capita.
The poverty rate measures the fraction of the population whose daily consumption expenditures fall below a certain threshold. The threshold is known as the poverty line. The World Bank uses the same threshold across countries to facilitate international comparisons. Nowadays its benchmark poverty line is set at US$1.90 per day (and again, these are constant PPP dollars at 2011 prices) (Ferreira et al. 2016).
Computing which fraction of a country’s population lives below this benchmark poverty line involves using exchange rates, as well as adjusting for the varying purchasing power of dollars across countries. But the estimation is firmly grounded on the ability of local households to afford a minimum consumption basket consisting of food and basic non-food items. Also, the computation of household expenditures and the poverty line is done on the basis of household surveys which are quite far removed from the national account systems that produce GDP data.
Poverty rates thus provide a measure of living standards that is both reliable and largely independent from the GDP per capita measure. And by this metric, India had higher living standards than China over the first quarter of a century since the beginning of economic reforms (Figure 5).
Figure 5. Poverty rates in China and India
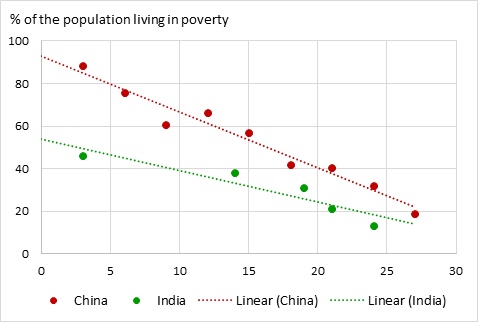
Notes: “Living in poverty” is defined as having daily consumption expenditures below US$1.90 in constant PPP terms at 2011 prices. The horizontal axis indicates the time into the reform process, with year 1 being 1978 in China and 1991 in India.
Source: Povcalnet (World Bank).
It could be argued that while the poverty rate was consistently lower in India than in China during this period, the speed of poverty reduction was faster in China.6 A quarter of a century after the beginning of reforms the poverty rates of the two countries were indeed converging. But this kind of convergence can be expected as countries reach middle-income status, and the fraction of the population living with less than US$1.90 per day falls into the single digits.
In fact, the ratio between the poverty rates of the two countries has been stable, or even widened. For example, in year 4 after the beginning of the reforms the poverty rate of China was 88.3%, roughly twice India’s 45.9%. And the ratio was almost identical by year 22, when China’s poverty rate was 40.5 and that of India was 21.2. However, by year 24 China’s poverty rate was more than 2.5 times that of India.
India’s advantage could be wider than this comparison suggests, for two reasons.7 First, household expenditure surveys around the world fail to capture all private consumption as measured by national accounts, but the gap is unusually large in India. Most of the consumption that is unaccounted for is typically by households which are not poor – but not all of it, which means that many Indian households counted as poor could actually be above the poverty line.
And second, the way households are asked about their consumption expenditures matters. For food-related consumption it may make sense to ask about expenditures over the previous week. But for the purchase of appliances and other durable goods the previous year may be a more sensible reference period. The recall method used by India to compute household expenditures can (and will soon) be improved, and as a result household surveys will capture more household spending than they currently do. For example, with this more reliable recall method, India’s poverty rate in 2011-12 would have been 12.4%, instead of 21.2% (See World Bank (2016), in particular page 49).
The challenge ahead
Perhaps some readers may by now be willing to entertain the possibility that India has outperformed China. Or at least, they may not consider it preposterous anymore. But this claim still goes against deeply engrained views. And an obvious question is: if true, how come? After all, did not China have a stronger starting point thanks to its much better human capital indicators when reforms began? Also, is not the much higher investment rate a State-led economy can mobilise a guarantee of faster economic growth? And is not India’s democracy acting as a tax on the poor, by creating costly delays in decision-making?
The point of this piece is not to discuss the key drivers of performance in the two countries, as this would be far too ambitious. The only objective is to clarify what performance indicators actually show. But, without entering this debate, it is worth pointing out that India outperforming China would not be inconsistent with sound economic reasoning.
An economist would argue that the demand for human capital increases with economic opportunities and demand is as important as supply, if not more. Also, State-led development may lead to higher investment rates but also to a greater misallocation of capital, and very high investment rates can be sub-optimal because they entail excessively low consumption levels. As for democracy being a tax on the poor, it could well be the opposite.
However, neither these economic arguments nor the observed performance during the first 27 years since the beginning of reforms should be a reason for India’s complacency. In fact, something quite dramatic happened in China around this time in the development process, something that boosted its economic performance in an unprecedented manner.
The acceleration of China’s growth pace could be missed when measuring GDP in constant local currency. By this metric, the annual growth rate of its GDP per capita increased only marginally, from 8.4% in the first 27 years to 8.7% in the following 13. But as pointed out before, growth rates measured in constant local currency can be misleading when considering relatively long periods of time. Measured in constant dollars, China’s growth rate surged from 3.6% per year to an astounding 12.3% per year. And in constant PPP dollars, it went from 4.9% in the first 27 years to 6.8% in the next 12 (data are not available beyond 2016). Part of this jump may be accounted for by the overstatement of China’s growth rate since 2008, which was mentioned earlier – but not all of it.
Again, it is only possible to speculate about what triggered this spectacular growth acceleration, but a strong focus on global integration is most probably part of the story. As noted by Dani Rodrik, high-growth countries are those that are able to undertake rapid structural transformation from low-productivity (‘traditional’) to high-productivity (‘modern’) activities. These modern activities are largely tradable products. Even poor economies have economic activities – horticulture in Ethiopia, auto assembly in India, consumer electronics in China – where productivity levels are not too far off from what we observe in the advanced economies. As resources move from traditional activities towards these, economy-wide productivity increases.8
A range of interventions were used in China to foster its global integration. They included the development of Shanghai and other coastal cities, which enormously reduced logistic costs and allowed the economy to better connect with world markets. They also included a vigorous engagement in trade agreements, and especially entering the World Trade Organization (WTO).
These interventions reflected a vision in which a strong export orientation would drive greater efficiency in the allocation of resources and boost productivity gains. Being part of global value chains may have raised the standards firms needed to meet, in terms of quality and reliability. It might also have resulted in an upgrading of business management practices. And spillovers might have been felt throughout the economy. As a result, international trade in goods and services boomed, not only in absolute terms but also relative to GDP. This happened around the years 24 to 29 since the beginning of economic reforms (Figure 6).
Figure 5. External openness in China and India
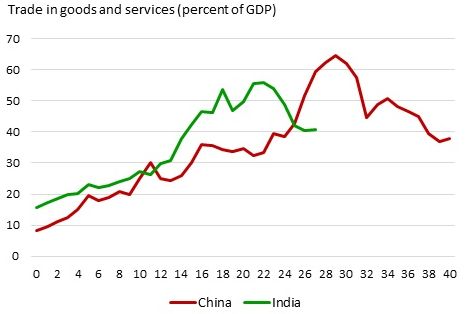
Note: The horizontal axis indicates the time into the reform process, with year 1 being 1978 in China and 1991 in India.
Source: International Financial Statistics.
India had been more globally integrated than China during most of the first quarter of a century since the beginning of reforms. This greater openness is consistent with its stronger performance during that period. But since year 23, India has been moving in the opposite direction. The slowdown in global trade that followed the global financial crisis may explain some of the reversal. But India’s exports have remained weak in recent times, despite the recovery of the world economy.
It could well be that India is about to experience a growth acceleration similar to that of China. The experience of the last few years, when India overtook China as the fastest-growing large economy, could be interpreted as evidence that this is happening. However, there are good reasons to believe that India is missing on the opportunities China exploited to engineer its growth acceleration.
Indian cities are notoriously messy (Ellis and Roberts 2016). With the exception of state capitals, they lack empowered authorities that can coordinate investments and service delivery across space. As a result, large metropoles are sprawling, congestion is the norm, and much urbanisation takes place through spontaneous densification rather than through coherent planning. Messy cities undermine logistics and are unlikely to become efficient connecting points with the global economy.
As for international integration, India entered WTO through the grandfathering of its membership in the General Agreement on Tariffs and Trade (GATT), without having to upgrade its regulatory framework or to open up to foreign direct investment, as China did. For quite some time, India also stayed away from major trade negotiations such as the Trans-Pacific Partnership (TPP). While being a member of the Regional Comprehensive Economic Partnership (RCEP), India seems hesitant to give Chinese companies greater access to its markets. Unlike China at the time of its accession to the WTO, India seems to remain a reluctant globaliser.9
The next phase of economic growth
China is recognised as a global star in economic development, but for a quarter of century since the beginning of its economic reforms India might have done equally well, or even better. This very solid performance has taken place under different governments and therefore cannot be attributed to a single party or coalition. Governments led by the Congress Party were in charge for 17 of the 27 years since time zero, and governments led by the Bharatiya Janata Party for the remaining 10.
Beyond the disagreements that can be expected in a vibrant democracy, there has been a remarkable continuity on the main economic orientations of the country. This has been true on key issues such as maintaining macroeconomic stability, increasing the reliance on market mechanisms, and removing bureaucratic barriers. Major reforms, such as the introduction of the Aadhaar identification card or the adoption of the Goods and Services Tax, were initiated by one government and implemented by another.
A similar kind of consensus may be needed now. A growth acceleration like that experienced by China as it entered its second quarter of a century since the beginning of economic reforms is unlikely to happen spontaneously. At present, India’s messy urbanisation process is undermining is trade logistics, and a proactive approach to global integration is conspicuously missing. The levers China used to speed up its economic transformation are not being used to the same extent by India.
Progress on these two fronts would require bold decisions, like those that were made in 1991, at the beginning of the reform process. Those decisions range from empowering urban authorities to negotiating major trade agreements. A shared vision would also be needed to ensure continuity going forward, regardless of which party or coalition is in charge. If these conditions were met, India could well continue performing as solidly as China did, or even better.
Comments and suggestions by Robert Beyer, Homi Kharas, Yue Li, Sandeep Mahajan, Deepak K. Mishra, Rinku Murgai and Mathew A. Verghis are gratefully acknowledged.
Notes:
- A brief description of the reform process in the two countries is offered by Bardhan (2010).
- For example, the beginning of “growth spurts” was chosen as the year zero for a comparison between China and several other East Asian countries by Brandt et al. (2008). And the beginning of reforms was the time zero to compare Vietnam to several other developing countries, including China, in World Bank and Ministry of Planning and Investment of Vietnam (2016).
- This point is made by Kotwal et al. (2011).
- For a detailed discussion, see Chen et al. 2019.
- The approach builds on a processed presentation by Homi Kharas, comparing the growth performance of China, India, Japan, and Korea.
- A comparison of the proportionate change in poverty per unit growth in GDP per capita – the growth elasticity of poverty reduction – is proposed by Ravallion (2011).
- For a discussion of poverty measurement issues in India see Islam et al. (2018).
- Most of this paragraph is from Rodrik (2010).
- A relatively recent assessment of India’s trade policy can be found in WTO Secretariat (2015).
Further Reading
- Bardhan, P (2010), Awakening Giants, Feet of Clay: Assessing the Economic Rise of China and India, Princeton University Press, New Haven.
- Bolt, J, Robert Inklaar, H de Jong and J Luiten van Zanden (2018), ‘Rebasing ‘Maddison’: new income comparisons and the shape of long-run economic development’, Maddison Project Working paper 10, Groningen Growth and Development Center.
- Brandt, L, TG Rawski and J Sutton (2008), China's Great Economic Transformation, 569-632. Available here.
- Chen, W, X Chen, C Hseih and Z (Michael) Song (2019), ‘A Forensic Examination of China’s National Accounts’, Brookings Papers on Economic Activity, Conference Draft, Spring.
- Ellis, P and M Roberts (2016), ‘Leveraging Urbanization in South Asia: Managing Spatial Transformation for Prosperity and Livability’, The World Bank, Washington, DC.
- Feenstra, Robert C, Robert Inklaar and Marcel P Timmer (2015), “The Next Generation of the Penn World Table”, American Economic Review, 105(10): 3150-3182.
- Ferreira, Francisco HG, Shaohua Chen, Andrew Dabalen, Yuri Dikhanov, Nada Hamadeh, Dean Jolliffe, Ambar Narayan et al. (2016), “A Global Count of the Extreme Poor in 2012: Data Issues, Methodology and Initial Results”, The Journal of Economic Inequality, 14(2): 141-172.
- Islam, T, D Newhouse, M Yanez-Pagans (2018), ‘International Comparisons of Poverty in South Asia’, Policy Research Working Paper 8683, The World Bank, Washington, DC.
- Kotwal, Ashok, Bharat Ramaswami and Wilima Wadhwa (2011), “Economic Liberalization and Indian Economic Growth: What's the Evidence?”, Journal of Economic Literature, 49(4): 1152-99.
- Ravallion, Martin (2011), “A Comparative Perspective on Poverty Reduction in Brazil, China and India”, The World Bank Research Observer, 26(1): 71-104.
- Rodrik, Dani (2010), “Making Room for China in the World Economy”, American Economic Review, 100(2): 89-93.
- Rodrik, Dani and Arvind Subramanian (2005), “From “Hindu Growth” to Productivity Surge: The Mystery of the Indian Growth Transition”, IMF Staff Papers, 52(2): 193-228.
- World Bank (2016), ‘Poverty and Shared Prosperity: Taking on Inequality’, The World Bank, Washington, DC.
- World Bank and Ministry of Planning and Investment of Vietnam (2016), Vietnam 2035: Toward Prosperity, Creativity, Equity, and Democracy, The World Bank, Washington, DC.
- WTO Secretariat (2015), ‘Trade Policy Review: India’, World Trade Organization, Geneva.

Comments will be held for moderation. Your contact information will not be made public.