

 18 April, 2023


Building on past research, Saswata Ghosh and Pallabi Das estimate the state- and district-level fertility differentials between Hindus and Muslims using data from the latest round of the NFHS. They show that although the fertility transition has advanced further in most states during the last decade, and fertility rates between Hindus and Muslims have also converged, some regional variations persist.
India has witnessed a significant fertility transition during the last decade. According to the latest round of National Family Health Survey (NFHS-5), in 2019-21, Total Fertility Rate (TFR, or the number of children born per woman on average) in India had already reached below replacement level of 2.1. This transition covered all regions and sections of society during the last decade, though to varying degrees (Registrar General of India, 2011). However, in a vast country like India, some variations in TFR can still be observed across different socio-demographic, economic and spatial parameters – this is due to the high degree of heterogeneity of India population (a fact which has been endorsed by earlier research such as James and Rana (2021)).
Differential fertility between Hindus and Muslims – the two major religious groups in India – has always fuelled controversy among academicians and policymakers. According to NFHS-5, TFR among Hindus was estimated to be 1.9, while among Muslims it was 2.4. However, according to James and Rana (2021), declining fertility in India encompasses all religious groups including Muslims, which have historically recorded higher fertility than other communities, have also recorded a faster decline in fertility in recent years. Using 2011 Census data, an earlier study by Ghosh (2018) observed that in districts where Hindu fertility was high, Muslim fertility was also high, and where Hindu fertility was low than Muslim fertility was also low – signifying that it was not religion that influences the level of fertility. In the study, it was also found that regions with high fertility was characterised by high fertility across groups, irrespective of socio-religious affiliation or educational attainment among women; the same holds for low fertility regions.
Data and sample selection
In this article, we first estimate the pace of decline in TFR for the last 30 years for all religions; and specifically for Hindus and Muslims in 10 selected states of India1 which have at least 10% Muslims in their total population and can have a discernible influence on religious demography in future decades. Second, we use unit-level data obtained from NFHS to estimate the Hindu-Muslim fertility differentials at the district level for these 10 selected states, and try to assess their process towards convergence. Data for this exercise were drawn from various rounds of National Family Health Surveys (the first and fifth rounds in particular), and indirect estimates of TFR from Census 2001 and 2011 made by the researchers. For simplicity, reference years for round one and fifth of NFHS are discussed as 1992 and 2019 instead of 1992-93 and 2019-21 respectively.
Fertility trends over the last 30 years
As revealed in Figure 1, at the all-India level, TFR has declined from 3.4 to 2.0 between 1992 and 2019 for all religions. Among Hindus, it declined from 3.3 to 1.9, while among Muslims it declined from 4.4 to 2.4 in the same period.
Figure 1. TFR among Hindu and Muslim populations, 1992-2019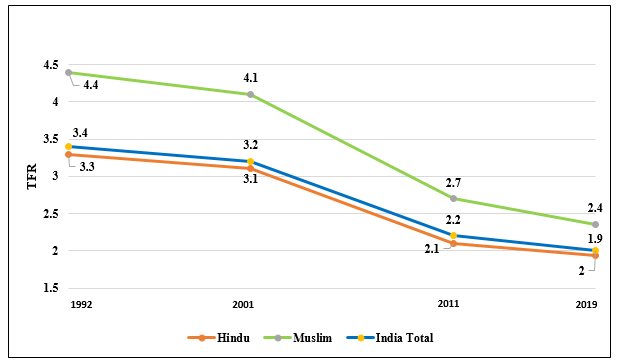
![]()
Between 1992 and 2019, TFR for all religions declined by 41.3%. As Table 1 reveals, the pace of decline tended on average to be the fastest between 2001-2011, followed by 2011-2019, while it was the slowest between 1992-2001. Among the 10 states in our study, the pace of decline was found to be the fastest in Uttar Pradesh and Assam, and slowest in Kerala. From the Table 1, one can also note that those states such as Uttar Pradesh which had significantly higher fertility in the 1990s experienced faster decline during 2001-2011. It may also be noted that states which already had relatively lower fertility (for instance, Karnataka) or achieved replacement level of fertility (for example, Kerala) during the 1990s or before, experienced faster decline during 1992-2001, while high fertility states of Bihar and Jharkhand actually experienced an increase in TFR during the said period.
Table 1. Estimates of TFR from 1992 to 2019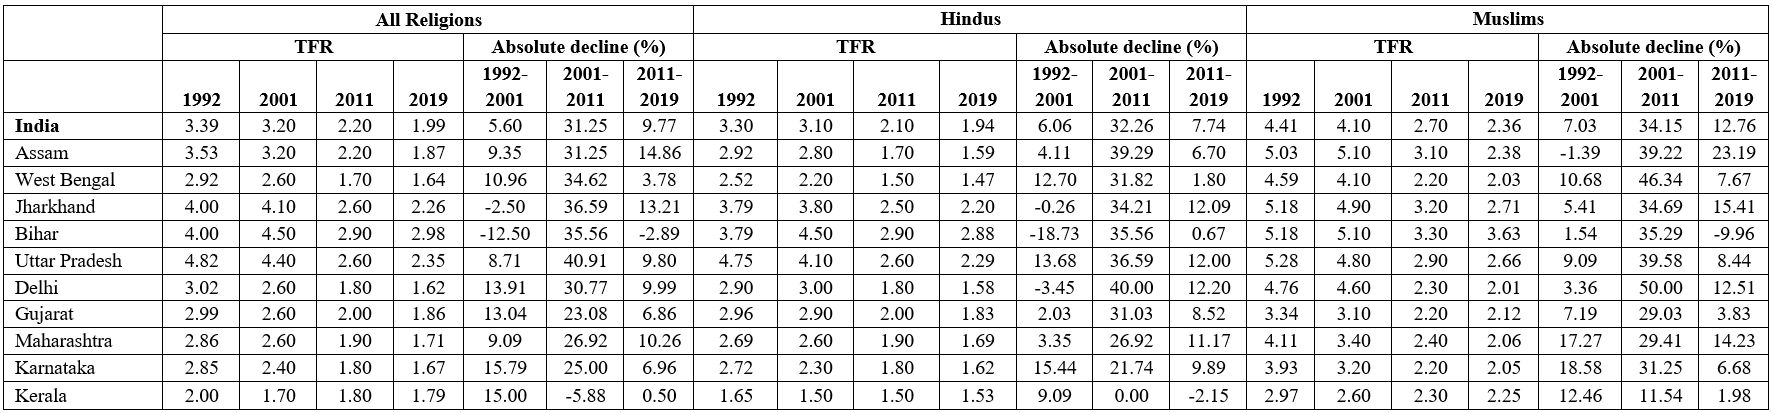
Sources: 2001 and 2011 Census estimates are obtained from Rajan (2005) and Ghosh (2018) respectively. 1992 estimates by states are collected from Misra (2004). 2019 estimates are obtained from NFHS-5 (2019-21) state reports.
Note: Since Jharkhand was formed on 15 November, 2000 from Bihar, the TFR of Jharkhand in 1992 is considered to be the same as Bihar.
Table 1 also reveals that the decline in TFR was faster among Muslims compared to Hindus at an all-India level during this period. This decline among Muslims was the highest in Delhi, followed by West Bengal, while among Hindus, it was the highest in Uttar Pradesh. During 1992-2001, while TFR increased among Hindus in Bihar and Jharkhand, it declined among Muslims in the same states. During 2001-2011, even though the pace of decline was very high, across religions and in majority of the study states, it was relatively higher among Muslims compared to Hindus in some states like Delhi. During 2011-19, the decline of TFR across India was more than 5 percentage points higher among Muslims than Hindus. It was found to be the highest among Muslims in Assam, while among Hindus, the decline was highest in Delhi. The pace of decline of TFR was the slowest in Bihar during the said period, at only 0.67% among Hindus, while it increased among Muslims by around 10%.
TFR differentials between Hindus and Muslims over the years
Table 2 depicts how the gap between TFR among Hindus and Muslims has reduced over time. At the all-India level, the gap of 1.11 children between Hindus and Muslims in 1992 had reduced to only 0.42 children by 2019. The reduction of gap was most profound in West Bengal, which went from a difference of 2.07 children in 1992 to 0.56 children in 2019. However, there are other states, (for instance, Uttar Pradesh, Gujarat and Karnataka) where not only was the reduction of the gap not uniform over the years, but it also widened to some extent. As fertility rates among Muslims increased in Bihar, for instance, the gap between number of children per woman between Hindus and Muslims also increased between 2011 and 2019 (from 0.40 to 0.75 children per woman).
Table 2. Differences in TFR between Hindu and Muslim populations from 1992 to 2019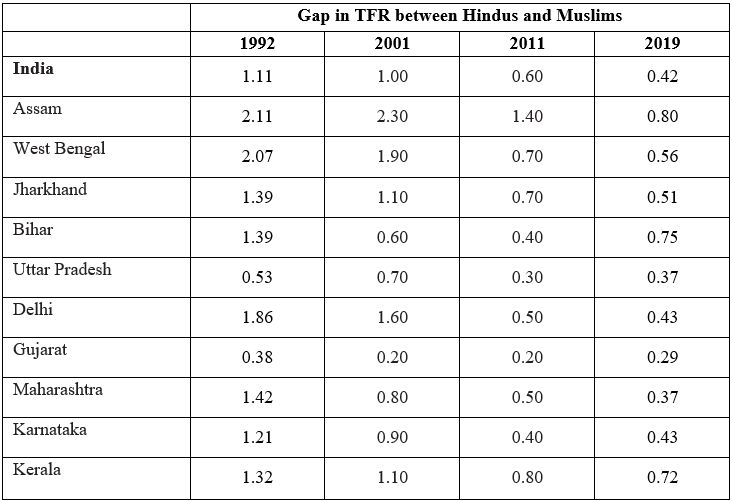
Source: Authors’ calculations
District-wise differences in fertility levels
Out of 10 study states, TFR reached at or below replacement of fertility (that is, <=2.1) among Hindus in all the districts in four states, namely Assam, West Bengal, Delhi and Kerala (see Table 3). In these states, among Muslims, TFR reached at or below replacement level in 43.3%, 75%, 54.5% and 57.1% districts respectively. In the states of Bihar, Uttar Pradesh and Jharkhand only 2.6%, 33.3% and 36% achieved at or below replacement level of fertility among Hindus, while these percentages were 7.9%, 25.3% and 26.1% for Muslims respectively – confirming earlier findings that in the districts where Hindu fertility was high, Muslim fertility was also high (Ghosh 2018). In states like Maharashtra, Gujarat and Karnataka where more districts observed fertility transition among Hindus than among Muslims, Muslims in a 40-45% of districts are in the intermediate stage of fertility transition (TFR> 2.1 and <3.0).
Table 3. Districts with different levels of fertility among Hindus and Muslims, 2019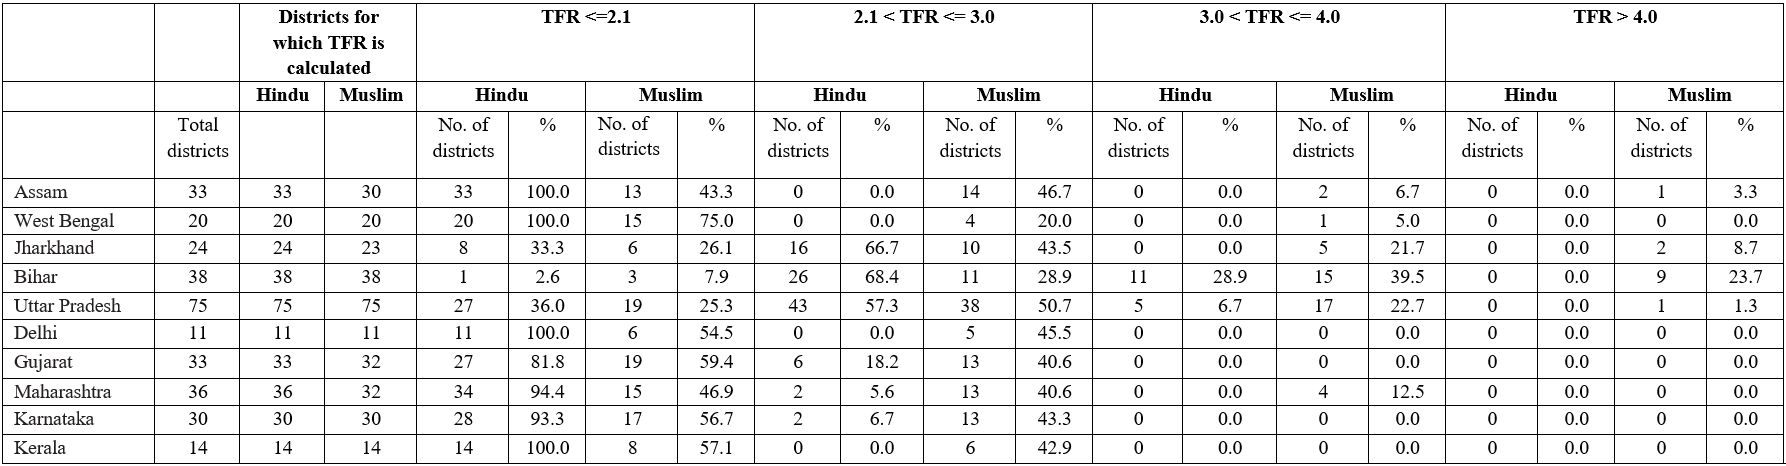
Source: District level estimates of TFR by states are calculated by authors using individual women sample data from NFHS-5 (2019-21).
The table also reveals that in a majority of districts in Uttar Pradesh and Jharkhand, fertility transition among both Hindus and Muslims is at an intermediate stage. In Bihar, although 68.4% of districts are in this intermediate stage of fertility transition among Hindus, fertility transition among Muslims is at a pre-transition stage (TFR >3) in more than half of the districts. It is important to point out that, in Bihar, there are 9 districts (23.7%) where TFR among Muslims is found to be more than 4.0.
Convergence or divergence?
In an earlier study of 618 districts by using Census 2011 data, Ghosh (2018) argued that the fertility transition has been underway both for Hindus and Muslims, albeit at a variable pace. The study also found that, though the overall convergence of fertility between Hindus and Muslims has been underway, significant regional variations persist. This was further confirmed by James and Rana (2021). If we compare the findings of the present study with the earlier study (see Table 4 for the findings from Ghosh (2018)), we can ascertain that the process of convergence has advanced further in the nine states excluding Bihar.
Table 4. Number and share of districts with different levels of fertility among Hindus and Muslims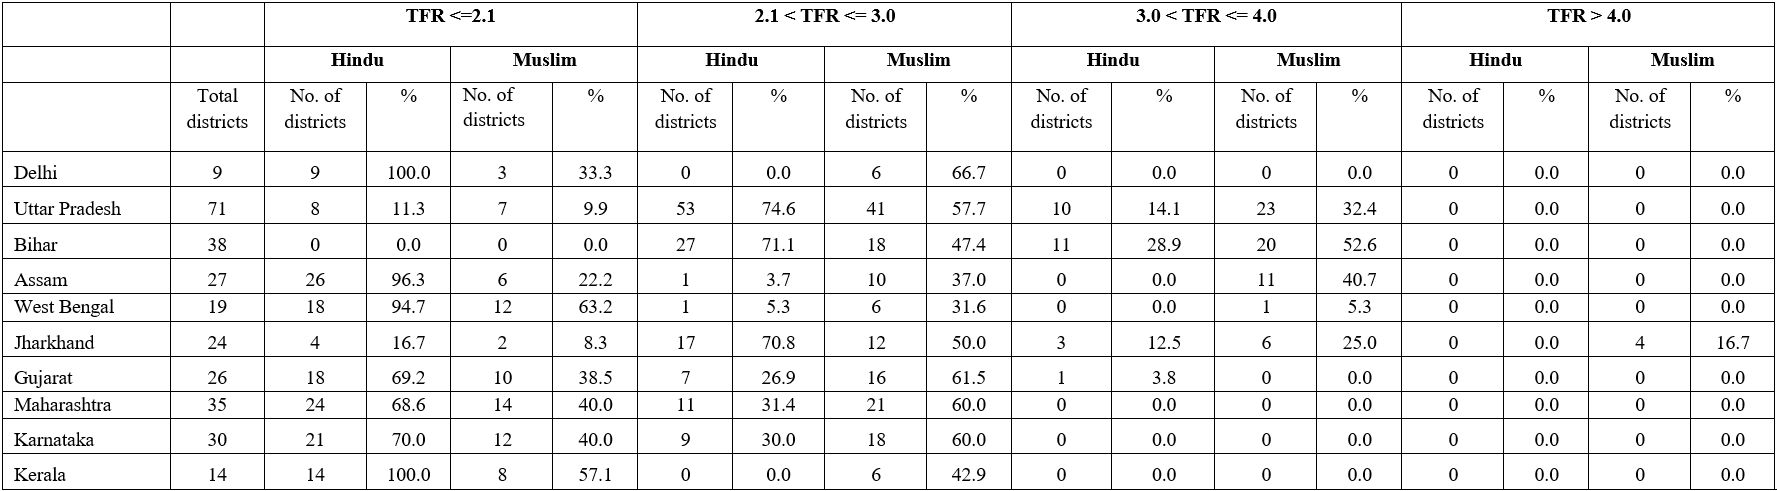
Source: Ghosh (2018)
Such advancement has been relatively faster in West Bengal and Assam compared to the other seven states. For example, in Assam, although 96.3% of the districts achieved a TFR at or below replacement level among Hindus, it was only 22.2% among Muslims in 2011. According to 2019 data, these figures are 100% for Hindus, but 43.3% among Muslims. Further, according to current estimates, only 2 districts in Assam have high fertility among Muslims in Assam, as compared to 11 in 2011. In other seven states the process of convergence was found to be steady.
The state of Bihar seems to be the only exception in the process of convergence. Although none of the districts achieved at or replacement levels of fertility for all religions in 2011, the fertility transition has taken place in one district for Hindus and three districts for Muslims as per 2019 estimates. At the same time, the number of districts with high fertility remained the same for Hindus (11 districts in 2011 and 2019), while it has been declining for Muslims (20 districts in 2011 and 14 districts in 2019). However, although none of the districts had shown very high fertility (with TFR>4.0) in 2011, 10 districts2 had very high fertility among Muslims as per 2019 estimates.. These districts require special attention from the state health and family welfare department, and an in-depth investigation is required to understand why fertility has increased among Muslims in these districts.
Conclusion
According to the latest round of NFHS data, India has witnessed a fertility transition at the aggregate level, though a few states located in northern and north-central regions are still lagging in the transition process. In this study, we provide an in-depth picture of Hindu-Muslim fertility differentials and their trends over the past 30 years at the state-level in 10 large states.
One important limitation of our methodology is that, although the direct estimates of TFR at the district level sample are robust enough, estimates of TFR by religion would likely suffer if the sample size for a particular religion was too small. Thus, the results obtained from the study are at best indicative and not conclusive. Nonetheless, it may be ascertained that though overall convergence process of fertility between Hindus and Muslims in the study states have advanced further in the last decade since 2011, some variations persist. Bihar, in particular, requires extensive attention.
Notes:
- The selected states (with their weighted percentage share of Muslim population) are Assam (30.4%), West Bengal (30.4%), Jharkhand (11.2%), Bihar (13.9%), Uttar Pradesh (16.4%), Delhi (12.7%), Gujarat (10.0%), Maharashtra (10.4%), Karnataka (12.3%) and Kerala (27.4%). The selected states together contribute more than 85% of the Muslim population in India.
- These districts are Purba Champaran, Sitamarhi, Madhepura, Supaul, Araria, Purnia, Madhepura, Darbhanga, Khagaria and Bauxar.
Further Reading
- Ghosh, Saswata (2018), “Hindu–Muslim fertility differentials in India: indirect estimation at the district level from Census 2011”, Indian Journal of Human Development, 12(1): 37-51.
- James, KS and J Rana (2021), ‘India’s fertility transition and differences between religious groups’, The India Forum, 1 November.
- Misra, V (2004), ‘Muslim/Non-Muslim Differentials in Fertility and Family Planning in India’, East-West Centre Working Papers, Population and Health Series.
- Rajan, S Irudaya (2005), “District level fertility estimates for Hindus and Muslims”, Economic and Political Weekly, 40(5): 437-446.

Comments will be held for moderation. Your contact information will not be made public.