

 12 July, 2022


In anticipation of India updating its Nationally Determined Contributions (NDCs), Aman Srivastava and Ashwini Swain evaluate the climate pledges made by Prime Minister Modi at COP26. In the context of historical trends and growth and development objectives, they discuss the feasibility and implications of reducing India’s emissions intensity and increasing the share of renewables in its energy mix. They use this analysis to suggest potential ways forward towards ensuring greater clarity and cohesion among these pledges.
At the United Nations Climate Change Conference (COP26) in Glasgow last year, Prime Minister Modi pledged a range of short- and long-term climate actions. Speaking at the Summit, PM Modi presented the Panchamrit (five nectar elements), five time-bound climate pledges to:
i) Reach 500 gigawatts (GW) of non-fossil energy capacity by 2030.
ii) Meet 50% of India’s energy requirement from renewable energy (RE) sources by 2030.
iii) Reduce the carbon intensity of the economy by 45% below 2005 levels by 2030.
iv) Reduce total projected carbon emissions by 1 billion tonnes by 2030.
v) Achieve the target of net-zero emissions by 2070.
Among climate watchers, there is discussion of whether India is considering submitting it's updated Nationally Determined Contribution (NDC) – a written submission to the United Nations Framework Convention on Climate Change (UNFCCC) with updated climate targets, and whether (and how) these Panchamrit pledges will be formally incorporated into this updated NDC. Though the pledge for net zero emissions by India was a focal point in the climate negotiations, short- and medium-term outcomes are more likely to be driven by the first four pledges.
In considering the question of a possible updated NDC, is it important to understand the implications of these pledges in the context of earlier actions, how feasible they are, and what the implications for realising them might be. To explore these issues, we examine the Panchamrit pledges, with a focus on clarifying the context around the first four, which have immediate policy salience while also being consequential for the achievement of the net-zero goal.
Emissions intensity pledge
In the context of the UNFCCC negotiations and its principle of common but differentiated responsibility, there is no single agreed global parameter to assess the emission intensity pledge made by India, or any country. However, it can usefully be considered from three perspectives: comparison against other countries’ emissions targets relative to their GDP; relationship to modelled projections of emissions and growth; and implications for the emissions efficiency of India’s GDP growth.
i) Other countries: The pledge to reduce the emissions intensity of India’s GDP depends upon both total emissions and GDP in 2030. It thus allows India the space to continue growing in pursuit of its development objectives, while potentially decarbonising its economy at rates comparable to other countries, relative to its GDP, as it has done in the past (Figure 1).
Figure 1. Changes in emissions intensities across G7, BRICS, and South Asian countries
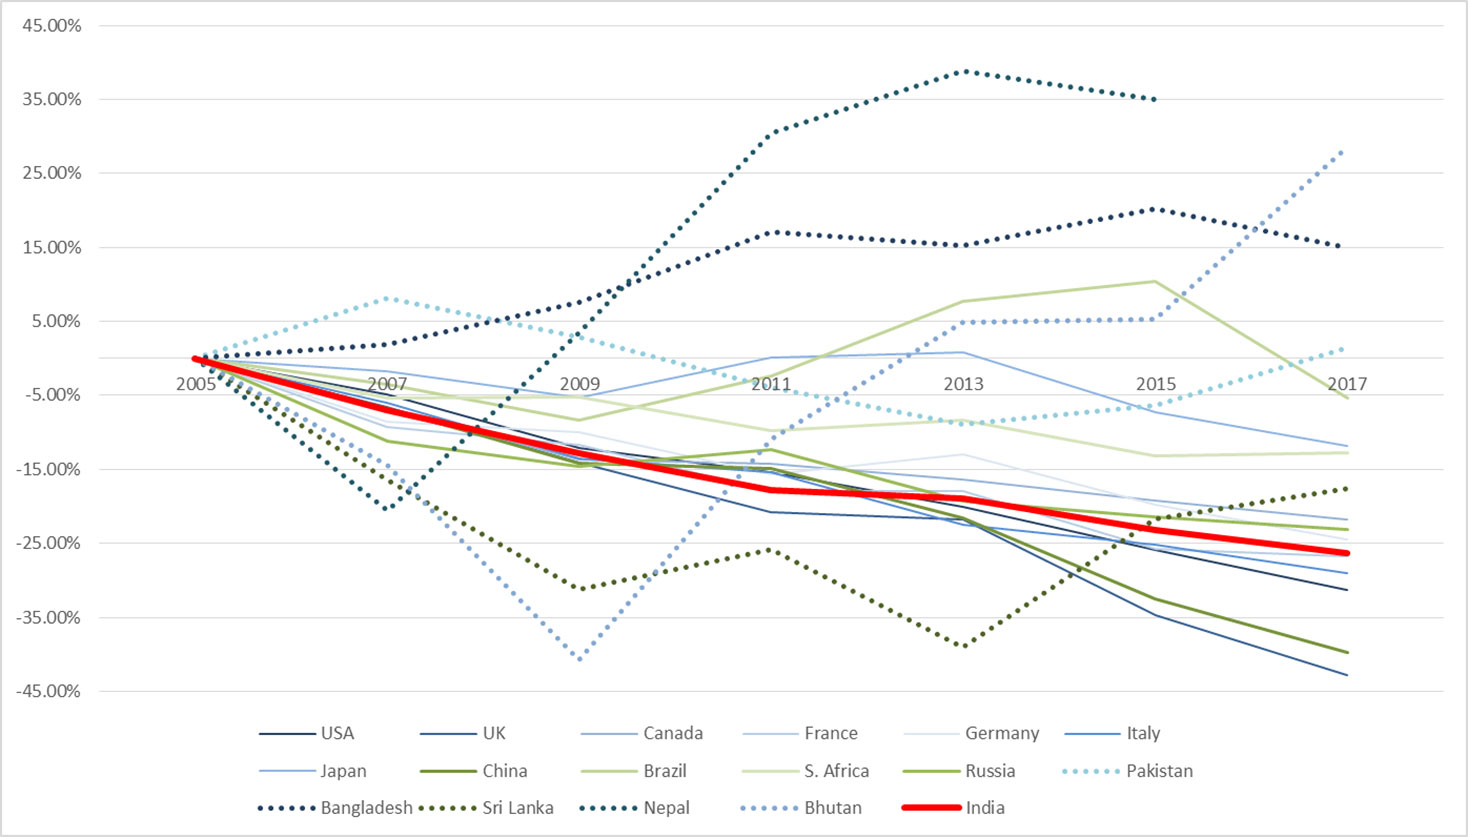
Sources: CO2 emissions and GDP data from World Bank, Ministry of Statistics and Programme Implementation (MoSPI), Ministry of Environment, Forest and Climate Change (MoEFCC), Energy Innovation
Adjusting for GDP growth, India’s emissions trajectory between 2005 and 2017 has been lower than all other South Asian countries, three of the other four BRICS countries, and three G7 countries. It is noteworthy that even as a relatively poor developing country, India’s pledged further decline in emissions intensity starts from a lower baseline.
ii) Modelled trajectories: With 2005 emissions estimated to be 1.6 gigatonnes of CO2 equivalent (GtCO2e) and GDP at 59.1 trillion1, India’s 2005 emissions intensity was approximately 27.7 grams of CO2 equivalent (gCO2e)/rupee (MoEFCC, 2021). Based on earlier analyses of India’s emissions and growth trajectories until 2018-2019, the country was estimated to be on track to reach intensity reductions of 35-50% by 2030. An assessment of eleven projected scenarios from five recent studies (Gupta et al. 2019, The Energy and Resources Institute (TERI) and Shell 2021, International Energy Agency (IEA) 2021, Chaturvedi 2021, Energy Innovation) that have modelled India’s growth and emissions pathways2 better contextualises the recent pledge (Figure 2).
Figure 2. Projected reductions in 2030 emissions intensity below 2005 levels, across modelled scenarios
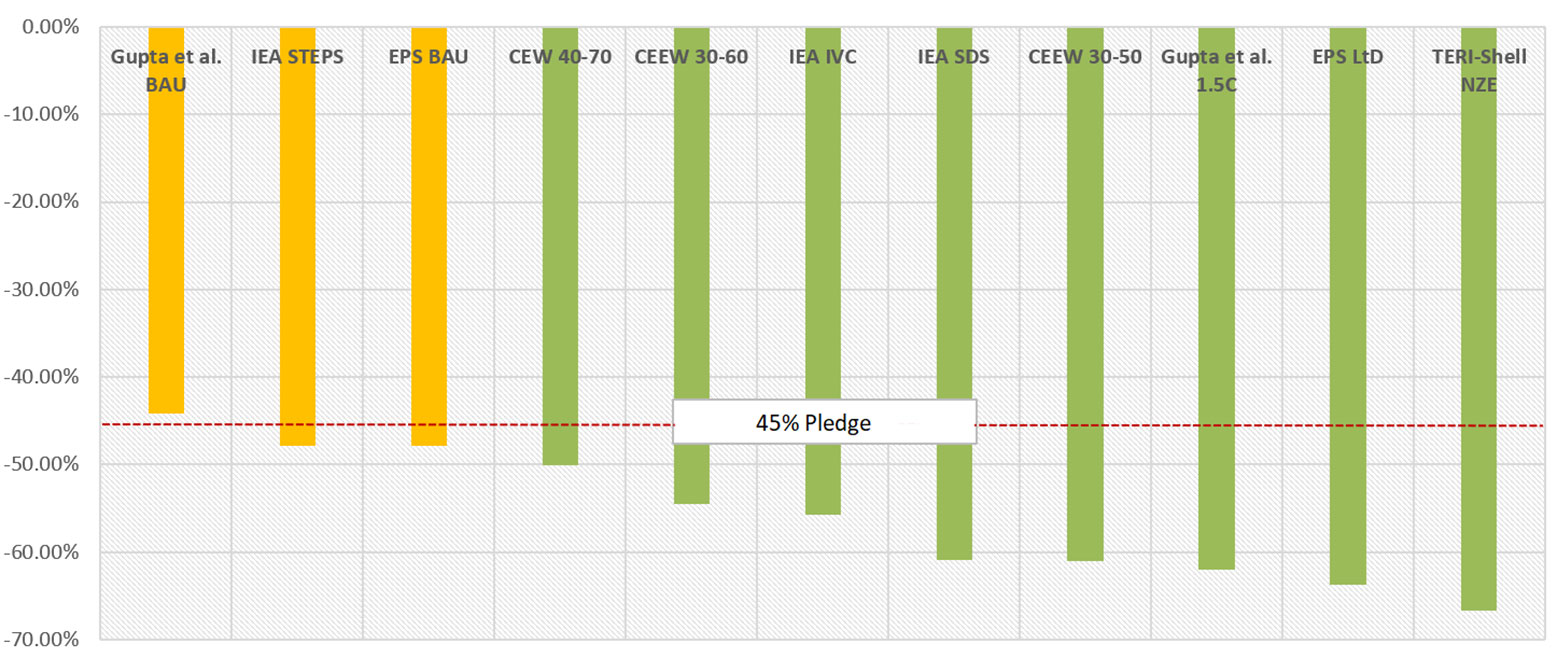
Source: Models from Gupta et al. 2019, TERI and Shell 2021, IEA 2021, Chaturvedi 2021 and Energy Innovation have been used
Notes: (i) TERI-Shell and IEA only model emissions from the energy sector. (ii) Gupta et al. provide GDP estimates at FY2011-12 prices; IEA provides GDP estimates at 2019 prices; TERI-Shell GDP is based on MoSPI estimates at FY2011-12 prices. (iii) Gupta et al.’s GDP is converted to rupees using exchange rates on 31 March 2012; IEA GDP is converted using exchange rate in its Annex B. (iv) An inflation adjustment is applied from base year to rescale IEA estimates to FY2011-12 prices, based on a Ministry of Finance Cost Inflation Index.
Three of these projections (yellow bars highlighted in Figure 2) can be interpreted as ‘reference’ scenarios, as they represent a continuation of trajectories that incorporate decarbonisation policies and targets as of 2018-2020. The remaining eight are designed to represent scenarios based on additional policies that suggest possible pathways towards full decarbonisation in the second half of the century. The 45% intensity pledge appears to be consistent with the current policy framework reflected in the three reference scenarios here.
Notably, reference scenarios of earlier modelling studies (Dubash et al. 2018) have been shown to indicate lower intensity estimates over time, as new policies have been introduced. This suggests that what counts as ‘reference’ is itself a rapidly shifting baseline, which represents material improvements in climate action over time. The intensity pledge may thus serve as an ex-post reflection upon the feasibility of a set of regularly enhanced climate policies.
iii) Growth implications: From the perspective of the historical relationship between growth and emissions, meeting India’s intensity pledge suggests the need for a stronger decoupling of growth and emissions than before, and possible shifts in the economic structure–this will require more than business-as-usual changes.
To illustrate, Figure- 3 plots an ‘envelope’ of emissions to economic growth in 2030, which India will need to sit below in order to achieve its pledge. By contrast, recent averages of this relationship have been consistently above this envelope. An example suggests the extent of the change required: India’s emissions were 2.5 GtCO2e in 2016, and had grown at an annualised rate of 5.1% between 2010 and 2016 (MoEFCC, 2021), while its GDP had grown at an annualised 6.8% in the same period. If India continues to grow at a similar rate of 6.5% between 2020 and 2030, then in order to meet the intensity pledge, emissions will only be able to grow at a maximum of 3.1% annually between 2016 and 2030.
Figure 3. Pledge-compatible relationship between average emissions and GDP growth
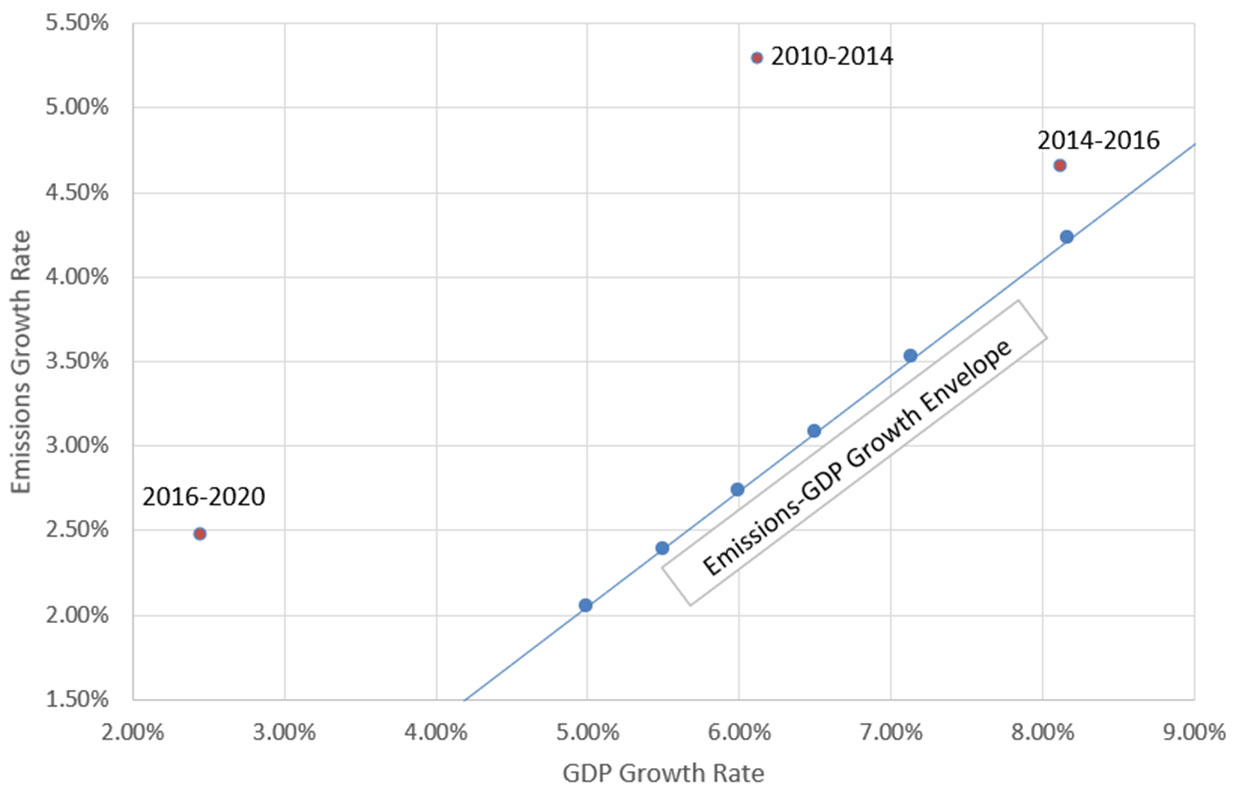
Notes: (i) GDP projections are estimated using MoSPI’s provisional 2020 estimate of Rs. 135.13 trillion as a base. (ii) GDP growth rates are annualised from 2020, while emissions growth rates are annualised from 2016, reflecting most recent official data. (iii) The 2020 emissions estimate for the data point (2016-2020), which incorporates initial Covid-19 effects, is sourced from Energy Innovation and may differ slightly from the eventual official estimates. (iv) Historical averages are based on the years for which official emissions data is publicly available per the MoEFCC.
A study of the emissions intensity target suggest some key takeaways. First, adjusted for GDP, India’s historical emissions trajectory so far has been on par with – or even lower than – those of other countries within the G7, BRICS, and South Asia. This indicates that, despite its low historical responsibility, it has been taking climate actions that are comparable, within the context of its growth objectives, and that its updated pledge would start from a relatively low base. The new intensity pledge also appears to be consistent with India’s current climate policy framework and thus reflects the likely implementation of existing climate policies (albeit policies that have already ratcheted up over time). However, since emissions will have less space to grow proportional to GDP than in previous years, this will require a greater decoupling of emissions from growth than has been achieved in the past.
Uncertainties around the emissions reduction pledge
The pledge to reduce India’s emissions by one GtCO2e by 2030 seems unlikely to inform policy in its current form, since its framing introduces several uncertainties. First, does the pledge refer to avoided emissions or absolute reductions? The former is more likely given India’s current trajectory and its requirements based on common but differentiated responsibility and respective capability3. Second, it is unclear what baseline the reductions are measured relative to, and how this baseline will be estimated. It is also not certain whether the pledge refers to reductions in a single year, or cumulatively from now until 2030. Given these uncertainties, we don’t attempt to assess this pledge in detail, other than to note that clarification seems necessary.
Feasibility of the clean energy pledge
The 500 GW non-fossil electricity generation capacity (NFC) pledge is consistent with India’s earlier projections and announcements. In 2019, PM Modi announced an enhanced RE target of 450 GW at the 74th UN General Assembly, which was in line with the Central Electricity Authority’s (CEA) draft projection (2019) of energy requirement and energy technology mix in FY2029-30. In its final report (2020), the CEA projected 525 GW of NFC by 2030 (Figure 4), which is in the approximate range of the 500 GW capacity pledge.
Figure 4. Projected technology mix of electricity capacity and generation as the share of generation capacity (GW, percentage share) (left) and share of gross generation (Terrawatt hour, percentage share) (right) in FY2029-30
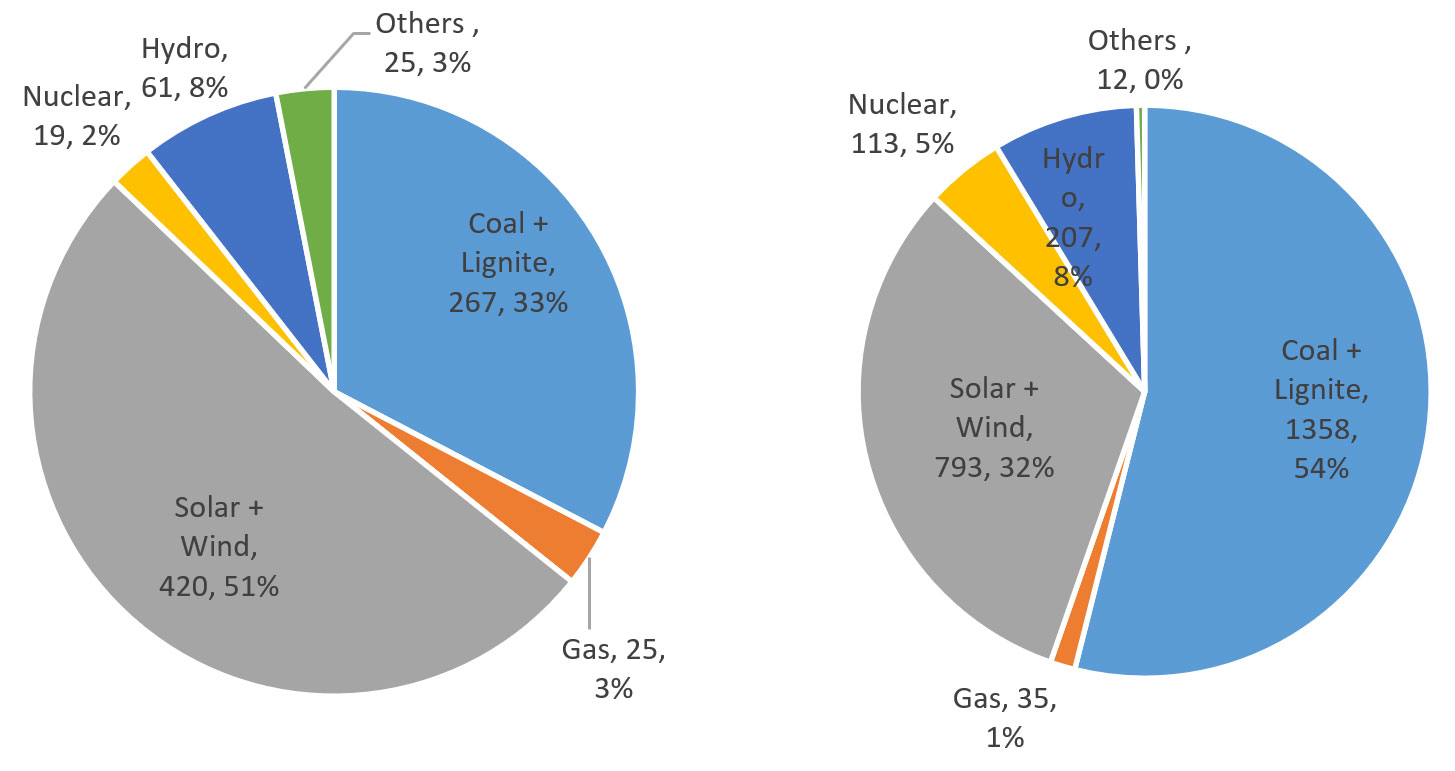
There are four broad implications of this pledge: First, this capacity pledge indeed represents a substantial commitment to an energy transition. If the target is achieved, a study by the Lawrence Berkeley National Laboratory claims, nearly half of India’s electricity could be carbon-free and electricity costs could reduce by 8-10% (Abhyankar et al. 2021). The CEA also projects 45% of India’s generation will be green with the pledged NFC.
Second, the pledge is highly ambitious compared to India’s current capacity addition rate. In FY2021-22, India added 16 GW of non-fossil capacity (of which 15.5 GW was RE); to meet the pledge the country needs an annual average capacity addition of 42 GW NFC, implying a near tripling of the current NFC addition rate. The Power Minister has expressed confidence in achieving the target on time. However, this ambition lacks a clear strategy. While import dependent RE growth is vulnerable to global market disruptions, the current prioritisation of domestic manufacturing could also affect the pace of deployment.
Third, current patterns of RE growth demonstrate the challenge in ensuring state level uptake of a national target. While only three states (Rajasthan, Gujarat, and Karnataka) are on track to meet their share in the domestic target of 175 GW RE capacity by 2022, 78% of current RE capacity is confined to only six states (Andhra Pradesh, Gujarat, Karnataka, Maharashtra, Rajasthan, and Tamil Nadu). Meeting the 500 GW target would require participation of the other states.
Fourth, while substantial, the capacity target, by itself, does not communicate clearly how far it will take India on a path to decarbonisation. To do so requires an understanding of India’s intentions with regard to electricity generation, and not only capacity.
This is where the second pledge on “meeting 50% of energy requirements” comes in. While it could provide complementary information about India’s energy journey, the phrasing of the pledge is ambiguous. There are at least two possible interpretations of the pledge: some have interpreted the pledge to imply 50% electricity generation from RE (Dubash 2021, Mitra et al. 2021, Narain et al. 2021). If correct, this would have been a game changing shift in India’s approach to RE, because it would have required active management of India’s coal use for electricity and a significant step up from the CEA projection of 40% RE generation. But, it would have also been an extremely challenging target to meet, since it essentially implies all new electricity demand would be met by RE.4
Others, notably the MEA, subsequently clarified that “in Paris, our nationally determined contributions were said that 40% of our installed electricity capacity would come from non-fossil fuel based energy sources…[The PM] announced that by 2030, in fact, 50% would be made from renewable energy sources.” Although a 50% capacity target implies substantial growth in RE capacity, it also implies that the other 50% could be coal, gas and nuclear. Taken together, the two energy pledges imply the potential for a total of just under 500 GW fossil capacity by 20305, significantly higher than CEA’s projection (292 GW), and about double of current fossil capacity (236 GW). Given the current market conditions with declining investment in new coal fired power plants, this seems an unlikely scenario. If this is read as meaning at least 50% RE capacity, then it allows for a smaller share of future fossil capacity, while RE could grow much faster. For example, CEA projects 420 GW of solar and wind capacity, which is little more than 50% of projected 817 GW total generation capacity in 2030.
In sum, the first interpretation implies a perhaps unrealistically rapid electricity transition, while the second provides at best some additional context to the first capacity target but little clarity on rate of growth of RE-based generation. This suggests the need for enhanced clarity in any NDC formulation.
Way forward
India’s emissions intensity pledge – even based on current policies – does signal that India intends to substantially decouple emissions and growth. Yet the second economy-wide emissions pledge is thinly specified to the point of defying analysis. India’s NDC, while promising substantial change, would benefit from greater clarity, more cohesion across the five Panchamrit pledges, and, subsequently, the careful formulation of strategies across sectors to ensure that the pledges are realised consistent with meeting India’s growth and development objectives.
Large energy capacity targets are important as a signal to the market to attract investments and promote manufacturing. Going by the MEA clarification, both energy pledges represent slightly different formulations of a capacity target. However, the target setting needs to consider the actual use of clean energy along with building of renewable capacities. Projections on electricity decarbonisation potential implies that India can indeed consider some form of non-fossil electricity generation target. The CEA’s projection of 40% RE and 45% non-fossil generation by 2030 is substantially ambitious compared to 25% non-fossil generation at present. India will require a strategy to achieve its capacity target while also taking into account its implications for the energy generation mix.
Notes
- As per FY2011-12 prices.
- Each study used different inputs and assumptions relating to data sources, currencies, exchange rates, growth rates, base years, and other parameters. Although we attempted to harmonise estimates to a common baselines, insufficient clarity on modelling processes may limit the direct comparability of these studies.
- CBDR-RC – a key term in international climate negotiations – refers to the fact that although all countries have a common responsibility to address climate change, these responsibilities are differently distributed across countries based on their differential cumulative contributions to global greenhouse gas emissions and their differential financial, technological, and institutional capacities to address climate change.
- Thermal generation in 2021-22 is 44% of projected electrical energy requirement in 2030. Nuclear, accounting for 3% of current generation, is projected to grow to 5%. Hence, there is little scope for non-RE generation growth to meet 2030 demand.
- As India now counts large hydro as RE, nuclear is the only technology that is non fossil and not RE. CEA projects growth of nuclear capacity to 19 GW by 2030, from 6.8 GW at present. If the 50% capacity target is for RE, then the potential for fossil capacity (coal and gas) is 462 GW; if it is 50% non-fossil capacity, the potential for fossil capacity is 500 GW.
Further Reading
- Abhyankar, N, S Deorah and A Phadke (2021), ‘Least-Cost Pathway for India’s Power System Investments through 2030’, Electricity Markets and Policy Department, Lawrence Berkeley National Laboratory.
- CEA (2019), ‘Draft Report on Optimal Generation Capacity Mix for 2029-30’, Central Electricity Authority, Ministry of Power.
- CEA (2020), ‘Report on Optimal Generation Capacity Mix for 2029-30’, Central Electricity Authority, Ministry of Power.
- Chaturvedi, V (2021), ‘Peaking and Net-Zero for India’s Energy Sector CO2 Emissions: An Analytical Exposition’, Council on Energy, Environment and Water.
- Dubash, Navroz K, Radhika Khosla, Narasimha D Rao and Ankit Bhardwaj (2018), “India's energy and emissions future: an interpretive analysis of model scenarios”, Environmental Research Letters, 13(7). Available here.
- Gupta, Dipti, Frederic Ghersi, Saritha S Vishwanathan and Amit Garg (2020), “Macroeconomic assessment of India’s development and mitigation pathways”, Climate Policy, 20(7): 779-799. Available here.
- IEA (2021), ‘India Energy Outlook 2021’, International Energy Agency.
- Mitra, A, C Gajjar and U Kelkar (2021), ‘COP26: Unpacking India’s Major New Climate Targets’, WRI India, 2 November.
- MoEFCC (2021), ‘India: Third Biennial Update Report to the United Nations Framework Convention on Climate Change’, Ministry of Environment, Forest and Climate Change.
- Narain, S et al. (2021), ‘India's enhanced climate targets and commitments: What do they mean?’, Centre for Science and Environment.
- TERI and Shell (2021), ‘India: Transforming to a Net-Zero Emissions Energy System’.

Comments will be held for moderation. Your contact information will not be made public.