

 28 June, 2023


Controlling water pollution and protecting water resources in India requires comprehensive collection and monitoring of data. In this article, Pohit and Mehta describe a project undertaken by NCAER and TCD, which used automated sensors attached to boats to collect data on water quality parameters at key points along the Ganga river in Uttar Pradesh and West Bengal. They emphasise how these findings can help understand the sources of pollution to ensure effective policy interventions and regulatory compliance by polluters.
The Glasgow Climate Pact, adopted by the 26th United Nations Conference of Parties (COP26) on 21 October 2021, outlines the need to bring together governments and the private sector for catalysing technological innovations to achieve long-term and meaningful decarbonisation in the most polluting sectors. The COP26 Pact also highlights India’s interests and initiatives on climate action to support the country’s transition to a clean and climate-resilient economy. However, the first step towards attaining this goal is to acquire the relevant knowledge and tools for ensuring adequate adaptation actions in line with the agenda for controlling worldwide climate change.
Is India equipped to move in tandem with the goals set forth by the United Nations Framework Convention on Climate Change at Glasgow? It is often suggested that, though India has a highly robust data collection system, it falls woefully short where environmental statistics are concerned. At a time when taking climate change into account has become imperative for policymaking and economic growth, any deficiencies in official data on various environmental components could seriously hamper the country’s efforts to move towards realising its net zero emissions targets. In India, the conventional System of National Accounting (SNA) has historically been used to examine economic data for boosting growth and development. The SNA, however, relies almost exclusively on monetary data pertaining to production, employment, consumption, income and financial transactions for economic strategisation and policymaking. These data have been obtained through economic surveys and administrative records, since the early 1950s. Although the methodology and components of the SNA were revised in 1993, what emerged was an amalgam of several satellite accounts which largely focus on popular developmental themes such as tourism, health, and education.
With the issue of climate change gaining primacy over the years, India needs to spruce up its research efforts and produce high-quality, advanced data related to various domains of the environment, especially the supply and use of water, green technologies, and marine economics. A nascent attempt by individual researchers to produce modules of environmental protection accounts through the construction of an environmentally Extended Social Accounting Matrix (ESAM), way back in 2006-07, marks one of the first significant steps in this direction (Pal et al. 2012).
While stressing the need for obtaining better data on all aspects of environmental conservation, in this article we specifically focus on data imperatives for curbing riverine pollution, which has a serious deleterious impact on climate dynamics.
Need for data on water quality and pollution
Water covers 71 per cent of the earth, in oceans, rivers, lakes, and glaciers; in the soil as moisture; and in the air as water vapour. And this crucial resource is under constant threat in terms of both quality and quantity. The latest United Nations World Water Development Report finds that 26% and 46% of people globally lack access to safe drinking water and basic sanitation respectively (UNESCO, 2023). Around 80% of the people living under persistent water stress and subject to the effects of water pollution reside in Asia, particularly India, Pakistan, and north-east China.
Other research has found that, annually, 37.7 million Indians are affected by waterborne diseases; 1.5 million children die of diarrhorea; and 73 million working days are lost due to the direct and indirect impact of water pollution, resulting in an economic burden of Rs. 900 million. Poor wastewater management, improper irrigation practices such as the unchecked use of pesticides and fertilisers, oil pollution, discharge of anthropogenic waste into water bodies, unregulated shipping and industrial activity, as well as religious rituals leading to submergence of toxic materials in rivers, all contribute routinely to the widespread water contamination that is increasingly encompassing India with each passing year (Pohit and Mehta 2022, UNESCO, 2023).
A NITI Aayog report also reveals that India accounts for 18% of the world's population, but holds only 4% of its water resources, making it one of the most water-deficient regions in the world. Further, as per this report, 70% of the freshwater sources in the country were found to be contaminated, and India ranks 120 out of 122 countries in terms of the quality of its water resources (NITI Aayog, 2019, Mehta and Pohit 2023).
Using advanced techniques for monitoring water data
Monitoring water quality on land, and in rivers and other water sources, is thus an international necessity. Within the European Union, the European Green Deal sets out goals for restoring biological biodiversity, reducing water pollution, and ensuring standards of water quality. In the United States, the Environmental Protection Agency enforces regulations to address water pollution in each state. Across the world, countries are increasingly understanding the importance of effective water quality monitoring parameters and methods.
In India too, the Government has initiated several flagship programmes for pollution control and protection of water resources, such as the Namami Gange National Mission for Clean Ganga launched by Prime Minister Modi in 2015. Seeking to rejuvenate the holy river’s waters by curbing pollution at major sites of public convergence along the river, this project underscores the need for regularly collecting and monitoring data on the river’s water quality. In this context, it is pertinent to analyse the data collection methodology and assessments in a recent comprehensive study on riverine pollution, conducted by the National Council of Applied Economic Research (NCAER). Undertaken in collaboration with the University of Chicago’s Tata Centre for Development (TCD), the study examines the quality of the Ganga’s water at selected stretches notorious for high levels of pollution (NCAER, 2020). While laying the roadmap for carrying out state-of-the-art research on environmental issues in the country, this project could also coalesce with other green programmes to meet the national goals of controlling carbon footprints and combating climate change.
The NCAER-TCD study explores the social and economic engagement of the riverine communities on the Ganga river, at locations in Uttar Pradesh and West Bengal, which are characterised by a high degree of human engagement in terms of both fishing and spiritual rituals. Traditionally, the monitoring of river water has largely been done through conventional means, by collecting water samples at periodical distances on the river, usually on a monthly basis, and analysing the samples in a laboratory. This resource-intensive and time-consuming process is often prone to human error due to possible mishandling of samples and faulty laboratory protocols. Additionally, rivers are dynamic systems whose character and course could change frequently. Such sparse data may, therefore, be unable to either accurately capture the health of the water body or adequately shape policy discussions.
Stepping in to bridge this gap, the NCAER-TCD team carried out continuous, in-situ data collection for a real-time analysis of the Ganga river water across four upstream and downstream locations in Uttar Pradesh and West Bengal. The project team mapped water quality using multiple, submersible, automated sensors attached to a boat that would sail in a zigzag pattern from bank to bank, at different times of the day on a predefined route, to gather high-resolution, spatially and temporally varying, water data. Figures 1 and 2 show the routes followed by the boats along the river in two towns of Uttar Pradesh, Unnao and Narora, respectively.
Figure 1. Boat ride route along the Unnao site in Uttar Pradesh, with sample collection points
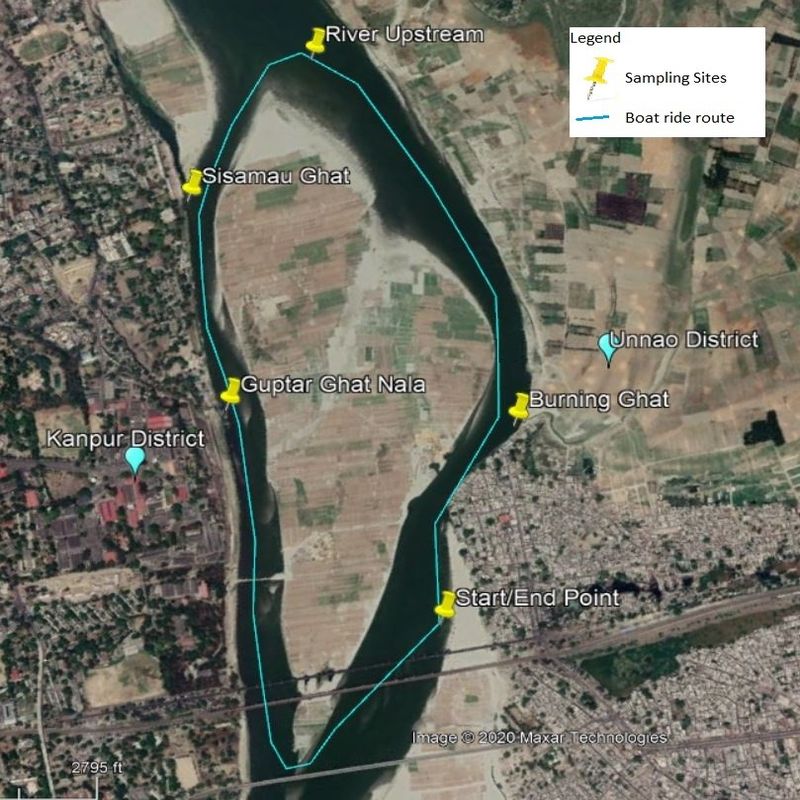
Source: NCAER (2020).
Figure 2. Boat ride route along the Narora site in Uttar Pradesh, with sample collection points
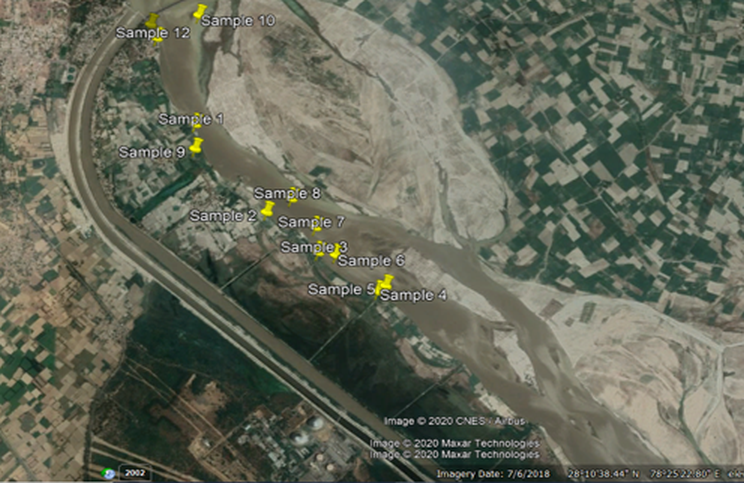
Source: NCAER (2020).
In order to map a particular region of the river, the sensor heads were immersed into the water at a depth of 12 inches below the water surface, with the sensor platform(s) simultaneously measuring GPS location and 10-12 water quality parameters, including pH, dissolved oxygen, electrical conductivity, turbidity, temperature, Chlorophyll-a, tryptophan, and coloured dissolved organic matter, among others (see Figure 3). The boat speeds of 1-2 metres/second allowed for accurate turbidity measurements, while also capturing sensor measurements at a distance of every 15-20 metres at intervals of 10 seconds. For heatmaps, the sensor-measured data was linearly interpolated between the data points. The measurements were repeated at different locations during different seasons and times.
Figure 3. Various laboratory and sensor-based parameters measured
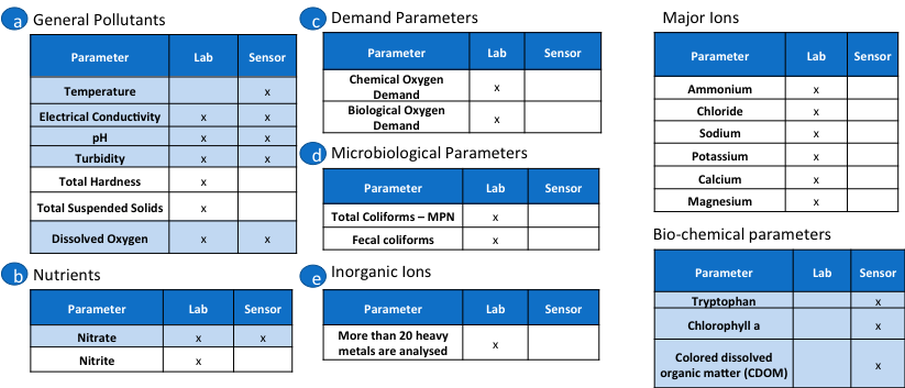
Source: NCAER (2020).
As a pioneering Water-to-Cloud study, the NCAER-TCD project also facilitated sharing on the cloud of time-stamped and geotagged data from the Ganga river for carrying out further mathematical analysis of the spread and sources of pollution, and for interpolating the available data. Such dynamic mapping of river water quality through heatmaps and other forms of visualisation can go a long way towards understanding the overall and location-specific transformation in river water quality due to the impact of weather, pollution, fishing, and general use. It can also help pinpoint the exact sources and points of pollution, thereby ensuring both effective sanitary interventions and regulatory compliance by the polluters. Further, the study assessed the implications of pollution in the river for the riverine communities that depend on it for livelihood, as well as the economic costs of river water pollution for the country.
Conclusion
The NCAER-TCD project is an apt example of how environmental data can be obtained and utilised for not only achieving climate goals, but also fructifying the charter laid down by the System of Environmental-Economic Accounts for Water (SEEA-Water) worldwide. SEEA-Water integrates a wide range of hydrological statistics across sectors into a single coherent information system, combining it with economic data to provide a policy direction to environmental objectives. The importance of water as a key component of ecosystem accounting is also reflected in the UN’s Sustainable Development Goal 6, which focuses specifically on improving water quality by reducing pollution, eliminating dumping and the release of hazardous materials, reducing the proportion of untreated wastewater, and increasing recycling and safe reuse of water. Innovative methodologies such as those proposed in SEEA-Water and used in the NCAER-TCD project can play a significant role in meeting these targets by providing a framework for the development and measurement of environmental indicators.
India can attain these goals only if it lays down a panoptic policy to fulfil its data needs for safeguarding its environmental and natural resources from climate change and other contingencies.
Views expressed by the authors are personal.
Further Reading
- Mehta, A and S Pohit (2023), ‘The Challenge of Gender Access to Clean Water’, The Pioneer, 29 March.
- NCAER (2020), ‘Livelihood and Health Challenges of Riverine Communities of the River Ganga’, Report, National Council of Applied Economic Research, New Delhi.
- NITI Aayog (2019). ‘Composite Water Management Index’, Report, August.
- Pal, BD, S Pohit and J Roy (2012), ‘Environmentally Extended Social Accounting Matrix (ESAM) for Climate Change Analysis in India’. Available at SSRN.
- Pohit, S and A Mehta (2022), ‘Polluting a river is a sin against it!’, The Pioneer, 27 September 27.
- UNESCO (2023), ‘The United Nations World Water Development Report 2023: Partnerships and Cooperation for Water’, Report, UNESCO World Water Assessment Programme.

By: sakshieq 24 September, 2024
Effective control of water pollution in India hinges on robust data collection and monitoring, as demonstrated by the NCAER and TCD project on the Ganga. The Glasgow Climate Pact emphasizes the importance of innovation and collaboration in achieving climate goals, underscoring the need for informed policy interventions.