

 14 April, 2021


Delay in acceptance or refusal of vaccine against Covid-19 despite its availability, is a key hindrance in achieving optimal vaccination coverage among populations around the globe. Using data from a Facebook survey – conducted in partnership with University of Maryland and Carnegie Mellon – this article explores vaccine hesitancy in India, and trends across states and over time.
On 16 January 2021, India rolled out the world’s largest vaccination programme, marking the beginning of an effort to vaccinate a population of 1.3 billion against Covid-19. The central government's strategy was to first vaccinate the health workers and the frontline workers, followed by people above 60 years of age and those over 45 years with comorbidities from 1 March onwards. Phase three of the vaccination drive starting from 1 April focusses to cover all people more than 45 years of age. Some states have fared better than others during the first phase of the drive, with a little over 11 million vaccinated until 28 February, against a target of 30 million. Various media reports and anecdotal evidence suggest that lack of confidence and trust in health services, concerns regarding safety and efficacy of vaccines, and complacency of not being infected so far, were the major challenges in the first phase. The second phase of vaccination drive kicked off with the Prime Minister of India being vaccinated on 1 March – a step that might go a long way in building public trust.
In the period before the vaccine was rolled out, most dialogue and public discussion was centred around the supply-side constraints that the government was expected to face. Therefore, to smooth out the massive drive of vaccinating a large population, the Ministry of Health and Family Welfare (MoHFW) has tried to ensure that all logistical arrangements are in place by ramping up vaccine storage facilities, developing the Co-WIN web portal and mobile application for registration, conducting trainings of vaccinators, and undertaking dry runs of vaccination activities in states (MoHFW, 2020a). However, insufficient attention was given to the demand-side hurdles such as vaccine hesitancy (MacDonald 2015, Schuster et al. 2015).
Vaccine hesitancy, defined by the World Health Organization (WHO) as a “delay in acceptance or refusal of vaccines despite availability of vaccination services”, is a key hindrance in achieving optimal vaccination coverage among populations around the globe (Larson et al. 2018). In the first few weeks of vaccine roll-out, media reports indicated vaccine hesitancy among healthcare workers in states such as Tamil Nadu and Punjab. Several state-level and regional surveys have since corroborated these anecdotal reports (Jayadevan et al. 2021).
In this article, we report findings from an ongoing global online survey of Facebook users, exploring the spatio-temporal trends in vaccine hesitancy, the reasons behind vaccine hesitancy, and its association with actual coverage of Covid-19 vaccination in India.
The COVID-19 Symptom Survey: A unique data source in challenging times
University of Maryland and Carnegie Mellon University (Reinhart and Tibshirani 2020)1, in partnership with Facebook, have been conducting the COVID-19 Symptom Survey (CSS), daily in more than 200 countries and in over 50 languages since April 2020. Facebook users around the world are invited to take part in this voluntary survey to self-report Covid-19-related symptoms, experience with Covid-19 tests, contact with others, mental health and economic security, disruptions in routine health services, vaccine hesitancy, and other related topics. The survey is designed to provide valuable information to help monitor and forecast how Covid-19 may be spreading, without compromising the privacy of the people who participated in the survey. Facebook does not share background information2 of the survey respondents with the academic partners of the study, and in turn, the latter do not share individual survey responses with Facebook.
The CSS data present a unique opportunity to explore the spatio-temporal variation in vaccine hesitancy in India, particularly at a time when large-scale data collection is challenging. India has traditionally relied on in-person data collection for household surveys; in the absence of reliable sampling frameworks, web surveys have generally been on the sidelines (Couper 2000, Couper and Miller 2008). CSS leverages Facebook’s active user base (FAUB) of over 300 million users (Keelery 2020) as the sampling frame, which gives it a unique advantage. However, since the FAUB may not be representative of the general population at the state and national levels, the dataset includes a survey weight for each respondent so that any weighted analysis based on the CSS sample can be used for drawing inference at the level of the target population (Barkay et al. 2020). The survey was launched on 23 April 2020 in India and is currently ongoing with more than 1.5 million interviews as of 27 Feb 2021. The survey is modified from time to time through the inclusion of new sets of questions. Questions on vaccinations have been fielded since 21 December 2020 and have thereafter been asked daily. We base our analysis on 277,844 responses from Facebook users on questions regarding vaccination until 27 February 2021.
What is the extent of vaccine hesitancy?
The aggregate weighted estimates at the national level suggest that about 45% of those surveyed would definitely choose to get vaccinated if it were available on the day of the survey, and this figure goes up to 71% if we also take into account the ‘Probably Yes’ responses. A significant proportion of individuals (29%) showed hesitancy in taking up the vaccination. More than 16% showed reluctance (‘Probably Not’) and 12% were definite about not taking the vaccine (Table 1). We also looked at the estimates of people expressing vaccine hesitancy from other data sources. The Delhi NCR (National Capital Region) Coronavirus Telephone (DCVTS)- round 4, conducted between 23 December 2020 and 4 January 2021, estimated 39% vaccine hesitancy among people in Delhi NCR. This includes 20% who were certain about not taking the vaccine.
Table 1. Survey question: “If a vaccine to prevent COVID-19 (coronavirus) were offered to you today, would you choose to get vaccinated?”
|
Response options |
Frequency |
Weighted percentage |
|
Definitely Yes |
100,788 |
45 |
|
Probably Yes |
61,400 |
26.3 |
|
Probably Not |
38,590 |
16.3 |
|
Definitely Not |
30,081 |
12.4 |
|
Total |
230,859 |
100 |
Source: COVID-19 Symptom Survey.
To those who responded by saying they would definitely not get vaccinated (if offered on the day of the survey), CSS included a question about the reasons behind their hesitancy (Figure 1). The top three responses included “I plan to wait and see if it is safe and may get it later”, “I think other people need it more than I do right now”, and “I am concerned about possible side effects of a COVID-19 vaccine”. However, there might be a silver lining to this growing concern of reluctance – the responses indicate that although they were not ready to get vaccinated at the time of the survey, conditional upon the proof of safety and efficacy of the vaccines and lack of adverse side effects after vaccination, they might choose to get vaccinated in the near future.
Figure 1. Reasons reported for ‘Definitely Not’ getting a Covid-19 vaccine
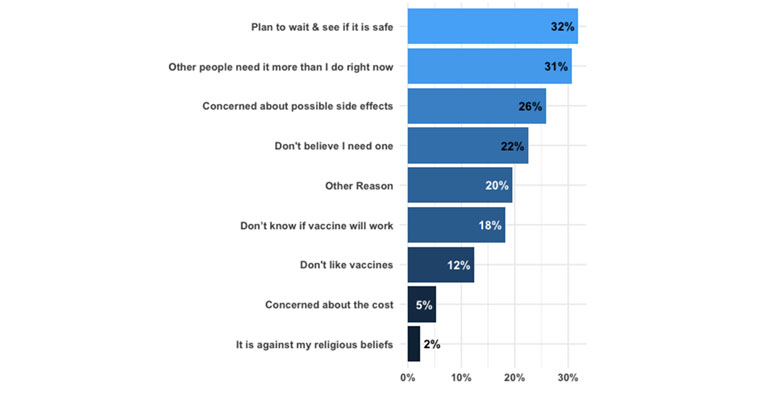
Source: COVID-19 Symptom Survey.
Notes: (i) This figure includes respondents who definitely did not want to take the vaccine on the day of the survey (N = 8,405). (ii) This question was included in CSS on 6 February 2021.
Spatial variation in vaccine hesitancy
Next, we explore the spatial variation in vaccine hesitancy by estimating the prevalence of vaccine hesitancy across states in India. From Figure 2 below, it is clear that Tamil Nadu, Punjab, Jammu and Kashmir, Haryana, and Andhra Pradesh, are the top-five states in terms of vaccine hesitancy. On the other hand, vaccine hesitancy is lower in Kerala, Chhattisgarh, and Odisha.
Figure 2. Vaccine hesitancy across states and union territories in India
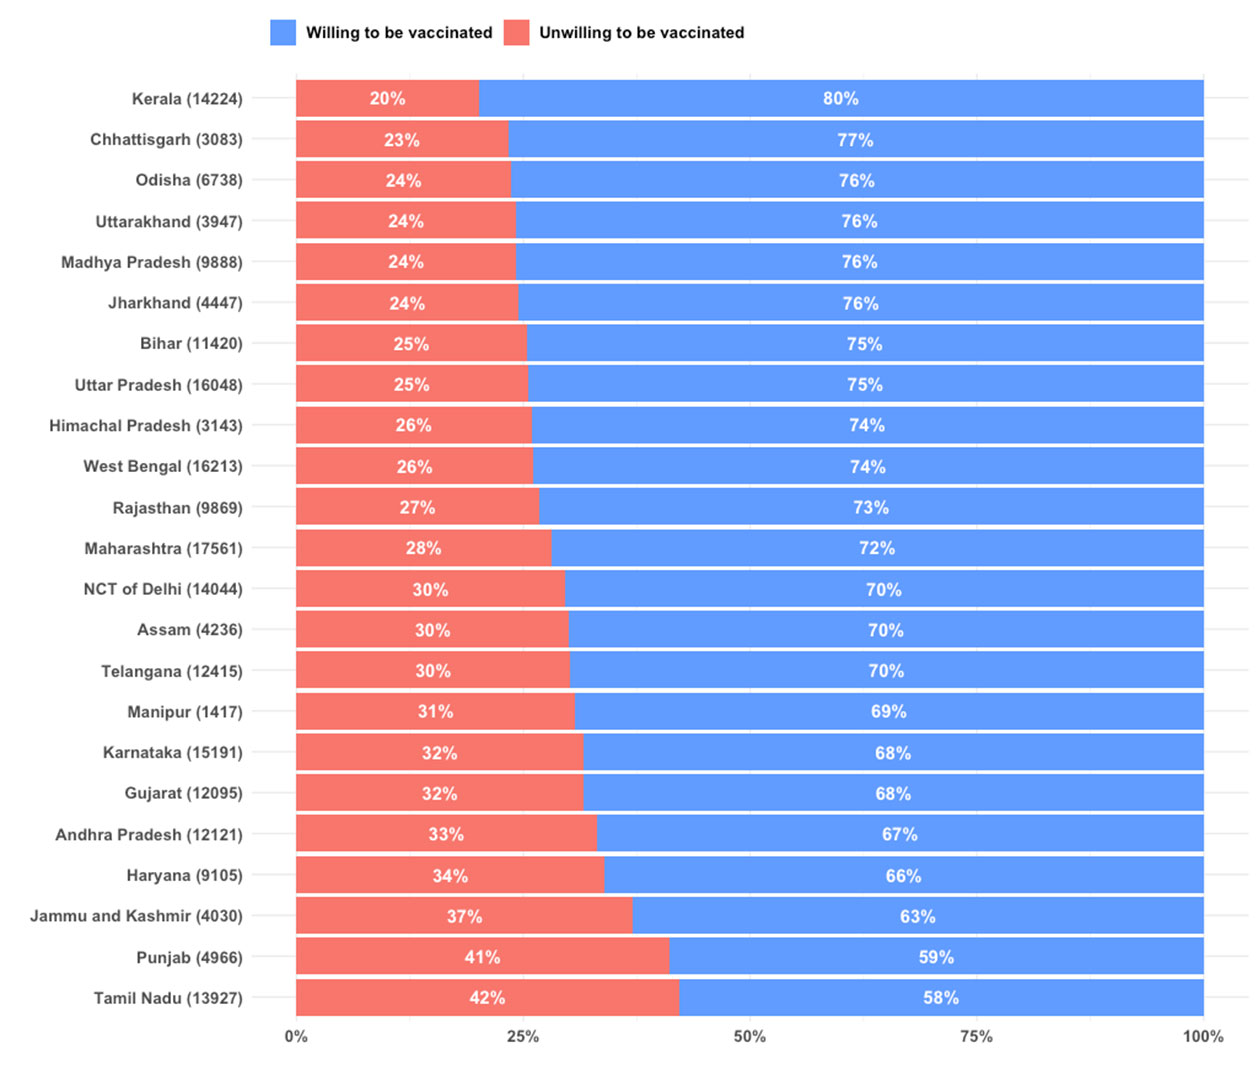
Source: COVID-19 Symptom Survey data.
Notes: (i) Unwilling to be vaccinated (hesitancy) is based on ‘Probably Not’ and ‘Definitely Not’ responses. (ii) Sample sizes for different states are given in parentheses.
Temporal trends in vaccine hesitancy
Since the vaccine hesitancy questions were added to the CSS questionnaire on 21 December 2020 and continued to be part of the survey, we explored the temporal trend in vaccine hesitancy in selected states. We plot the seven-day moving average in vaccine hesitancy for selected states from different regions of India. This includes states that reported the highest (Tamil Nadu) and the lowest (Kerala) vaccine hesitancy.
Figure 3 suggests a declining trend in vaccine hesitancy in states like Uttar Pradesh, Maharashtra, and Gujarat. On the other hand, in Andhra Pradesh, and to some extent in Tamil Nadu, the level of hesitancy is increasing with time. In many states, such as West Bengal, Maharashtra, Andhra Pradesh, Delhi, Punjab, and Tamil Nadu, we see a sharp uptick in hesitancy around the time when the vaccination drive was launched in India on 16 January 2021.
Figure 3. Temporal trends in vaccine hesitancy for selected Indian states
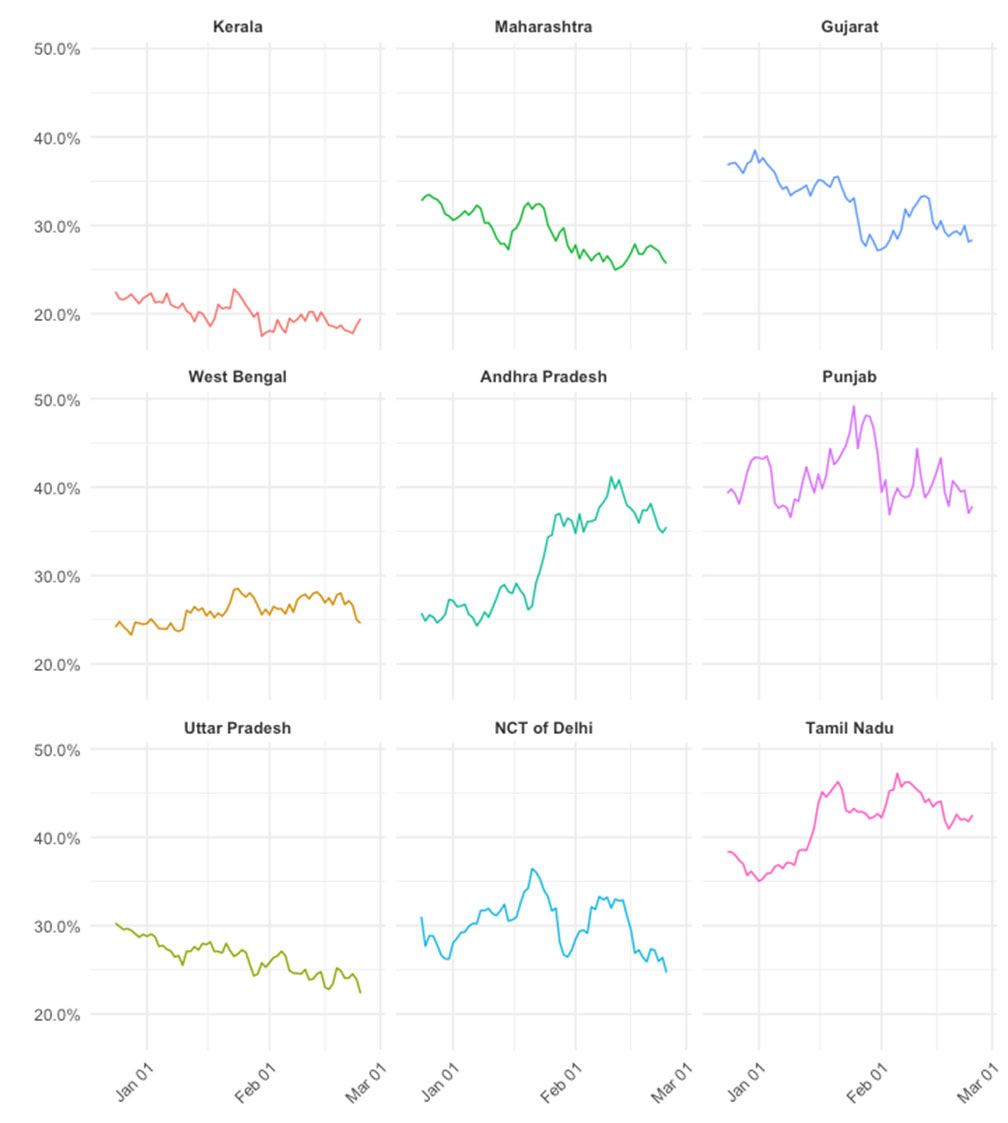
Source: COVID-19 Symptom Survey.
Note: Hesitancy is defined based on ‘Probably Not’ and ‘Definitely Not’ responses.
Association between vaccine hesitancy and actual level of vaccination
We explored the impact of vaccine hesitancy on actual vaccination coverage in the first phase of the vaccination drive. State-level vaccination numbers were obtained from the widely used covid19india.org. We consider two different denominators3 to measure actual vaccination coverage: (i) in the left panel of Figure 4, we use state-level 2019 population projections as a proxy for the first phase target beneficiaries across states, and (ii) in the right panel, we considered the state-wise target population of healthcare workers. In both graphs of Figure 4, the horizontal axis is the weighted prevalence of vaccine hesitancy as obtained from the CSS data, and the vertical axis is the actual number of vaccinations per million and vaccination coverage rate, respectively. The scatter plot and the spline regression function suggest a negative association between vaccine hesitancy and actual vaccination coverage.
Figure 4. Vaccine hesitancy and actual vaccination coverage, in the first phase of India’s vaccination drive
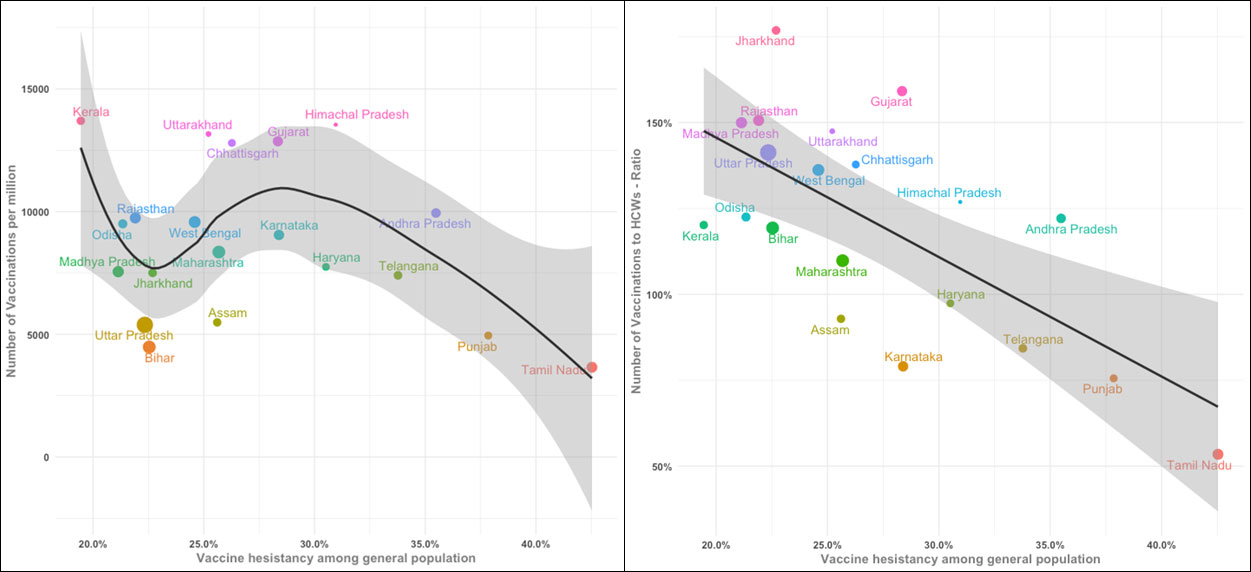
Source: Vaccine hesitancy estimates are based on COVID-19 Symptom Survey data; actual vaccination numbers are from covid19india.org.
Notes: (i) Different colours in the plot indicate clustering of states, and size of points is proportional to projected population in 2019. (ii) Since we only had data on health workers and not on essential workers who were also part of the target population in the first phase of the vaccination drive, the coverage is above 100% for some states.
Policy implications
Vaccine efficacy is the key to any vaccine approval process. Transparent and accurate information about the vaccine(s) will help alleviate apprehensions and will encourage uptake among the public. The MoHFW has identified four key areas of an effective communication strategy with regards to the Covid-19 vaccine. One of these is to address the issues around the efficacy and safety of the new vaccines. The suggested actions include identifying the traditionally known vaccine-hesitant groups and orienting credible ‘influencers’ to build trust via community engagement practices (MoHFW, 2020b). This is an important step that needs to be implemented with full effort. The CSS data also indicate that recommendations coming from WHO officials and government health officials on vaccination uptake is paid more heed as to compared to those of politicians. Disparities across states in hesitancy and in coverage tell us that state-level targeted measures are needed to address the issues in a context-specific manner. Effective communication by building trust is paramount for alleviating confusion and hesitancy around vaccination.
Notes:
- Both universities collaborated with the broader public health community in designing the survey.
- Information that was part of a user’s profile but not part of the survey.
- Ideally, one would use the estimated number of target beneficiaries (health workers and essential workers) in the denominator to calculate the Covid-19 vaccination coverage rate. However, reliable figures for each state on health workers and essential workers are not readily available.
Further Reading
- Barkay, N, C Cobb, R Eilat, T Galili, D Haimovich, S LaRocca, K Morris and T Sarig (2020), ‘Weights and Methodology Brief for the COVID-19 Symptom Survey by University of Maryland and Carnegie Mellon University, in Partnership with Facebook’, arXiv preprint arXiv:2009.14675.
- Couper, Mick P (2000), "Web surveys: A review of issues and approaches", Public Opinion Quarterly, 64(4): 464-494. Available here.
- Couper, Mick P and Peter V Miller (2008), "Web survey methods: Introduction", Public Opinion Quarterly, 72(5): 831-835. Available here.
- Keelery, S (2020), ‘Number of Facebook users India 2015-2023’, Statista.."
- Larson, Heidi, Alexandre de Figueiredo, Emilie Karafillakis and Mahesh Rawal (2018), "State of vaccine confidence in the EU 2018", Luxembourg: Publications Office of the European Union, 10: 241099.
- MacDonald, Noni E (2015), "Vaccine hesitancy: Definition, scope and determinants", Vaccine, 33(34): 4161-4164. Available here.
- MoHFW (2020a), ‘COVID-19 Vaccines Operational Guidelines’, Government of India.
- MoHFW (2020b), ‘COVID-19 Vaccine Communication Strategy’, Government of India.
- Jayadevan, R, R Shenoy and A TS (2021), ‘Survey of symptoms following COVID-19 vaccination in India’, medRxiv, 21251366.
- Reinhart, A and R Tibshirani (2020), ‘COVID-19 Symptom Surveys through Facebook’, Carnegie Mellon University (Delphi Group).
- Schuster, Melanie, Juhani Eskola and Philippe Duclos (2015), "Review of vaccine hesitancy: Rationale, remit and methods", Vaccine, 33(34): 4157-4160. Available here.

Comments will be held for moderation. Your contact information will not be made public.