

 09 January, 2019


One aspect of human well-being that has often been overlooked in survey research on low- and middle-income countries is the extent to which prejudice and discrimination diminish social welfare. This article discusses the results from a mobile phone survey dedicated to measuring explicit prejudice towards and experiences of discrimination among socially excluded groups, such as women, Dalits, and Muslims, in India.
‘Factfulness’, a new book by Hans Rosling (completed posthumously by his son and daughter-in-law) provides an excellent reminder that, despite what newscasters might have us think, many aspects of human well-being have improved dramatically in recent decades, especially in low- and middle-income countries (Rosling et al. 2018). These changes are evident in India, too. In 2015, about 75% of adults were literate, compared to only about 25% in 1960. Only 4% of infants died in the first year of life in 2015, compared to about 17% in 1960 (World Bank, 2017).
Researchers are able to quantify these stunning improvements in human well-being even where robust record-keeping systems do not exist, in part because of sample surveys, a powerful tool for estimating characteristics of a population at a low cost. One aspect of human well-being that has often been overlooked in survey research on low and middle-income countries is the extent to which prejudice and discrimination diminish social welfare.
In two recent papers (Coffey et al. 2017, Hathi et al. 2018), we discuss a new sample survey designed to help fill this gap. To our knowledge, Social Attitudes Research, India (SARI) is the first time that a mobile phone survey has been dedicated to measuring explicit prejudice towards and experiences of discrimination among socially excluded groups, such as women, Dalits (also called Scheduled Castes), and Muslims, in India. The value of this project, we think, lies not only in SARI’s ability to shed light on the current state of social attitudes in India, but also on showing the potential that mobile phone surveys hold for assessing social progress.
How SARI works
SARI is a mobile phone survey that builds representative samples of adults aged 18 to 65 by using probability-weighted random digit dialing1 and within-household respondent selection. We adjust estimates based on statistical weights constructed using demographic data from the 2011 Census. Sample selection occurs within mobile circles. To date, data have been collected and analysed for Delhi, Uttar Pradesh, Mumbai, and Rajasthan. Data for Maharashtra, Bihar, and Jharkhand have been collected and are currently being analysed. Table 1 shows SARI’s sample sizes in each state.2
Table 1. Sample details for SARI data
|
Sample sizes |
|||||
|
Year |
Men |
Women |
Total |
% household- level mobile coverage in NFHS-2015 |
|
|
Delhi |
2016 |
753 |
658 |
1411 |
98 |
|
Mumbai |
2017 |
1468 |
. |
1468 |
97 |
|
Uttar Pradesh |
2016 |
791 |
808 |
1599 |
92 |
|
Rajasthan |
2017 |
1511 |
1358 |
2869 |
94 |
|
Bihar |
2018 |
1065 |
1478 |
2543 |
90 |
|
Jharkhand |
2018 |
359 |
432 |
791 |
83 |
|
Maharashtra |
2018 |
803 |
638 |
1441 |
90 |
Where possible SARI used questions from other social surveys for comparison, including the India Human Development Survey (IHDS) and the US’ General Social Survey (GSS). Here, we highlight comparisons with questions from the GSS. Our purpose in comparing SARI’s results to the GSS is less to compare social progress in the two countries – after all, current events in the US suggest that social progress is neither linear nor uniform – but rather to show the promise that such surveys hold for analysing trends in social attitudes trends.
Findings on prejudice against women
SARI surveyors asked respondents several questions related to prejudice against women. One was about attitudes towards women’s work outside the home. The puzzle of women’s declining labour force participation in India has been much researched (Afridi 2017), but relatively little has been written about the social stigma attached to women’s work. SARI documented this stigma by asking respondents: “In your opinion, should a married woman, whose husband earns a good living, work outside the home or not?”
Figure 1 shows the percent of men and women in Delhi, Mumbai (data for women not available), urban Rajasthan, rural Rajasthan, urban Uttar Pradesh, and rural Uttar Pradesh who say that married women whose husbands earn well should not work outside the home. We find little variation across regions and little difference in the responses of men and women: about half of respondents in each place say that women should not work outside the home.
Figure 1 also shows that disapproval for women’s work outside the home is substantially higher in these regions of India than it was in the US between 1972 and 1998. When the GSS stopped asking about attitudes towards women’s work in 1998, about one in five US adults disapproved of women working. When the question was asked again in 2012 by a CNN-ORC international poll, only 2% of US adults said that they disapproved of women working outside the home.
Figure 1. Percent of adults who say that women should not work outside the home
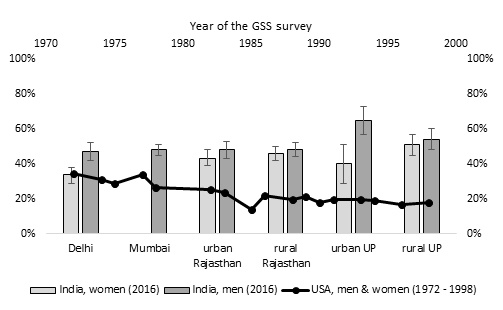 Source: SARI (2016) and GSS (1972-1998); reprinted from Coffey et al. (2017).
 Findings on prejudice against Dalits
SARI asks non-Dalits a variety of questions about their attitudes towards Dalits. Because marriage is so important for preserving caste distinctions, one of the questions that SARI asks non-Dalits is: “In your opinion, should there be a law preventing high-caste and low-caste people from marrying each other?” When respondents answer “yes” to this question, we interpret them to be voicing support for enforcing caste boundaries, even at the expense of individual freedoms.
Figure 2 finds high support for laws against intermarriage, ranging from 60% in rural Rajasthan to 40% in Delhi. Figure 2 also compares these numbers to answers to a similar question on intermarriage in the US. Between 1972 and 2002, the GSS asked White respondents in the US: “Do you think there should be laws against marriages between Blacks and Whites?” For each region of India shown here, support for laws against intermarriage is higher than it was in the US 45 years ago. However, support for laws against intermarriage in the US was nevertheless quite high until recently: only 30 years ago did support for such laws fall to less than one-fifth of the White population.
Figure 2. Percent of non-Dalit/ White adults who support a legal ban on inter-group marriage
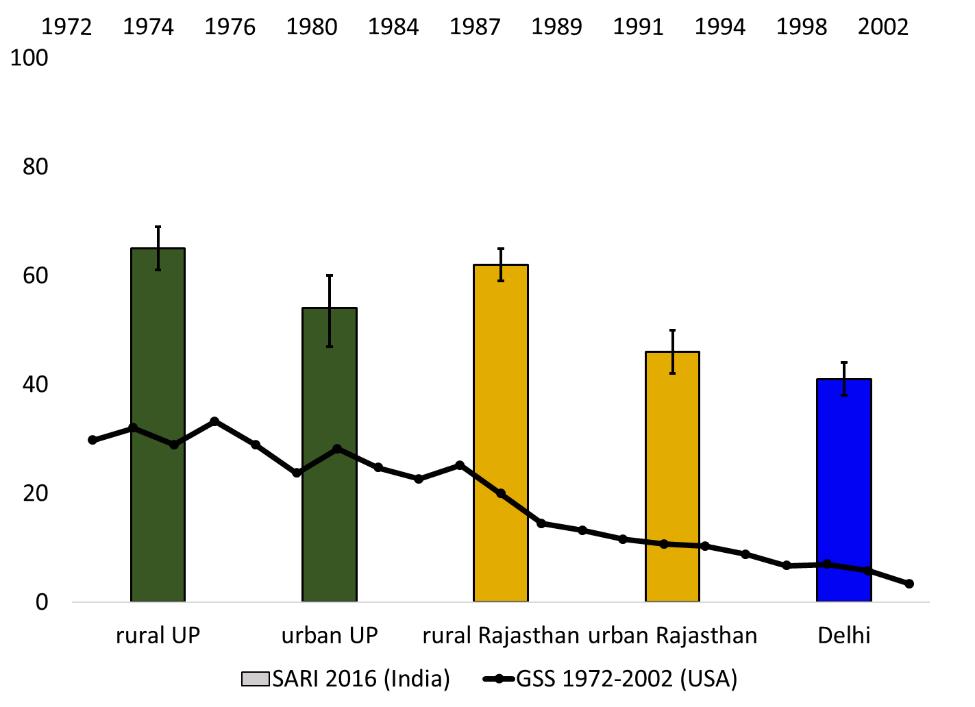 Source: SARI (2016) and GSS 1972-2002; reprinted from Coffey et al. (2017).
 Measuring experiences of discrimination among Dalits and Muslims
SARI surveyors found it relatively straightforward to ask higher caste Hindus about their attitudes towards Dalits and Muslims. As evidenced in the results shown here on intermarriage, and in other examples we give in Coffey et al. (2017), many higher caste Hindu respondents were quite comfortable expressing explicit prejudices.
Surveyors typically found it more challenging to ask Dalits and Muslims about their experiences of discrimination. Consistent with research from other contexts, respondents more often reported that discrimination was likely or very likely than that they themselves had experienced it personally. This may be because reporting experiences of discrimination can feel uncomfortable or threatening. Indeed, prior research, including research from the US, highlights many reasons why people from marginalised groups may under-report experiences of discrimination (see Hathi et al. 2018).
Nevertheless, in Mumbai and Rajasthan, where Dalits and Muslims were asked about specific places in which they experienced discrimination, many people reported having personally experienced discrimination at school or in interactions with a government official. Table 2 gives figures for each group in each place. These results are worrisome considering that schools and government institutions are supposed to provide equal treatment and create equal opportunities for people from all social backgrounds.
Table 2.Percent of adult Dalits and Muslims who say they have personally experienced discrimination at school or in interactions with a government official
|
|
Dalits |
Muslims |
||
|
at school |
by a government official |
at school |
by a government official |
|
|
Rajasthan |
17 |
35 |
11 |
30 |
|
Mumbai |
25 |
24 |
16 |
31 |
Future research
Studying prejudice and discrimination are important because they are distressing to experience and because they negatively impact education, occupation, economic- and health outcomes (Thorat 2010, Baru et al. 2010, Thorat and Desai 2012). There is also mounting evidence that high levels of prejudice and discrimination can hurt everyone in India, not just oppressed groups (Ramalingaswami et al. 1996, Coffey and Spears 2017). Our experiences designing, implementing, and analysing the SARI survey, and comparing results to comparable data such as the IHDS, have convinced us that mobile phone surveys are a feasible way to collect high-quality data on social attitudes, prejudice, and discrimination in India. We hope that the results will contribute to the dialogue on how to track the level of social indicators and the speed of social progress in India.
Notes:
- Random digit dialing is a common method for recruiting representative samples of survey respondents. SARI uses a form of random digit dialing designed around India’s mobile network. In India, the department of telecommunications assigns companies five-digit ‘series’ that they are allowed to use at the beginning of the 10-digit mobile phone numbers they sell in a particular mobile circle. The SARI team generates a sampling frame of potentially active numbers in each mobile circle by first creating a list in which series appear in equal proportion to the number of subscribers a company reports, divided by the number of series it has. We then add a randomly generated five-digit number to each series to form a 10-digit mobile number. SARI surveyors call these numbers in a random order.
- Much of the SARI data is publicly available at riceinstitute.org/data-page/. More information about survey design and data collection, as well as strategies to reduce non-sampling error, can be found in Coffey et al. (2017) and in the online documentation.
Further Reading
- Afridi, F (2017), ‘Introduction to e-Symposium: Women and work in India’, Ideas for India, 3 March 2017.
- Baru, Rama, Arnab Acharya, Sanghmitra Acharya, A K Shiva Kumar and K Najaraj (2010), “Inequities in Access to Health Services in India: Caste, Class and Region”, Economic & Political Weekly, 45(38): 49–58. Available here.
- Coffey, Diane, Payal Hathi, Nidhi Khurana and Amit Thorat (2018), “Explicit Prejudice: Evidence from a New Survey”, Economic & Political Weekly, 53(1): 46-54. Available here.
- Coffey, D and D Spears (2017), Where India Goes: Abandoned Toilets, Stunted Development, and the Costs of Caste, Harper Collins, Noida.
- Hathi, Payal, Diane Coffey, Nazar Khalid, Nidhi Khurana and Amit Thorat (2018), “Experiences and Perceptions of Discrimination among Dalits and Muslims”, Economic & Political Weekly, 53(42): 14-17. Available here.
- Rosling, H, A Rosling Rönnlund and O Rosling (2018), Factfulness: Ten Reasons We're Wrong about the World--and why Things are Better Than You Think, Flatiron Books.
- Thorat, Amit (2010), “Ethnicity, Caste, and Religion: Implications for Poverty Outcomes”, Economic & Political Weekly, 45(51): 47–53. Available here.
- Thorat, A and S Desai (2012), ‘Social Inequalities in Education’, in India Infrastructure Report 2012, IDFC Institute.
- World Bank (2017), ‘World Development Indicators, 1960–2016’.

Comments will be held for moderation. Your contact information will not be made public.