

 07 January, 2019


Slow progress of the Doha Round of WTO negotiations has led to a proliferation of regional and bilateral trade agreements, and consequent increase in trade among their members. While India continues to be among the top apparel-exporting countries, its apparel exports have stagnated in recent years. In this post, Mukherjee, Sinha, Sarma, and Paul investigate the impact of trade agreements on India’s apparel trade.
In the past decade, trade liberalisation, and development of production networks and value chains have increased the global trade of apparels. Since the phasing out of quotas in 2005 under the World Trade Organization’s (WTO) Agreement on Textiles and Clothing (WTO, 1995), total global trade in apparels has increased from US$562 billion in 2005 to US$756.8 billion in 2017, and global apparel exports went up from US$287.9 billion in 2005 to US$383 billion in 2017 (World Integrated Trade Solutions (WITS)). While the European Union (EU), the US, and China are among the top importing countries, India is among the top exporting countries for apparel and was ranked 5th in the year 2016 with a share of 4.27% (WITS, 2016). The exports of apparel from India have grown at a rate of 6.8% per annum since 2005, to reach US$17.1 billion in 2017 (WITS, 2017). India’s apparel imports during the same period grew at 22% per annum to reach US$688.42 million in 2017 (WITS, 2017). Nevertheless, India’s share in the world import of apparels is only 0.17%, with a rank of 42. This indicates that India has a large positive trade balance in this sector. The US accounted for 22.5% of India’s apparel exports in the year 2016, followed by the United Arab Emirates (UAE) with a share of 20.7%. As a region, the EU is India’s largest export destination for apparels, with a share of 35.2% in total apparel exports from India in 2016 (WITS, 2016). The US and the EU together account for around 57% of India’s apparel export market.
Regional and bilateral trade agreements’ effect on India’s apparel trade
While the WTO’s Agreement on Textiles and Clothing led to an increase in global trade and development of value chains, the slow progress of the ongoing Doha Round of WTO negotiations led to a proliferation of trade agreements, both at the regional and bilateral level. Such agreements have led to zero or preferential tariffs among members of the trade agreement and thereby helped to increase trade between them. Key exporters and importers of apparels have witnessed an increase in trade due to the signing of bilateral and regional trade agreements (Hayashi 2007, Brenton and Hoppe 2007). However, these agreements adversely affect the competitiveness of countries which are not party to such agreements.
Emerging economies like Turkey, Republic of Korea, and Vietnam, which are among the top global apparel exporting countries, are actively engaged in trade agreements. China was a top global apparel exporter even before it joined the WTO, but with its accession to the WTO in 2001, its apparel exports have further increased and today, China is both a leading exporter and importer of apparels.
India does not have free trade agreements (FTAs) with its key apparel import markets such as the EU, the US, and the UAE. While India continues to be among the top exporting countries, in recent years, India’s apparel exports have stagnated. In the financial year 2017-18, exports of apparel from India declined by 3.8% and 7.6% in dollar and rupee terms respectively (Mohammed 2018). It is, therefore, important to investigate the impact of trade agreements on India’s trade in apparels.
Table 1 presents a snapshot of the FTAs (enforced and those on which negotiations are still ongoing) between a few major exporters and leading importers of apparels.
Table 1. Select free trade agreements between major apparel exporters and importers
| Importers Exporters |
US | EU | Japan | China |
|---|---|---|---|---|
| China | No | No | Ongoing: - China-Japan-Korea FTA - RCEP | NA |
| India | No | No Negotiations have been Stalled: India-EU Broadbased Trade and Investment Agreement | Enforced: Japan-India Comprehensive Economic Partnership (CEPA) Agreement (August 1, 2011) | Ongoing: RCEP |
| Turkey | No | Enforced: Turkey-EU Customs Union (December 31, 1995) | Ongoing: Japan-Turkey Economic Partnership Agreement | No |
| Republic of Korea | Enforced: US-Korea FTA (March 15, 2012) | Enforced: EU-Republic of Korea FTA (December 13, 2015) | Ongoing: - China-Japan-Korea FTA - RCEP | Enforced: China-Republic of Korea FTA (December 20, 2015). |
| Vietnam | Enforced: US-Vietnam Bilateral Trade Agreement (December 10, 2001). | No To be enforced: Vietnam-EU FTA (Was due to be signed and enforced by 2018 but still awaiting approval from the EU Parliament). | Enforced: Japan-Vietnam Economic Partnership Agreement (October 1, 2009) | Ongoing: RCEP |
Source: Compiled from various government websites.
It can be seen from the above table that unlike India most apparel exporting countries have trade agreements with major importers of apparels such as the EU or the US or both (as is the case of the Republic of Korea). The EU and the US have high autonomous tariffs on apparel imports, but they offer zero or preferential tariffs in their trade agreements. Table 2 shows the impact of these trade agreements on India’s most exported (for example, t-shirts and singlets), and most export competitive (that is, a product which has revealed comparative advantage, for example, silk shawls and scarves), apparel products vis-à-vis India’s competitors that have trade agreements with major apparel importing countries like the EU and the US.
Table 2. Examples of tariffs imposed on apparel exports by the EU, US, and Japan
(in percentage)
| EU | ||||
|---|---|---|---|---|
| Examples of products | T-shirts and singlets | Cotton jackets | Silk shawls and scarves | |
| Autonomous rate | 12.00 | 12.00 | 8.00 | |
| Preferential rate (India1) | 9.60 | 9.60 | 6.40 | |
| Preferential rate (EU-Turkey Customs Union) | 0.00 | 0.00 | 0.00 | |
| Preferential rate (EU-Bangladesh EBA2) | 0.00 | 0.00 | 0.00 | |
| Preferential rate (EU-Korea FTA) | 0.00 | 0.00 | 0.00 | |
| US | ||||
| Examples of products | T-shirts and singlets | Cotton jackets | Silk shawls and scarves | |
| Autonomous rate applicable for Indian exports | 32.00 | 14.90 | 11.30 | |
| Preferential rate (EU-Korea FTA) | 0.00 | 0.00 | 0.00 | |
| Japan | ||||
| Examples of products | T-shirts and singlets | Cotton jackets | Silk shawls and scarves | |
| Autonomous rate | 11.20 | 11.90 | 6.60 | |
| Preferential rate under India-Japan CEPA | 0.00 | 0.00 | 0.00 | |
- India being a developing country faces preferential tariffs from EU under the Generalised Scheme of Preference (GSP).
- EBA refers to the EU’s ‘Everything but Arms Agreement’ under which LDCs (least developed countries) face zero tariffs from the EU.
Source: Compiled from various official government websites.
Concerns related to India’s apparel trade
T-shirts and singlets which is India’s largest apparel export item accounts for approximately 16% of total apparel exports from India. In this sub-category, the US imposes a tariff rate of 32%. This can severely affect India’s competitiveness vis-à-vis countries that face zero tariffs under a trade agreement with the US. Similarly, although it exports less of these items, India has a strong comparative advantage in the export of silk shawls and scarves. In this sub-category, the country faces a high tariff rate of 11.3% in the US. By contrast, the Republic of Korea which has a trade agreement with the US faces zero tariffs under the US-Korea FTA. The Republic of Korea also has an FTA with the EU and therefore enjoys zero tariffs under the EU-Korea FTA. Similarly, as Turkey is a part of the EU Customs Union, it is subject to zero tariffs from the EU. This puts India at a disadvantageous position. Further, given that the US is now taking protectionist measures and is threatening to increase tariffs, countries such as the Republic of Korea and Mexico, which have trade agreements with the US, are at an advantage because if the US implements protectionist measures, these countries under the rules of their respective trade agreements can seek compensation from the US.
Japan is also a major global importer of apparels and has a comprehensive trade agreement with India, known as the India-Japan Comprehensive Economic Partnership Agreement (CEPA). However, Japan is not among India’s top apparel export markets. Under the India-Japan CEPA, both countries reduced tariffs for the apparel sector to zero. However, as shown in Figure 1, after the CEPA was signed on 1 August 2011, apparel exports to Japan first increased but later fell, and is now constant. Imports from Japan were low and remained low and India has a large positive trade balance with Japan in apparels.
Figure 1. India’s trade in apparels with Japan (2005-2017)
(in million US$)
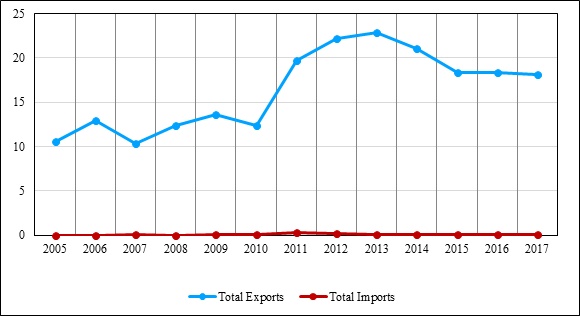
As per data from UNCOMTRADE, India is among the top ten sources of Japanese import of apparels, but its share in the Japanese market is only 0.09% vis-à-vis competing economies like China, Vietnam, and Bangladesh, which have a share of 6.46%, 1.17%and 0.34% respectively. UNCOMTRADE also reports that India has a very low share (0.05%) as an export destination for Japan and does not feature in its top 10 export destinations for apparels. Japan’s key export destinations in apparels include Hong Kong, China, Republic of Korea, US, and Taiwan. Thus, it is necessary to investigate why Indian exporters are not able to increase their export shares in Japan despite zero tariffs under the India-Japan CEPA.
India has trade agreements with a number of other countries (such as Thailand, Republic of Korea, and Malaysia) and regional groups such as Association of South East Asian Nations (ASEAN). However, India has not given zero tariffs to these partners on apparel imports. India is currently negotiating the Regional Comprehensive Economic Partnership (RCEP), which is a comprehensive economic partnership agreement between ASEAN members, Australia, China, India, Japan, Republic of Korea, and New Zealand (ASEAN, 2016), which may eventually lead to zero tariffs among RCEP member countries.
As of date, India imposes a Most Favoured Nation (MFN) tariff rate of 25% or higher on imports of apparels (India Trade Portal, 2018). However, if the country enters into trade agreements such as the RCEP and offers to open up the apparel sector under zero-for-zero tariff arrangements, it will face tough competition in the domestic market from exporters such as China, Republic of Korea, and Vietnam. Thus, there is a strong likelihood that imports of apparels, which is presently low, may increase.
The way forward
To conclude, India has a large export surplus in apparel. However, of late, there have been concerns with respect to: (a) advantages of other exporting countries which have trade agreements with key markets; (b) India’s inability to increase exports after tariff reduction through bilateral trade agreements with countries such as Japan; and (c) likely increase in imports without increase in exports if tariffs are lowered under trade agreements such as the RCEP. To address these, India may also explore the costs and benefits of negotiating trade agreements with its key export markets like the US and the EU. There is need for more research to investigate how India can use its trade agreements to increase market access for the domestic firms in key export destinations. Since tariffs may no longer be an instrument to protect the domestic industry, it is also important to examine the issues faced by the apparel industry in India and design policies to improve their competitiveness and efficiency. To improve competiveness and help industry to integrate into global value chains after signing of trade agreements such as the RCEP, the government could focus on policies and incentives that helps companies to grow and increase scale of operation, leads to skill development, supports technology adaptation, reduces logistics and input costs, and improves the ease of doing business. The apparel industry should be encouraged through the right policies and support mechanisms to invest in technology and research and development (R&D), improve quality standards, and move into high-value manufacturing and integrated production processes.
Further Reading
- Association of South East Asian Nations (2016), ‘Regional Comprehensive Economic Partnership’.
- Brenton, P and M Hoppe (2007), ‘Clothing and Export Diversification: Still a Route to Growth for Low-Income Countries?’, Policy Research Working Paper 4343, Poverty Reduction and Economic Management Network, The World Bank.
- Hayashi, M (2007), ‘Trade in Textiles and Clothing: Assuring Development Gains in a Rapidly Changing Environment’, UNCTAD Series on Assuring Development Gains from the International Trading System and Trade Negotiations, New York and Geneva.
- Mohammed, N (2017), ‘Squeezed Domestically and Globally, India's Garment Exports Are Being Stretched Thin’, The Wire.
- World Trade Organization (1995), ‘Agreement on Textiles and Clothing’. Finance: A Case for Closing Gaps’, IMF Staff Discussion Note 18/05.

Comments will be held for moderation. Your contact information will not be made public.