

 18 June, 2021


Structural transformation that involves a shift from agriculture straight to services, is a cause of concern to many scholars as an expanding service sector might be a pale substitute to technical progress in manufacturing as the main engine of growth. Analysing microdata from India for 1987-2011, this article shows that lack of pronounced industrialisation does not mean that growth is bound to fall. However, India’s service-led growth is strikingly pro-rich.
Historically, structural transformation has been remarkably similar across today’s industrialised countries. At an early stage of development, a growing industrial sector drew workers from a declining agricultural sector. At a later stage, the employment shares of both agriculture and manufacturing decreased, while services – from janitors to grocery-store clerks to accountants – became the main source of employment growth (Herrendorf et al. 2014).
Structural change and the service sector in the developing world
While this pattern fits the historical experience of most Western and East Asian economies well, economic development appears to have taken a different turn in most developing countries today. Even in fast-growing economies such as India and a number of countries in sub-Saharan Africa, the share of manufacturing jobs has barely grown, and structural transformation has taken the form of a shift from agriculture straight to services.
Figure 1 below displays this pattern for the case of India between 1987 and 2011, a time period when per capita income increased by a factor of almost three, according to the World Bank1. While the share of agricultural employment declined substantially, manufacturing employment was entirely stagnant, and the service sector (and to a lesser extent construction) absorbed the workforce leaving the fields.
Figure 1. Sectoral employment shares in India: 1987-2011
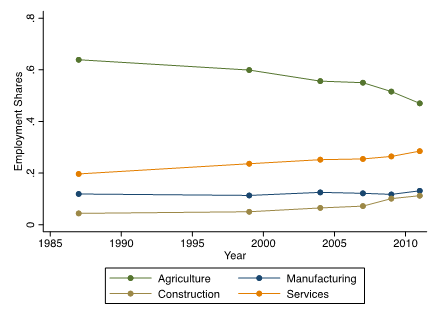
This pattern of "premature de-industrialization" (Rodrik 2016) is a cause of concern to many scholars. Technical progress in manufacturing is traditionally seen as the main engine of growth and an expanding service sector might be a pale substitute. Indeed, many see an expanding service sector as a mere corollary of growth, whereby rising incomes increase the demand for services.
But can the service sector also be a source of productivity growth per se and hence, a viable development strategy for today’s developing world? In our recent study on service-led growth in India (Fan et al. 2021), we seek to address this question using a new methodology that allows us to infer productivity growth from microdata on employment, wages, and human capital.
The service sector in India: Consumer and producer services
Any attempt to measure productivity growth in the service sector faces two important challenges. First, in many service industries it is difficult to estimate total factor productivity as it is difficult to measure firms’ physical output. Second, the service sector encompasses a range of very varied activities – retail workers, consultants, IT (information technology) specialists, and domestic housekeepers, are all classified as service workers.
In our approach, we distinguish between different types of services according to the nature of the typical buyer, and whether the value-added of such services is tradable. On one end of the spectrum are retail employees, whose services are non-tradable and almost entirely demanded by local consumers. We call these ‘consumer services’. On the other end are corporate lawyers and ICT (information communication technology) workers, who often cater to other firms. We call these ‘producer services’ – they are akin to intermediate inputs and their value-added is tradable.
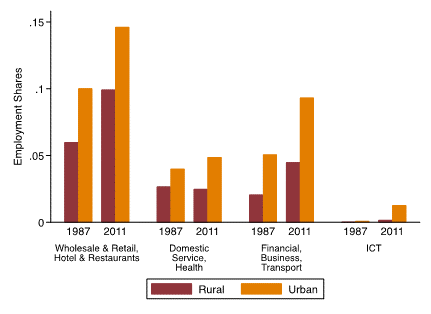
Figure 2 shows how the employment share in these different activities has evolved over time, and varies between rural and urban areas in India. Three patterns are noteworthy. First, employment increased in all service activities. Second, services are particularly concentrated in cities. While this ‘urban bias’ is especially pronounced in producer services like ICT or financial services, it is also apparent in traditional consumer service categories like retail and hospitality. Third, even though India is often hailed as a producer service hub with its call centres and expertise in ICT, consumer services are still the lion’s share of its service sector.
Figure 2. Composition of the service sector in India
At a first glance, this might look like evidence in support of the pessimistic view that, the service sector cannot be a viable development strategy for today’s developing world. Granted, there may be technical progress in the financial industry, for example, through the emergence of new financial instruments. But such process innovation might be less relevant for retail and wholesale producers. However, before drawing hasty conclusions, it might be worth noting that recent research argues that even in the US, the expansion of high-productivity firms in the retail sector has been an important source of growth (Hsieh and Rossi- Hansberg 2020).
Service-led or service-biased growth?
Is employment growth in services a source or a mere consequence of development? Because consumer services are luxuries – that is, their share in total expenditure increases as consumers see their incomes rise– the share of retail employment could be higher in cities simply because city dwellers are richer. However, an alternative (or complementary) hypothesis is that cities are service-rich because services (even traditional ones) are more productively provided there. Similarly, the rising employment share over time may reflect rising incomes (’service-biased’ growth) but could alternatively reflect sector-specific productivity gains (‘service-led’ growth).
The key object of our analysis is the income elasticity of consumers’ service demand. In other words, if income increases by 1%, by how much does spending for consumer services increase? In our study, we estimate this elasticity using microdata from the 2011-12 National Sample Survey (68th round) on consumption expenditures. We then use this model as an accounting framework to estimate productivity growth in agriculture, manufacturing, consumer services, and producer services for roughly 400 Indian districts since 1987.
The large and unequal welfare impact of service-led growth in India
Our main finding is that productivity growth in services – even traditional ones – must have been large to explain the extent of ‘tertiarisation’ (shift to the service sector) in the Indian economy. In other words, growth was largely service-led. Using our estimated model, we can also quantify the welfare effect of productivity growth in the service sector and compare it with that of other sectors. More precisely, we ask the following question: Suppose no productivity growth had been taken place between 1987 and 2011 in a particular sector. By how much would this have reduced real income of consumers in 2011?
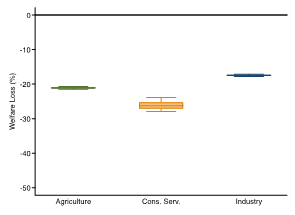
In the left panel of Figure 3, we report this number for the average consumer in India2. The salience of service-led growth is apparent – real income would have been 30% lower if productivity in services had been stagnant since 1987. For agriculture this number is around 22%, and for manufacturing it is 18% (left panel of Figure 3). Hence, the welfare impact of service-led growth is similar to that of productivity growth in agriculture and larger than the aggregate impact of industrial productivity growth3.
Figure 3. Source of growth: Aggregate and distributional consequences
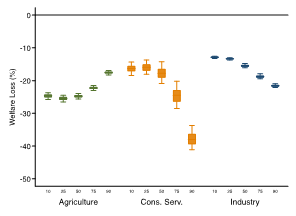
Overall, this is good news for economic development in India. The lack of pronounced industrialisation does not mean that growth is bound to fall. A sourer news is that service-led growth is strikingly pro-rich. In the right panel of Figure 3, we break down the welfare gains across five quantiles of the income distribution. While growth in consumer services accounts for almost 40% of real income growth for consumers at the top of the income ladder, this effect is only half as large for consumers below the median. The exact opposite is the case for productivity growth in the agricultural sector, whose main beneficiaries are low-income households.
Two factors lead to this stark discrepancy. First, rich consumers spend a larger share of their income on services, while agricultural goods are necessities and are particularly relevant for poor households in terms of the percentage of income spent on these goods. Second, most services are local goods and productivity growth in services is higher in urban locations where the average household is richer4.
Concluding remarks
Our findings imply that productivity growth in the service sector was an integral part of India’s growth trajectory. Understanding how exactly this productivity growth came about is a question of first-order importance, particularly when we think about policies. Moreover, is service-led growth unique to the Indian experience or also important in other developing countries? If so, the absence of employment growth in the manufacturing sector might be less concerning than previously thought.
A version of this article has appeared on VoxDev.
I4I is now on Telegram. Please click here (@Ideas4India) to subscribe to our channel for quick updates on our content.
Notes:
- These data are from the World Bank (https://data.worldbank.org/indicator/NY.GDP.PCAP.KD). To put this in context, this corresponds to about 50 years of growth at a rate of 2%, the historical rate of economic growth in the US.
- As explained above, producer services are an input into the production of manufacturing goods. The results for industrial sector shown in Figure 3 are therefore the combination of productivity growth in manufacturing and in producer services. In Fan et al. (2021), we show that the direct role of producer services is quantitatively small.
- These differences are both economically and statistically significant as seen in the confidence intervals, that our methodology, which is based on microdata, allows us to compute. A confidence interval is a way of expressing uncertainty about estimated effects. If it is a 95% confidence interval, it means that if you were to repeat the experiment over and over with new samples, 95% of the time the calculated confidence interval would contain the true effect.
- Our conclusions remain true when we account for the growth of export services, most notably, in the IT sector. These services are clearly not local goods, and their importance is growing over time. Yet, considering their importance does not alter our main conclusions – at least until 2011 which is the endpoint of our study.
Further Reading
- Fan, M, M Peters and F Zilibotti (2021), ‘Service-Led or Service-Biased Growth? Equilibrium Development Accounting across Indian Districts’, NBER Working Paper No. 28551.
- Herrendorf, Berthold, Richard Rogerson and Akos Valentinyi (2014), “Growth and Structural Transformation”, Handbook of Economic Growth, 2: 855-941.
- Hsieh, Chang-Tai and Esteban Rossi-Hansberg (2020), ‘The Industrial Revolution in Services’, Working Paper, Princeton University.
- Rodrik, Dani (2016), “Premature Deindustrialization”, Journal of Economic Growth, 21(1): 1-33. Available here.

Comments will be held for moderation. Your contact information will not be made public.