

 12 January, 2018


Bhadury and Pohit describe NCAER’s new ‘nowcasting’ model, which seeks to predict India’s GDP numbers at frequent intervals − typically on a monthly or quarterly basis − by exploiting the incremental information in published data on economic indicators.
In the words of Dr. Lawrence Klein1, “Models go out of date fast. Data base gets revised, new kinds of economic problems come to the fore; and sometimes behavior changes. India appears to be in need of a serious model building effort, designed to function as an ongoing effort, over many years, turning out rolling forecasts every month or two on the most refined time period possible...”
Over the years, NCAER (National Council of Applied Economic Research) has developed several models for forecasting and policy analysis. At present, NCAER relies on an econometric model for forecasting quarterly GDP (gross domestic product) and overall prices. In addition, NCAER has also developed what is essentially a structural model of the Indian economy, with a medium-term perspective. A salient feature of the model is that it incorporates sources of productivity growth, which enables assessing the impact of foreign capital, boost in agricultural growth, and infrastructure development on the economy. This model is essentially used to forecast GDP for the medium term, and for policy analysis. Both these models have primarily used databases from the last decade. The Central Statistics Office (CSO) has replaced the earlier 2004-05 base year with 2011-12, and updated the National Account Statistics (NAS) methodology to align with more recent international guidelines. Subsequently, the databases on the Indian economy have undergone substantial revisions in the wake of recent changes in the GDP methodology, and measurement issues with regard to price indices. Currently, both these models are fully operational.
However, the first release of quarterly GDP/GVA2 (gross value added) growth is published approximately 7-8 weeks after the end of the reference quarter. Importantly, CSO’s growth estimates avoid assessing the current state of the economy. In order to reduce the time lag between the actual growth during a reference quarter and the official release of the quarterly growth estimates, we are developing a new ‘nowcasting’ model at NCAER. Nowcasting models try to capture the flow of data releases in real time, throughout a week and month within a quarter. Accordingly, we update the GDP/GVA growth estimates by using relevant data releases that are published within the same quarter. Our model exploits a large number of correlated data series, and tries to extract potentially relevant signals about the state of the economy. The Dynamic Factor Model (DFM) can capture such relevant signals from large number of data releases and, at the same time, help avoid the so-called ‘curse of dimensionality’3 problem. It has received increasing attention in the recent macro-econometrics literature and can help identify a few dynamic factors that can represent co-movements in a large number of time series data4. The time series data can typically represent different measures of economic activities within an economy and, include data on domestic production, prices, manufacturing turnover, construction, business surveys, labour market statistics, interest rate, monetary aggregates, stock market indices, and miscellaneous indicators that are available at more frequent intervals (weekly/monthly). Econometric estimation is undertaken to identify dynamic factors for each of the sectors based on the realised high-frequency data that are available for the relevant sectors.
Our new nowcasting model-building effort is aimed at successfully estimating such dynamic factors using data-shrinkage techniques, and nowcasting Indian GVA numbers at frequent intervals − typically on a monthly/quarterly basis − by exploiting the incremental information in published data on economic indicators. In other words, nowcasting involves an exercise of predicting the present, the very near future, and the very recent past − and that means it is more effective in shorter horizon forecasting. The model is expected to accurately estimate and forecast the rate of growth of the Indian economy.
Table 1. Indicators used for quarterly estimates of non-agricultural production in GVA growth
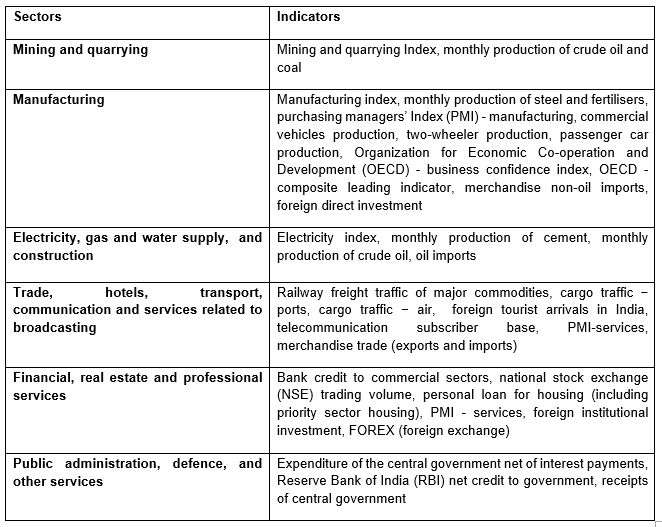
The availability of real-time GDP measures can be helpful for the Indian government. Currently, nowcasting models are used by many institutions worldwide, particular central banks, and the technique is used routinely to monitor the state of the economy in real time. Additionally, traditional approaches to time-series estimation and forecasting in economics require that the variables be of the same frequency. This often causes a problem since most macroeconomic data is reported at different intervals and frequencies. Mixed-Data Sampling (MIDAS) method estimates and forecasts models where the dependent variable is available at a lower frequency than one or more of the independent variables. Unlike the traditional aggregation approach, (MIDAS) method uses information from every observation in the higher frequency space. In our modelling approach to forecast GVA growth, we are employing the MIDAS technique to get more accurate growth projections.
Table 2 shows our projected growth for the second quarter of 2017-18 for eight broad sectors.
Table 2. Estimates of GVA growth for 2017-18:Q2
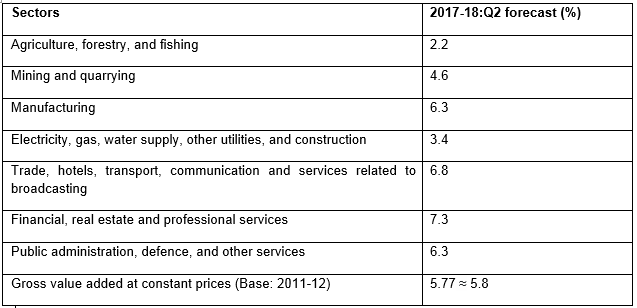
Note: Due to lack of high-frequency indicators in agriculture, growth in the agriculture sector is projected based on ARIMA (autoregressive integrated moving average) Model. ARIMA forecasting is a method of forecasting values for a single series based upon an ARIMA model.
The World Bank is successfully making use of the night light intensity data for tracking economic growth in the region. This will be useful in a country like India with a large informal economy and deep institutional constraints. As a next step, we are planning to integrate high-frequency geospatial satellite data on night light intensity and other such variables mimicking economic activity into our model. This is expected to offer more accurate quarterly projections of the GVA growth estimates at a monthly frequency.
These results were presented at the Malcolm Adiseshiah Mid-Year Review of the Indian Economy 2017-18’’ organised by NCAER in New Delhi on Saturday, 11 November 2017. The views expressed are personal.
Notes:
- Klein won the Nobel Prize in Economic Science in 1980 for the creation of econometric models and their application to the analysis of economic fluctuations and economic policies.
- Gross value added (GVA) is broadly defined as the value of output less the value of intermediate consumption. It measures the contribution to an economy of an individual producer, industry, sector, or region.
- The curse of dimensionality is a situation, where the number of explanatory variables in a model exceeds the number of observations on such variables. This leads to insufficient degree of freedom to estimate a full model.
- Time series refers to a sequence of values for a variable over time at consistent time intervals.

Comments will be held for moderation. Your contact information will not be made public.