

 20 November, 2016


R Nagaraj, Professor of Economics at IGIDR, summarises the key points of controversy around the methodology and implications of the new GDP series.
This is the last of a four-part series.
Gross Domestic Product (GDP), despite its known limitations, is the most used summary statistic of macroeconomic performance. It is a public good, produced by the Central Statistical Office (CSO). It is also a politically sensitive measure, as policymakers often take credit for high and rising GDP growth rate.
New methodology and its implications
The base year of National Accounts Statistics (NAS) is usually revised once in a decade to accommodate changes in economic structure, and relative prices, and to incorporate newer databases and improved methodologies. India’s recent revision to the base year 2011-12 has adopted the latest United Nations System of National Accounts, 2008 (UN SNA, 2008), introducing numerous changes, of which the main and relevant ones are the following:
- Replacing GDP at factor cost (GDPfc) and GDP at market prices (GDPmp) with gross value added at basic prices (GVAbp) and GDP respectively – as mostly practiced in advanced economies.
- Estimating GDP of private corporate sector (PCS) directly from the audited balance sheets, following an ‘enterprise’ approach replacing the earlier establishment approach.
- Use of PCS data for estimating manufacturing sector GVA, by mostly discarding the Index of Industrial Production (IIP) and Annual Survey of Industries (ASI).
- Estimating non-farm unorganised sector output using a production function, and transferring quasi corporations (QCs) (non-household enterprises in manufacturing and services sectors maintaining financial accounts) from the unorganised sector to PCS, and assuming their growth rate to be the same as PCS.
NAS re-basing usually alters the absolute GDP size marginally, but rarely, if ever, its growth rates depart from the older estimates; nor does its structure gets modified drastically. But this time was different, with the following significant changes:
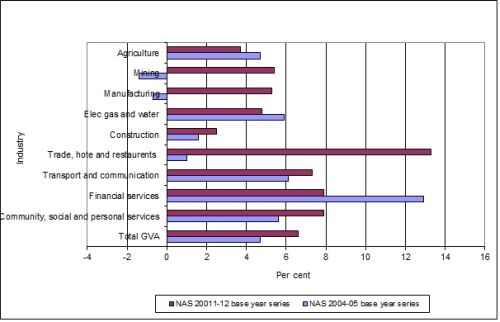
- Absolute GDP size in the new series is smaller by 2.3% in the base year (2011-12), compared to that in the older series. Annual GDP growth rate at 6.2% in 2013-14 (and its nine-fold sectoral or industrial distribution) is higher than that in the old series at 4.8%; for some sectors, even the direction of change is different. For instance, for 2013-14, manufacturing sector growth rate has moved from (-) 0.7% in the old series, to (+) 5.3% in the new series (Figure 1)1
Figure 1. Disaggregated GDP growth rates for 2013-14
- Further, every new quarterly data released during the last 18 months has raised fresh questions and doubts about the accuracy of the GDP estimates, thus denting their credibility. To illustrate, after the latest revision in January 2016, the absolute GDP size in the base year (2011-12) got reduced by 3.4% compared to the older series (against 2.3% in the January 2015 release). It means the growth rates in the subsequent years would get enlarged correspondingly. To best of my knowledge, never before have the base year estimates got modified with subsequent revisions thus, questioning the sanctity of the base year estimates (Rajakumar and Shetty 2016). This is likely to affect the estimates for the previous years, when the back series are prepared.
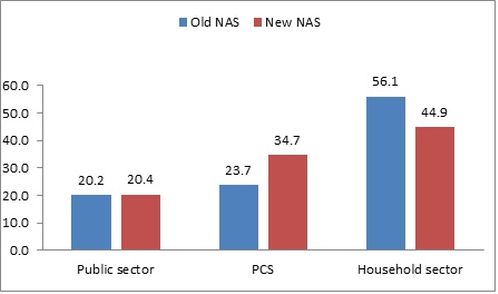
- Further, GDP’s structure is also different now. While public sector’s share in GDP remains unchanged, the share of PCS is higher in the new series by about 11 percentage points (from 23.7% to 34.7%), and the share of unorganised (or household) sector declined from 56.1% to 44.9% (Figure 2). Similarly, PCS’s saving and capital formation rates are also higher in the new series compared to the old. It is unclear how much of the change in GDP composition represents reshuffling of the sub-sectors (as mentioned above), and how much of it is due to the methodological changes introduced in the new NAS.
Figure 2. Institutional composition of GDP in old and new NAS series for 2011-12
As the new growth numbers are quite at variance with other macroeconomic data, their veracity is widely suspected, leaving policymakers and data users at a loss to understand the underlying macroeconomic trends. However, driven by their practical needs, financial brokerages have prepared alterative indices – at least one of them has estimated GDP growth rates on the lines of the “Le Keqiang index” prepared for China.
Dismissing the foregoing criticisms as minor, the statistical establishment has consistently defended its new estimates claiming them to be benchmarked against the best international practices, based on newer methods and better datasets, following UN SNA 2008 guidelines. This is at the heart of the conundrum, with the CSO and its critics yet to find a common ground to resolve the debate. Some of the principal changes made in the new series, and their implications are very briefly discussed below2.
The controversy
Historically, PCS (more precisely, non-financial PCS) was small. Its output mostly came from a small number of large companies, accounting for most of the paid-up capital (PUC) – as captured in the purposive sample of the well-maintained RBI dataset. The sample estimates were then ‘blown-up’ (scaled-up) for the PCS universe (that is, all registered companies). However, the last three decades have witnessed a phenomenal growth in the number of registered companies, diversifying away from manufacturing sector into services, especially in the financial sector. But their contribution to domestic output remains unknown as they mostly do not file their audited balance sheet with the registrar of companies (ROC) – a statutory requirement. Since the PUC of the universe of working companies is unknown, the blowing-up method, it is widely accepted, could have led to misleading estimates. To illustrate, for 2005-06, PCS’s share in GDP as per NAS was 18%, but an alternative estimate based on CMIE’s (Centre for Monitoring Indian Economy Pvt. Ltd.) corporate database was about 8% of GDP (Nagaraj 2009). Admittedly, CMIE did not capture output of smaller companies, but the official estimate is too large account for the omitted companies, and hence puts a question mark on the correctness of the official estimate.
Similarly, unorganised sector output was widely believed to have been underestimated as it was indirectly estimated as a product of (point estimates of) output per worker and number of workers employed3.
The new series, in a first, has estimated PCS’s GDP directly using company balance sheets obtained from Ministry of Corporate Affair’s (MCA) new database of about 500,000 companies for just two years (2011-12 and 2012-13). As these companies accounted for 85% of PUC of PCS, it is contended, any error in the blowing-up of estimates for the remaining 15% of PUC is unlikely to have made much difference.
Use of MCA database is welcome, but two problems (as CSO has admitted) seem to have vitiated the outcome: (i) aggregate revenue estimates from company balance sheets are significantly different from those obtained from disaggregated revenue data, affecting the level as well as the growth rates of GVA in PCS; and (ii) since the number of companies in the MCA database plummeted to 300,000 – or, by 40% – in 2013-14 and beyond, applying the blowing-up factor prepared with the smaller number of companies and blowing it up to the universe of over 900,000 companies, could have, one suspects, potentially over-estimated the GVA in the subsequent years, affecting the growth rates. Therefore, critics wonder if the remedy of using the huge MCA database has unwittingly proved to be worse than the disease.
The new methodology seems to have particularly affected the manufacturing sector estimates. The sector’s share in GDP has risen to 17-18%, from 14-15% earlier; its growth rate is systematically diverging from that based on both IIP and ASI. Admitted, IIP underestimated the growth rate for recent years due to its outdated base year. However, since the new estimates are significantly higher than even those obtained from the ASI (which are widely accepted to be sound), there is a reasonable basis to question the validity of the new estimates.
The unorganised sector’s share in GDP has shrunk, one suspects, on account of a decline in output per worker estimated using the new method. This is surprising, since early on the view was one of underestimation of output in the unorganised sector. If the new method has shrunk the size of the estimates, the question arises as to how one reconciles the two sets of estimates. Can we accept the new estimates to be correct simply because they are obtained from seemingly rigorous method, without critically examining the underlying methodology?
Many believe that much of the dispute about GDP growth rates is on account of faulty deflation procedure, and because of the currently anomalous situation of declining WPI (on account of the steep fall in international oil prices) and rising CPI. There may be some truth in this, but the observed variations are perhaps not related to the GDP revision.
Concluding remarks
If the doubts expressed and questions raised above are valid, then the veracity of the revised GDP series seems suspect. As every release of new data raised more questions than provide answers – as demonstrated in the wide media coverage– there is evidently an urgent need to thoroughly re-examine the entire GDP revision process. I recommend conducting a statistical audit of the new NAS series by setting up a credible and independent body of national and international experts. Further, MCA database and the parameters used for blowing-up sample estimates for the universe of companies – which seems to be at the heart of debate – should also be made public for anyone to verify the new estimates.
Notes:
- See http://mospi.gov.in/publication/documents-report-sub-committee-national-income-0 for the official reports.
- For details, see my papers on this issue.
- Both these issues and their possible remedies are discussed extensively in C. Rangarajan-headed National Statistical Commission (NSC) report in 2001. See, http://mospiold.nic.in/Mospi_New/upload/inds_stat_5.html, accessed on November 16, 2016.
Further Reading
- Nagaraj, Rayaprolu (2009), “Is Services Sector Output Overestimated? An Inquiry”, Economic and Political Weekly, Vol. 44, No. 5, pp 40-45. Available here.
- Rajakumar, Dennis and SL Shetty (2016), “Continuous Revisions Cast Doubts on GDP Advance Estimates”, Economic and Political Weekly, Vol. 51, No. 10. Available here.

Comments will be held for moderation. Your contact information will not be made public.